blocking
11 TopicsAzure SQL Performance Troubleshooting: When High Latency Is Not High CPU
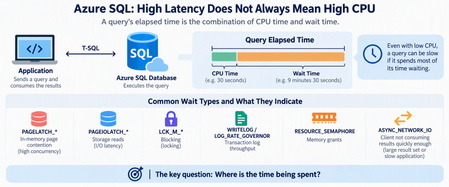
When an application connected to Azure SQL Database becomes slow or starts timing out, one of the first questions is usually: Is the database running out of CPU? It's a reasonable starting point, but CPU is only one part of the performance story. Some Azure SQL performance problems occur while CPU, Data IO, and worker utilization appear healthy. The database may have plenty of compute capacity while queries spend most of their time waiting rather than executing. The key troubleshooting question is therefore not simply: "How much CPU is Azure SQL using?" Instead, ask: "Where is the elapsed time being spent?" Start With Resources, But Don't Stop There Resource utilization should still be the first checkpoint. A simple query using sys.dm_db_resource_stats can help identify whether Azure SQL is approaching CPU, Data IO, Log IO, memory, or worker limits: SELECT DB_NAME() AS database_name, AVG(avg_cpu_percent) AS avg_cpu_percent, MAX(avg_cpu_percent) AS max_cpu_percent, MAX(avg_data_io_percent) AS max_data_io_percent, MAX(avg_log_write_percent) AS max_log_write_percent, MAX(avg_memory_usage_percent) AS max_memory_percent, MAX(max_worker_percent) AS max_worker_percent FROM sys.dm_db_resource_stats; If CPU is consistently near 100%, investigate CPU consumption. If Log IO reaches its limit, investigate transaction-log generation. If workers are exhausted, investigate concurrency. But if none of these resources is saturated, don't conclude that Azure SQL is healthy. Move to wait analysis. Follow the Waits A useful simplified model is: Query elapsed time = CPU execution If a query runs for 10 minutes but uses only 30 seconds of CPU, most of its elapsed time occurred somewhere else. Common wait patterns can point the investigation in different directions: Wait Area to investigate PAGELATCH_* In-memory page contention PAGEIOLATCH_* Storage reads LCK_M_* Blocking WRITELOG Transaction log LOG_RATE_GOVERNOR Log throughput RESOURCE_SEMAPHORE Memory grants ASYNC_NETWORK_IO Client/result consumption The wait type is not automatically the root cause. Think of it as a sign telling you: Look in this direction next. PAGELATCH Does Not Mean Slow Storage One important distinction is: PAGELATCH versus: PAGEIOLATCH Despite their similar names, they represent different problems. PAGEIOLATCH is associated with waiting for data pages involved in physical I/O. PAGELATCH, however, is synchronization around pages that are already in memory. Consider a highly concurrent workload: Hundreds of sessions ↓ Same memory page ↓ Latch contention ↓ Sessions wait ↓ Application CPU may still have available capacity. This is why increasing vCores doesn't necessarily eliminate latch contention. Additional compute provides more workload headroom, but it doesn't automatically remove a serialization point around a hot page. Microsoft's I/O troubleshooting guidance also distinguishes PAGEIOLATCH and other I/O-related waits when diagnosing storage-performance problems. Microsoft Learn: Troubleshoot SQL Server I/O performance Query Frequency Matters Too Another common mistake is focusing only on individually expensive queries. Imagine a query that takes only 20 milliseconds but executes hundreds of thousands of times, often concurrently. Its impact is better thought of as: Workload Impact = Cost per execution × Execution frequency × A small metadata lookup or initialization query can become significant when hundreds of application instances execute it simultaneously. This is where Query Store becomes particularly useful. Query Store preserves query, execution-plan, and runtime history, allowing you to compare executions, duration, CPU, plans, and other performance characteristics over time. Microsoft Learn: Monitor performance using Query Store Instead of asking only: "What's my most expensive query?" also ask: "What changed in the workload?" When Nine Hours of Duration Is Only One Minute of CPU Now consider the opposite problem. Suppose Query Store shows something like: Elapsed time 9 hours SQL CPU time 1 minute Returned rows 750,000+ Dominant wait ASYNC_NETWORK_IO Would adding CPU solve this? Probably not. CPU represents only a tiny fraction of the elapsed time. ASYNC_NETWORK_IO commonly occurs when SQL Server has results available but the client application is not consuming them quickly enough. Microsoft documents several possible causes, including: large result sets; slow application processing; applications fetching rows slowly; network-related delays. Microsoft Learn: Troubleshoot ASYNC_NETWORK_IO Importantly: ASYNC_NETWORK_IO does not automatically mean the network is slow. The bottleneck might actually be the application. Measure Time to First Row A useful troubleshooting technique is to separate database response time from result-consumption time. Instead of measuring only: Query start → Application finished measure: T0 = Query submitted T1 = First row received T2 = Last row received T3 = Application processing completed You can then separate: Database response = T1 - T0 Result consumption = T2 - T1 Application For example: First row received: 2 seconds Last row received: 2 hours Processing completed: 2.5 hours Calling this a "2.5-hour SQL query" would be misleading. SQL started returning results after two seconds. Most of the time was spent transferring or processing them. Don't Forget Blocking Low CPU can also be caused by blocking. If many sessions are waiting behind a transaction, increasing CPU isn't going to solve the problem. During an active incident, check requests and their waits: SELECT r.session_id, r.blocking_session_id, r.status, r.wait_type, r.wait_time, r.wait_resource, r.cpu_time, r.total_elapsed_time, st.text FROM sys.dm_exec_requests AS r CROSS APPLY sys.dm_exec_sql_text(r.sql_handle) AS st WHERE r.blocking_session_id <> 0 ORDER BY r.wait_time DESC; This helps determine whether the application is experiencing a resource problem or simply waiting behind another transaction. Why Scaling Can Be Misleading Imagine this sequence: Application slow ↓ Scale database ↓ Performance improves It's tempting to conclude: "We needed more CPU." But scaling can change more than CPU availability. Depending on the operation and environment, it can alter resource availability or execution conditions. Therefore: A successful mitigation does not automatically prove the root cause. Always distinguish between: What made the symptoms disappear? and: What originally caused the symptoms? A Practical Troubleshooting Workflow When investigating Azure SQL performance, I use the following approach: 1. Define the exact incident window Preferably using UTC timestamps. 2. Check core resources Look at: CPU Data IO Log IO memory workers 3. Compare CPU time with elapsed time If: Elapsed ≈ CPU investigate computational workload. If: Elapsed >>> CPU investigate waits. 4. Identify dominant waits Ask what prevented SQL from continuing execution. 5. Check blocking Determine whether requests are waiting behind other transactions. 6. Use Query Store Compare healthy and problematic periods for: execution count; CPU; duration; logical reads; plans; wait behavior. Microsoft provides Query Store examples specifically for workload and performance investigation. Microsoft Learn: Tune performance with Query Store 7. Inspect the execution plan Look for inefficient access patterns, cardinality problems, excessive reads, repeated lookups, spills, scans, or plan changes. 8. Investigate the application Especially when SQL CPU is low but result-transfer waits are high. Look at: rows returned; fetch size; batch size; application processing; concurrency; downstream dependencies. 9. Compare healthy vs unhealthy periods Don't analyze an incident in isolation. Ask: What changed? Common Misdiagnoses "CPU isn't 100%, so SQL is healthy." Not necessarily. Queries might simply be waiting. "ASYNC_NETWORK_IO means we have a network problem." Not necessarily. The client may be consuming results slowly. "PAGELATCH means storage is slow." No. Don't confuse PAGELATCH with PAGEIOLATCH. "Scaling fixed the problem, so CPU was the root cause." Not necessarily. Mitigation and root cause are different concepts. "The slowest query must be the problem." Not always. A small query executed extremely frequently can generate larger cumulative impact. Final Thought: Follow the Time When Azure SQL becomes slow, avoid jumping directly from: Slow database → Add more vCores Instead, work through: High latency ↓ Resource utilization ↓ CPU vs elapsed time ↓ Wait statistics ↓ Query Store ↓ Execution plan ↓ Application behavior ↓ Root cause ↓ Targeted optimization Performance troubleshooting becomes much easier once you stop asking only: "How busy is Azure SQL?" and start asking: "Where did the time go?" Because sometimes the database isn't busy at all. It's waiting. References Monitor Performance by Using the Query Store Tune performance with the Query Store Troubleshoot slow queries resulting from ASYNC_NETWORK_IO Troubleshoot slow SQL Server performance caused by I/O issues
Creating alerts for custom errors with auditing and Log Analytics
Errors are an inherent part of any application. As a database professional managing an Azure SQL Managed Instance, you may be interested in understanding when specific errors occur and how to leverage user-generated errors to respond swiftly when particular scenarios arise. On this post we will see how we can setup alerts for scenarios like query blocking and long open transactions. This will be an extend of what is described on How to setup alerts for deadlocks using Log Analytics | Microsoft Community Hub Step 1 - Setup Log Analytics and auditing Follow steps 1, 2, 3 and 4 described on How to setup alerts for deadlocks using Log Analytics | Microsoft Community Hub Step 2 - Create a table to save the details of the blocking chain / long open transaction Getting an alert itself is not useful if you don`t have a way of getting details for later analysis. Create the table on a database of your choice. If you are interested on blocking: CREATE TABLE [dbo].[blocking_report] ( [DateTime] [datetime] NULL ,[HeadBlocker] [varchar](1) NOT NULL ,[SessionID] [smallint] NOT NULL ,[Login] [nvarchar](128) NOT NULL ,[Database] [nvarchar](128) NULL ,[BlockedBy] [smallint] NULL ,[OpenTransactions] [int] NULL ,[Status] [nvarchar](30) NOT NULL ,[WaitType] [nvarchar](60) NULL ,[WaitTime_ms] [bigint] NULL ,[WaitResource] [nvarchar](256) NULL ,[WaitResourceDesc] [nvarchar](3072) NULL ,[Command] [nvarchar](32) NULL ,[Application] [nvarchar](128) NULL ,[TotalCPU_ms] [int] NOT NULL ,[TotalPhysicalIO_MB] [bigint] NULL ,[MemoryUse_KB] [int] NULL ,[LoginTime] [datetime] NOT NULL ,[LastRequestStartTime] [datetime] NOT NULL ,[HostName] [nvarchar](128) NULL ,[QueryHash] [binary](8) NULL ,[BlockerQuery_or_MostRecentQuery] [nvarchar](max) NULL ) If you are interested on open transactions: CREATE TABLE [dbo].[opentransactions]( [CapturedTime] [datetime] NOT NULL, [tran_elapsed_time_seconds] [int] NULL, [transaction_begin_time] [datetime] NOT NULL, [session_id] [int] NOT NULL, [database_name] [nvarchar](128) NULL, [open_transaction_count] [int] NOT NULL, [host_name] [nvarchar](128) NULL, [program_name] [nvarchar](128) NULL, [login_name] [nvarchar](128) NULL, [status] [nvarchar](30) NULL, [text] [nvarchar](max) NULL ) Step 3 - Create a SQL Agent job Schedule the two SQL Agent jobs using the queries below. You might be interested on schedule that runs every X amount of seconds/minutes. Describing very briefly what each query does: if a query is being blocked for more than 60 seconds, save the blocking chain on a table and raise an error if a transaction is open for more than 120 seconds, save the query details on a table and raise an error Make the necessary adjustments according to your goals. Query for blocking: IF ( SELECT count(*) FROM sys.dm_exec_requests WHERE wait_type LIKE 'LCK%' AND wait_time > 60000 ) > 0 -- checks for queries waiting to obtain a lock for more than 30 seconds BEGIN INSERT INTO database_name.dbo.Blocking_report -- make sure that you change the database_name value SELECT ( SELECT getdate() ) ,[HeadBlocker] = CASE WHEN r2.session_id IS NOT NULL AND ( r.blocking_session_id = 0 OR r.session_id IS NULL ) THEN '1' ELSE '' END ,[SessionID] = s.session_id ,[Login] = s.login_name ,[Database] = db_name(p.dbid) ,[BlockedBy] = w.blocking_session_id ,[OpenTransactions] = r.open_transaction_count ,[Status] = s.STATUS ,[WaitType] = w.wait_type ,[WaitTime_ms] = w.wait_duration_ms ,[WaitResource] = r.wait_resource ,[WaitResourceDesc] = w.resource_description ,[Command] = r.command ,[Application] = s.program_name ,[TotalCPU_ms] = s.cpu_time ,[TotalPhysicalIO_MB] = (s.reads + s.writes) * 8 / 1024 ,[MemoryUse_KB] = s.memory_usage * 8192 / 1024 ,[LoginTime] = s.login_time ,[LastRequestStartTime] = s.last_request_start_time ,[HostName] = s.host_name ,[QueryHash] = r.query_hash ,[BlockerQuery_or_MostRecentQuery] = txt.TEXT FROM sys.dm_exec_sessions s LEFT OUTER JOIN sys.dm_exec_connections c ON (s.session_id = c.session_id) LEFT OUTER JOIN sys.dm_exec_requests r ON (s.session_id = r.session_id) LEFT OUTER JOIN sys.dm_os_tasks t ON ( r.session_id = t.session_id AND r.request_id = t.request_id ) LEFT OUTER JOIN ( SELECT * ,ROW_NUMBER() OVER ( PARTITION BY waiting_task_address ORDER BY wait_duration_ms DESC ) AS row_num FROM sys.dm_os_waiting_tasks ) w ON (t.task_address = w.waiting_task_address) AND w.row_num = 1 LEFT OUTER JOIN sys.dm_exec_requests r2 ON (s.session_id = r2.blocking_session_id) LEFT OUTER JOIN sys.sysprocesses p ON (s.session_id = p.spid) OUTER APPLY sys.dm_exec_sql_text(ISNULL(r.[sql_handle], c.most_recent_sql_handle)) AS txt WHERE s.is_user_process = 1 AND ( r2.session_id IS NOT NULL AND ( r.blocking_session_id = 0 OR r.session_id IS NULL ) ) OR blocked > 0 ORDER BY [HeadBlocker] DESC ,s.session_id; THROW 50000 ,'There are queries being blocked for more than 60 seconds' ,1; END Query for open transactions: DECLARE @count INT = ( SELECT count(*) FROM sys.dm_tran_active_transactions at INNER JOIN sys.dm_tran_session_transactions st ON st.transaction_id = at.transaction_id LEFT OUTER JOIN sys.dm_exec_sessions sess ON st.session_id = sess.session_id LEFT OUTER JOIN sys.dm_exec_connections conn ON conn.session_id = sess.session_id OUTER APPLY sys.dm_exec_sql_text(conn.most_recent_sql_handle) AS txt WHERE DATEDIFF(SECOND, transaction_begin_time, GETDATE()) > 120 -- 120 seconds ) IF @count > 0 BEGIN INSERT INTO database_name.dbo.opentransactions -- change database_name to where the table was created SELECT GETDATE() AS CapturedTime ,DATEDIFF(SECOND, transaction_begin_time, GETDATE()) AS tran_elapsed_time_seconds ,at.transaction_begin_time ,st.session_id ,DB_NAME(sess.database_id) AS database_name ,st.open_transaction_count ,sess.host_name ,sess.program_name ,sess.login_name ,sess.STATUS ,txt.TEXT FROM sys.dm_tran_active_transactions at INNER JOIN sys.dm_tran_session_transactions st ON st.transaction_id = at.transaction_id LEFT OUTER JOIN sys.dm_exec_sessions sess ON st.session_id = sess.session_id LEFT OUTER JOIN sys.dm_exec_connections conn ON conn.session_id = sess.session_id OUTER APPLY sys.dm_exec_sql_text(conn.most_recent_sql_handle) AS txt WHERE DATEDIFF(SECOND, transaction_begin_time, GETDATE()) > 120 --120 seconds ORDER BY tran_elapsed_time_seconds DESC; THROW 50000 ,'There are open transactions for more than 120 seconds' ,1; END Step 4 - Create the alert based on a Log Analytics query Just as described on steps 6 and 7 of How to setup alerts for deadlocks using Log Analytics | Microsoft Community Hub, you can create the two separate alerts using the queries below. For blocking: AzureDiagnostics | where TimeGenerated > ago(15m) //last 15 minutes | where LogicalServerName_s == "server_name" //server name | where Category == "SQLSecurityAuditEvents" | where additional_information_s contains "There are queries being blocked for more" | project TimeGenerated, LogicalServerName_s, database_name_s, additional_information_s For open transactions: AzureDiagnostics | where TimeGenerated > ago(15m) //last 15 minutes | where LogicalServerName_s == "server_name" //server name | where Category == "SQLSecurityAuditEvents" | where additional_information_s contains "There are open transactions for more than" | project TimeGenerated, LogicalServerName_s, database_name_s, additional_information_s313Views0likes0CommentsLesson Learned #529: Troubleshooting Application Slowness Using SSMS Copilot
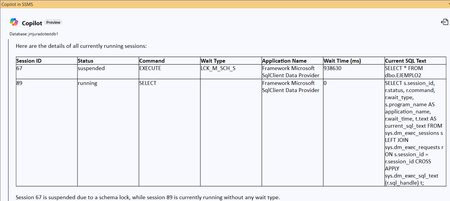
Some days ago, I worked on a support case where a customer reported application slowness affecting multiple users. Instead of jumping into traces or manually writing diagnostic queries, we used SSMS Copilot to investigate the issue. I would like to share with you how we diagnosed and understood the root cause. To illustrate the case, let’s walk through a simplified example: we create a new table, and right after that, we add a new column to it. CREATE TABLE Ejemplo2 (ID INT) BEGIN TRANSACTION ALTER TABLE dbo.eJEMPLO2 ADD NuevoCampo INT NULL Using SQL Server Management Studio and Copilot we executed the following prompt: Please, provide all currently running or suspended sessions. Include session ID, status, command, wait type (if any), application_name, wait time, and current SQL text. We got the following results: I executed multiple times the same prompt and always the session ID 67 is in suspended mode and Wait_type LCK_M_SCH_S, for this reason, I run a new prompt: Please, provide all sessions that are currently blocked by another session. Include session ID, the blocking session ID, wait type, and the blocked SQL text . At the end, I found that the session 51 is blocking the session ID 67 and for this reason, I run a new prompt: do we any have active transaction pending for commit for the session ID 51. So, I understand that the Session ID 51 has a transaction open, so, let's ask the details of the session 51, with a new prompt: Please, show the most recent SQL statement executed by session ID 51, even if the session is currently sleeping or not running any active request. Include the session status and login name as well. Use sys.dm_exec_connections and most_recent_sql_handle to retrieve the query text if necessary. Well, we identified the problem, the session ID 67 is running a SELECT * FROM sys.Ejemplo2 but it's beging blocked by the session 51. Session ID 51 hasn’t finished its transaction, and now we either need to commit, rollback, or kill that session, especially if we don’t have access to the application that owns it. Before resolving the issue, I asked Copilot an additional prompt: Please, explain why session ID 67 is currently waiting. Include the wait type, and explanation of that, the resource being waited on, how long it has been waiting (seconds), and the SQL text. Also identify if another session is blocking it. The name of the object and schema Please, provide recommendations to prevent or reduce this kind of blocking situation in the future, based on the current wait type and blocking scenario observed with session ID 67. Please, summarize all current blocking chains in the system. Include blocking session IDs, blocked session IDs, wait types, wait durations, login names, and SQL statements involved.231Views0likes0CommentsLesson Learned #491: Monitoring Blocking Issues in Azure SQL Database
Time ago, we wrote an article Lesson Learned #22: How to identify blocking issues? today, I would like to enhance this topic by introducing a monitoring system that expands on that guide. This PowerShell script not only identifies blocking issues but also calculates the total, maximum, average, and minimum blocking times.2.2KViews0likes0CommentsLesson Learned #330: Blocking issues Sch-M and Sch-S
Today, I worked in a very interested case. Our customer is trying to run an ALTER TABLE <TableName> to add two columns but this process is taking too much time, even, when the documentation reported "Starting with SQL Server 2012 (11.x) Enterprise Edition, adding a NOT NULL column with a default value is an online operation when the default value is a runtime constant. This means that the operation is completed almost instantaneously despite the number of rows in the table, because the existing rows in the table aren't updated during the operation" https://learn.microsoft.com/en-us/sql/t-sql/statements/alter-table-transact-sql?view=azuresqldb-current#adding-not-null-columns-as-an-online-operation7.5KViews0likes0CommentsLesson Learned #319: Lock request time out period exceeded using SSMS
Today, we got a service request that our customer got the following error message: Lock request time out period exceeded. (.Net SqlClient Data Provider) using SQL Server Management Studio. Following I would like to share with you some details about this issue and how to find and fix it.23KViews0likes0Comments[Resolved] Adding cookies to the Allow list makes them bypass the 3rd party cookie blocking !?
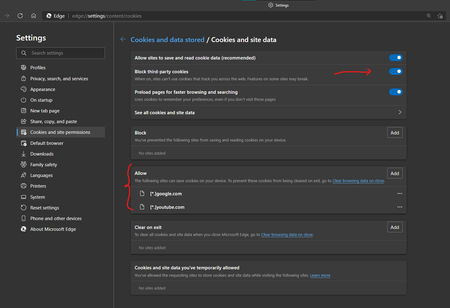
When I turn on 3rd party cookie blocking, and add [*.]youtube.com [*.]google.com to the allow list of cookies this causes Google and YouTube cookies to be read and accessed in Reddit and other sites, Even though 3rd party Cookie blocking is enabled. Edge (or Chromium in general, since it happens on Chrome 88 stable too) is confused. that Allow list is for allowing certain cookies to enter or stay in the browser, the Allow list is Not a 3rd party cookie bypass list. my actual setup and configuration was more complex but I had to do lots of testing to find out why Reddit still detects and asks me to sign into my Google account when 3rd party cookie blocking is enabled!3.9KViews3likes9CommentsAdd Audio-only blocking to Media autoplay blocking in Edge browser
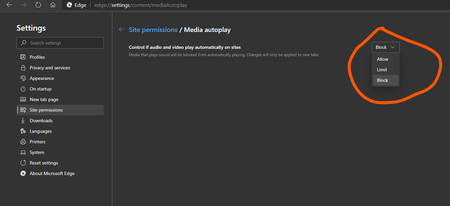
Currently the media Auto-play blocking options (Allow, Limit, Block) only apply to Videos. but what if we want the video to be auto-played, but its audio be muted by default? so I think these options needed to be added to that settings page which also has lots of vacant space left to be filled with useful options. edge://settings/content/mediaAutoplay Block Audio Block Video Block Audio and Video (should also block Auto-Buffering/preloading of media)3.2KViews5likes6CommentsList of the REMOVED features in the latest Edge insider Canary update Version 79.0.305.0
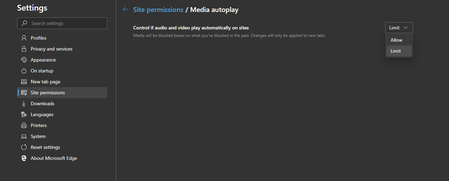
1. Block option is Removed and only Limit and Allow is available You can confirm this too by going into your settings edge://settings/content/mediaAutoplay 2. Another removed option in this latest Canary update in the previous Canary version (79.0.304.0) , the InPrivate mode window would look like this:4.5KViews3likes18Comments