azure sql managed instance
342 Topics
Public Preview: Performance monitoring for Azure SQL in Database Hub
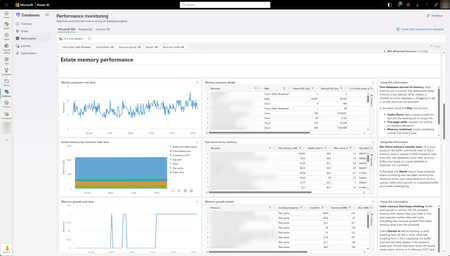
We're excited to announce the public preview of performance monitoring for Azure SQL in Database Hub in Fabric. Performance monitoring brings the health and performance of your SQL estate into Database Hub. You see every supported database in one place and quickly spot the ones that need attention. It works across: Azure SQL Database Azure SQL Managed Instance (coming soon) SQL Server on Azure Virtual Machines SQL Server enabled by Azure Arc Microsoft collects performance-related telemetry, runs the pipeline, and stores the data for you. There's nothing you need to deploy and nothing to operate. Turn it on, and your SQL resources show up on the Performance page in Database Hub, which is free. This post is a deep dive on the performance part of Database Hub. For the full tour, including the Overview, Estate, and Security pages, read Database Hub in Fabric: Now in Public Preview. Get started in three steps Open Database Hub in Fabric. During the preview, a Fabric administrator needs to turn on the Database Hub tenant setting. See the prerequisites. Turn on performance monitoring for your SQL resources. See Enable performance monitoring for Microsoft SQL. Go to the Performance page to see which databases need your attention. See your entire database estate in Database Hub Performance monitoring powers the Performance page in Database Hub. Database Hub is built for when you need to look across all your databases, not just one at a time. It brings your database estate across Azure, on-premises, and other clouds into one place, including: Azure SQL and SQL Server enabled by Azure Arc Azure Database for PostgreSQL Azure Cosmos DB The Performance page comes with prebuilt dashboards, so you can see performance at a glance without building anything yourself. The dashboards are designed to quickly answer two questions: Are my databases healthy? Which ones need my attention? From there, you can drill into resource usage, waits, and session activity to understand what's driving a change in performance. With Database Hub, you can: Get estate-wide visibility into health and performance across database types Investigate the root cause of performance issues across many databases Use AI-assisted analysis to find and explain issues faster To learn more, see What is Database Hub in Fabric? Why we built this Monitoring SQL performance at scale often meant building and running your own monitoring stack. Before you could effectively answer, "Which of my databases need attention right now?" you typically had to: Deploy and configure a collection resource, such as a watcher or an agent Build a telemetry pipeline to move the data Provision a data store, and then pay for it, secure it, and keep it running Build dashboards on top of all of it Repeat for every new server, database, or region That's a lot of work before you see your first chart. And every step is another thing that can break, drift, or quietly stop collecting data. Customers are also turning to AI to make sense of their database estate. They want an AI agent that can spot a performance problem, explain what's causing it, and recommend a fix. But an AI agent is only as good as the data it can reach. It operates best with one consistent source of performance data across every database, not a patchwork of tools and data stores. We heard this feedback loud and clear from customers. You told us you love having at-scale dashboards and ownership of your performance data. You also told us that setting up a telemetry stack was time-consuming, scale limits got in the way, and running the data store added operational burden and cost overhead. One customer put it simply: they wanted to spend less time managing their telemetry infrastructure and more time managing and improving their databases. Performance monitoring keeps the parts you valued and removes the infrastructure you had to manage. That's why it feeds Database Hub directly. You get one place to see your whole estate, and your AI agents get one consistent source of performance data. No infrastructure to manage (or pay for) With performance monitoring, there's no monitoring infrastructure for you to deploy, size, or run. It's all managed by Microsoft, with no scale limits on how many targets you can monitor. Telemetry is collected close to the database engine and sent to a Microsoft-managed telemetry pipeline and data store. Access to that data is governed by Azure role-based access control (RBAC), so people only see telemetry for the resources they already have access to. Consistent telemetry across your SQL estate Performance monitoring collects the same core set of performance data across every supported SQL deployment, whether it runs in Azure, on-premises, or in another cloud. That means one mental model and one set of dashboards in Database Hub, instead of a different tool for every flavor of SQL. The preview collects performance-related telemetry, including: CPU and memory utilization Wait statistics Active sessions Storage I/O and database storage utilization Performance counters Client connections Database properties Availability group, replica, and database replica health Go beyond Database Hub with KQL Database Hub covers the most common performance questions. When you need a view that Database Hub doesn't show, you can query the same telemetry directly with Kusto Query Language (KQL). The telemetry is available through a Microsoft-managed, RBAC-governed endpoint, so you don't need to create or pay for your own Azure Data Explorer cluster. Use it to: Build your own Real-Time Dashboards and reports Connect tools you already use, such as Grafana or Power BI Give an AI agent access to investigate performance across your estate To get started, see Query performance monitoring telemetry. It includes the schema, connection steps, and ready-to-run starter queries. Turn on performance monitoring How you turn on performance monitoring depends on the resource type. For all of the steps in one place, see Enable performance monitoring for Microsoft SQL. Resource type How monitoring is enabled in preview Step-by-step guidance Azure SQL Database Add an extended property to each database you want to monitor. You can also select Enable Performance Monitoring in Database Hub. Azure SQL Database Azure SQL Managed Instance (coming soon) Coming soon Coming soon SQL Server on Azure VMs Turn on a feature flag in the SQL IaaS Agent extension. SQL Server on Azure VMs SQL Server enabled by Azure Arc On by default once the server is connected to Azure Arc. SQL Server enabled by Azure Arc To view performance monitoring data, you need: The Reader role, or a role with higher privileges, on each subscription that contains the resources you want to view. The Microsoft.AzureArcData resource provider registered on each subscription. For steps, see Register the Azure resource provider. Availability Performance monitoring is available in public preview in select Azure regions. For the current list of supported regions, see Regional availability and data handling. Learn more Database Hub in Fabric: Now in Public Preview What is Database Hub in Fabric? Enable performance monitoring for Microsoft SQL Query performance monitoring telemetry Supplemental Terms of Use for Microsoft Azure Previews650Views1like5CommentsStop defragmenting and start living: auto index compaction is now generally available
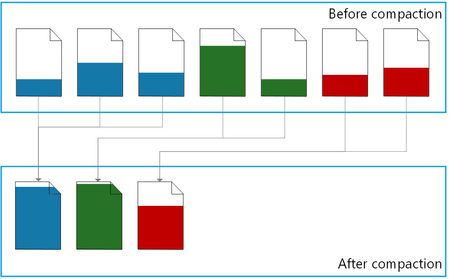
Executive summary Automatic index compaction is a built-in MSSQL database engine feature that compacts indexes in background and with minimal overhead. Now you can: Stop using scheduled index maintenance jobs. Reduce storage space consumption and save costs. Improve performance by reducing CPU, memory, and disk I/O consumption. Automatic index compaction is now generally available in Azure SQL Database, Azure SQL Managed Instance with the always-up-to-date update policy, and SQL database in Fabric. Index maintenance without maintenance jobs Enable automatic index compaction for a database with a single T-SQL command: ALTER DATABASE [database-name] SET AUTOMATIC_INDEX_COMPACTION = ON; Once enabled, you no longer need to set up, maintain, and monitor resource intensive index maintenance jobs, a time-consuming operational task for many DBA teams today. As the data in the database changes, a background process consolidates rows from partially filled data pages into a smaller number of filled up pages, and then removes the empty pages. Index bloat is eliminated – the same amount of data now uses a minimal amount of storage space. Resource consumption is reduced because the database engine needs fewer disk IOs and less CPU and memory to process the same amount of data. By design, the background compaction process acts on the recently modified pages only. This means that its own resource consumption is much lower compared to the traditional index maintenance operations (index rebuild and reorganize), which process all pages in an index or its partition. For a detailed description of how the feature works, a comparison between automatic index compaction and the traditional index maintenance operations, and the ways to monitor the compaction process, see automatic index compaction in documentation. Let the numbers speak As auto index compaction becomes generally available, it is already enabled in more than 6 million databases worldwide, most of them from Microsoft internal customers who helped validate the feature during preview. Hundreds of external customers also enabled auto compaction during preview and have been enjoying the benefits, with zero issues reported. Looking at our worldwide telemetry data for a 28-day window, automatic index compaction freed up approximately 14.3 petabytes of space in data files by consolidating 547.5 trillion rows on fewer pages, saving resources and improving query performance. Looking at the space freed up per database, the benefits range from a few megabytes per day for databases with already dense pages, to more than 500 gigabytes per day for databases that have gone through one-time extensive data modifications. Compaction in action To see the effects of automatic index compaction, we wrote a stored procedure that simulates a write-intensive OLTP workload. Each execution of the procedure inserts, updates, deletes, or selects a random number of rows, from 1 to 100, in a 50,000-row table with a clustered index. We executed this stored procedure using a popular SQLQueryStress tool, with 30 threads and 400 iterations on each thread. We measured the page density, the number pages in the leaf level of the table’s clustered index, and the number of logical reads (pages) used by a test query reading 1,000 rows, at three points in time: After initially inserting the data and before running the workload. Once the workload stopped running. Several minutes later, once the background process completed index compaction. Here are the results: Before workload After workload After compaction Logical reads 25 🟢 1,610 🔴⬆️ 35 🟢⬇️ Page density 99.51% 🟢 52.71% 🔴⬇️ 96.11% 🟢⬆️ Pages 962 🟢 4,394 🔴⬆️ 1,065 🟢⬇️ Before the workload starts, page density is high because nearly all pages are full. The number of logical reads required by the test query is minimal, and so is its resource consumption. The workload leaves a lot of empty space on pages and increases the number of pages because of row updates and deletions, and because of page splits. As a result, immediately after workload completion, the number of logical reads required for the same test query increases more than 60 times, which translates into a higher CPU and memory usage. But then within a few minutes, automatic index compaction removes the empty space from the index, increasing page density back to nearly 100%, reducing logical reads by about 98% and getting the index very close to its initial compact state. Less logical reads means that the query is faster and uses less CPU. All of this without any user action. With continuous workloads, index compaction is continuous as well, maintaining higher average page density and reducing resource usage by the workload over time. The T-SQL code we used in this demo is available in the Appendix. Conclusion Automatic index compaction delegates a routine database maintenance operation to the database engine itself, letting administrators and engineers focus on more important work without worrying about index maintenance. Making this feature generally available doesn’t mean that we stop working on it. Your feedback during preview helped us find new opportunities to fine-tune the compaction process. We thank you for that feedback and look forward to announcing new improvements in auto index compaction in the future. Appendix Here is the T-SQL code we used to demonstrate automatic index compaction. The type of executed statements and the number of affected rows is randomized to better represent an OLTP workload. While the results demonstrate the effectiveness of automatic index compaction, exact measurements may vary from one execution to the next. /* Enable automatic index compaction */ ALTER DATABASE CURRENT SET AUTOMATIC_INDEX_COMPACTION = ON; /* Reset to the initial state */ DROP TABLE IF EXISTS dbo.t; DROP SEQUENCE IF EXISTS dbo.s_id; DROP PROCEDURE IF EXISTS dbo.churn; /* Create a sequence to generate clustered index keys */ CREATE SEQUENCE dbo.s_id AS int START WITH 1 INCREMENT BY 1; /* Create a test table */ CREATE TABLE dbo.t ( id int NOT NULL CONSTRAINT df_t_id DEFAULT (NEXT VALUE FOR dbo.s_id), dt datetime2 NOT NULL CONSTRAINT df_t_dt DEFAULT (SYSDATETIME()), u uniqueidentifier NOT NULL CONSTRAINT df_t_uid DEFAULT (NEWID()), s nvarchar(100) NOT NULL CONSTRAINT df_t_s DEFAULT (REPLICATE('c', 1 + 100 * RAND())), CONSTRAINT pk_t PRIMARY KEY (id) ); /* Insert 50,000 rows */ INSERT INTO dbo.t (s) SELECT REPLICATE('c', 50) AS s FROM GENERATE_SERIES(1, 50000); GO /* Create a stored procedure that simulates a write-intensive OLTP workload. */ CREATE OR ALTER PROCEDURE dbo.churn AS SET NOCOUNT, XACT_ABORT ON; DECLARE @r float = RAND(CAST(CAST(NEWID() AS varbinary(4)) AS int)); /* Get the type of statement to execute */ DECLARE @StatementType char(6) = CASE WHEN @r <= 0.15 THEN 'insert' WHEN @r <= 0.30 THEN 'delete' WHEN @r <= 0.65 THEN 'update' WHEN @r <= 1 THEN 'select' ELSE NULL END; /* Get the maximum key value for the clustered index */ DECLARE @MaxKey int = ( SELECT CAST(current_value AS int) FROM sys.sequences WHERE name = 's_id' AND SCHEMA_NAME(schema_id) = 'dbo' ); /* Get a random key value within the key range */ DECLARE @StartKey int = 1 + RAND() * @MaxKey; /* Get a random number of rows, between 1 and 100, to modify or read */ DECLARE @RowCount int = 1 + RAND() * 99; /* Execute a statement */ IF @StatementType = 'insert' INSERT INTO dbo.t (id) SELECT NEXT VALUE FOR dbo.s_id FROM GENERATE_SERIES(1, @RowCount); IF @StatementType = 'delete' DELETE TOP (@RowCount) dbo.t WHERE id >= @StartKey; IF @StatementType = 'update' UPDATE TOP (@RowCount) dbo.t SET dt = DEFAULT, u = DEFAULT, s = DEFAULT WHERE id >= @StartKey; IF @StatementType = 'select' SELECT TOP (@RowCount) id, dt, u, s FROM dbo.t WHERE id >= @StartKey; GO /* The remainder of this script is executed three times: 1. Before running the workload using SQLQueryStress. 2. Immediately after the workload stops running. 3. Once automatic index compaction completes several minutes later. */ /* Monitor page density and the number of pages and records in the leaf level of the clustered index. */ SELECT avg_page_space_used_in_percent AS page_density, page_count, record_count FROM sys.dm_db_index_physical_stats(DB_ID(), OBJECT_ID('dbo.t'), 1, 1, 'DETAILED') WHERE index_level = 0; /* Run a test query and measure its logical reads. */ DROP TABLE IF EXISTS #t; SET STATISTICS IO ON; SELECT TOP (1000) id, dt, u, s INTO #t FROM dbo.t WHERE id >= 10000 SET STATISTICS IO OFF;7KViews3likes5CommentsDatabase Hub in Fabric: Now in Public Preview -Turn Database Signals into Guided Action
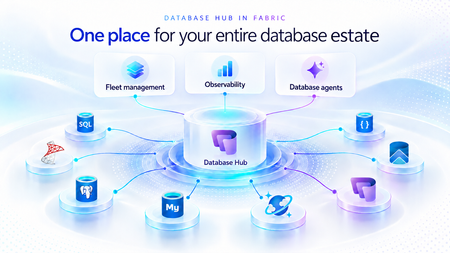
As applications grow, so does the database estate behind them. What starts with a handful of databases can become hundreds or thousands of resources spread across services, subscriptions, and environments. For the teams responsible for keeping them healthy, the challenge is no longer just collecting signals. It is knowing what needs attention, why it matters, and what to do next. Now in public preview, Database Hub in Microsoft Fabric brings inventory, health, performance, security, and optimization insights into one connected experience. It helps administrators and developers see the bigger picture, identify affected resources, and move from estate-wide visibility to focused investigation, without losing the context that brought them there. The preview brings together supported resources across Azure SQL Database, SQL Server enabled by Azure Arc, Azure Database for PostgreSQL, Azure Cosmos DB, and SQL database in Fabric. Available capabilities and signals vary by service and preview configuration. Database Hub Overview brings together estate-wide findings and cross-engine performance trends to help you prioritize what needs attention. Start with what needs your attention When you manage a large database estate, another dashboard is only useful if it helps you decide where to spend your time. The Overview page provides that starting point, bringing together findings across security, performance, and optimization. It distinguishes Issues, which require timely attention, from Suggestions, which highlight opportunities to improve your estate over time. You might begin with a security configuration that needs review or a performance signal that warrants investigation. Selecting a finding opens Estate with the relevant filters already applied, so you can see the affected resources rather than search for them again. The result is a more direct path from “something needs attention” to “these are the resources I should investigate.” Overview highlights issues across Security, Performance, and Optimization, with affected-resource counts and direct links to investigate further. Bring your estate into one view, and make it relevant to you The Estate experience brings supported resources into a unified inventory, scoped to your existing permissions. Search and filters help you narrow that inventory to the service, subscription, or resource group you manage. This is especially useful when your responsibilities span database engines. You can begin with a broader view, then focus on Azure SQL databases, Arc-enabled SQL Server resources, or Azure Database for PostgreSQL flexible servers without rebuilding the resource list in separate portals. Each resource brings its associated Issues and Suggestions into context. Open a finding to review the affected resource, supporting information, and recommended next step. The inventory also respects the resource model of each service. For example, the PostgreSQL view represents flexible server instances, rather than every database hosted within them. A unified view does not mean moving your databases. Your Azure resources remain in their existing subscriptions, and on-premises SQL Server instances remain on-premises, connected through Azure Arc. Database Hub brings operational context together; it does not require relocating or mirroring your application data into Fabric. Estate brings resource inventory, Issues, and Suggestions into one view, with quick actions to continue investigation in the Azure portal, VS Code, or SSMS. Understand security posture and performance in context Database Hub helps you identify configurations worth reviewing and resources that need a closer look. For security, supported signals can include Microsoft Entra authentication, customer-managed keys, and auditing coverage, depending on the database service. These findings provide a starting point for investigation, not a blanket judgment that every flagged resource is insecure or noncompliant. For example, a suggestion to review customer-managed keys should be evaluated against your organization’s requirements. A resource using service-managed keys is still encrypted at rest. For performance, built-in dashboards bring supported utilization and activity signals into view, including CPU, memory, storage, I/O, and connections. Review trends across your estate, then narrow the scope and time range to investigate individual resources. Metric availability varies by engine and monitoring configuration; missing data should not be interpreted as good health. For supported SQL monitoring scenarios, you can also create a custom monitoring dashboard from a template and tailor its charts and layout to the resources your team follows regularly. Together, these experiences help answer two practical questions: Where is pressure building, and where is there an opportunity to improve? Performance summaries highlight recent capacity signals and trends across Microsoft SQL, PostgreSQL, and Cosmos DB. The Security dashboard summarizes Microsoft Entra authentication, audit logging, and customer-managed key coverage, helping you identify configurations that warrant review across your estate. The Performance monitoring dashboard combines memory-pressure trends, resource-level details, and interpretation guidance to help focus your investigation. Move from a finding to an informed next step Estate-wide visibility is the beginning of an investigation, not a replacement for database expertise. When a finding needs deeper analysis, Database Hub helps you review the evidence and continue in the appropriate native experience, such as the Azure portal or SQL Server Management Studio (SSMS). Engine-specific diagnostics and configuration changes remain in the tools designed for that work. Consider a performance issue that occurred before an administrator could inspect it. In supported agent-assisted scenarios, captured incident evidence can help establish what happened, when it happened, and which queries or sessions were involved. That context gives the administrator a more informed starting point for investigation. The operator remains in control: review the evidence, evaluate the recommendation, and apply authorized changes through the appropriate service tools. The preview investigation workflow does not automatically remediate issues, and existing permissions and approval requirements continue to apply. Bring database expertise into agent-assisted workflows We are also making database operational intelligence available through agent skills: reusable capabilities that agents can call to support observability, monitoring, diagnostics, optimization, and other database operations. Database Hub provides estate context; skills provide a way to bring database expertise into an agent-assisted investigation. This creates a foundation for helping teams move from identifying an affected resource to understanding its signals and evaluating the next step. We’re building toward making this expertise available in the AI companions and development tools teams already use, with recommendations grounded in evidence, the specific database, and your organization’s operational controls. If we take a step back, our broader vision brings together a free, extensible Database Hub experience, agentic observability, and OneLake integration, all within Microsoft Fabric. It’s a foundation for connecting database operations with analytics and AI and helping teams turn signals into informed action. Get started with Database Hub Start with the Database Hub documentation to review preview availability, supported services, and setup requirements. Ask your Fabric administrator to enable the preview where required, confirm that you have the appropriate resource permissions, and complete any service-specific monitoring prerequisites. Then open Microsoft Fabric, select Databases in the left navigation, and begin with Overview. Choose a finding, explore the affected resources in Estate, and follow the evidence into your next investigation. For more details on supported services and getting set up, the Database Hub documentation is also available on Microsoft Learn.310Views4likes1CommentMI link support for multiple databases in an Always On availability group for SQL Server (Preview)
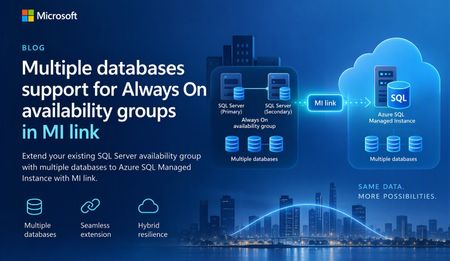
A simpler way to extend availability groups to Azure We are pleased to announce the preview of multi-database mode for Managed Instance link. The new mode lets you replicate multiple databases from an existing Always On availability group through a single link between SQL Server and Azure SQL Managed Instance. Managed Instance link uses distributed availability group technology to provide near-real-time replication between SQL Server and Azure SQL Managed Instance. It supports hybrid architectures, online migration, disaster recovery, and read-only workload offload. The link can be configured and managed through SQL Server Management Studio (SSMS), PowerShell, Azure CLI, and Azure APIs. Previously, each link supported one database. Customers with multi-database availability groups therefore had to split databases into separate availability groups and create a link for each database. Multi-database mode removes that limitation for supported SQL Server versions and editions, while the existing single-database mode remains available for earlier versions and other supported configurations. What you can do with multi-database link mode Migrate multiple databases to Azure SQL Managed Instance with minimal cutover downtime. Offload read-only workloads, including reporting and analytics, to the secondary replica. Use Azure SQL Managed Instance as a disaster recovery target for supported SQL Server versions. Start replication in either direction when the SQL Server version and Azure SQL Managed Instance update policy support that direction. Reverse primary and secondary roles through a planned failover. Build hybrid and multicloud topologies that place database groups where they are most useful. One link for an existing multi-database availability group If you already use an Always On availability group, multi-database link mode lets you extend the complete database group to Azure SQL Managed Instance without creating a separate availability group for every database. All databases in the link move together as one managed group. Databases on the primary are read-write, while their copies on the secondary are read-only. Use of your existing Always On AG listener endpoint is supported with multi-database mode MI link, allowing the link to remain operational after a local AG failover. Image 1: A multi-database Always On availability group replicated to Azure SQL Managed Instance through one Managed Instance link. The diagram illustrates the availability group relationship rather than a specific Azure SQL Managed Instance service-tier replica count. Managed Instance link is supported across all Azure SQL Managed Instance service tiers. Run multiple links in different directions A single SQL Server instance can participate in multiple links. Each link can carry a different availability group, and supported links can replicate in different directions at the same time. In the following example, AG1 (containing DB1, DB2, and DB3) replicates from SQL Server to Azure SQL Managed Instance through MI link 1. AG2 (containing DB4, DB5, and DB6) replicates from Azure SQL Managed Instance to SQL Server through MI link 2. Both links can operate at the same time between the two instances. Image 2: Two multi-database availability groups using separate links with opposite replication directions. Important: Database names must be unique in this configuration. A database cannot be renamed on the secondary while it is participating in replication to resolve a naming conflict. Replicate one availability group to multiple managed instances Multi-database mode also supports fan-out topologies. You can replicate multiple availability groups to one managed instance, or replicate the same availability group to different managed instances. For example, separate links can target managed instances in different Azure regions. Image 3: One multi-database availability group replicated through separate links to two Azure SQL managed instances. Preview requirements Requirement Details SQL Server SQL Server 2022 with CU27 or SQL Server 2025 with CU9 and above. Edition Enterprise or Developer edition. Standard edition supports basic availability groups with one database and is not supported for multi-database mode. Azure SQL Managed Instance Use a compatible update policy (2022 or 2025) matching your SQL Server version. SSMS SSMS 22.10.2 or later for the multi-database link capability. Automation Az module 16.3.0 or later and Az.Sql 7.1.0 or later, or the corresponding Azure APIs. Get started To evaluate multi-database mode during preview: Confirm that the SQL Server version, edition, servicing level, and Azure SQL Managed Instance update policy meet the preview requirements. Upgrade to SSMS 22.10.2 or later, or use a supported automation interface. Enable multi-database mode before creating a multi-database link. Create the link from the existing Always On availability group and validate synchronization for every database. Review the Azure documentation for multi-database Managed Instance link configuration, limitations, monitoring, failover, and cleanup guidance. Share your feedback We would love to hear about your experience with multi-database mode. Please share questions, feedback, and feature suggestions through the Managed Instance link feedback form.182Views0likes0CommentsUnlocking More Power with Flexible Memory in Azure SQL Managed Instance
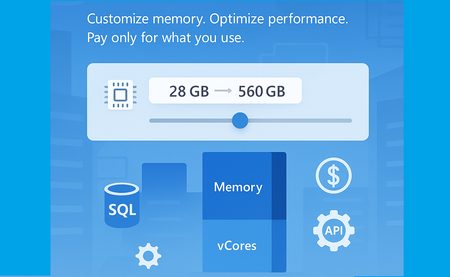
Service updates Sep 28th 2026. Business Critical: locally redundant and zone-redundant instances. Flexible memory is generally available (GA) for the Business Critical service tier. Aug 17th 2026. Next-gen General Purpose: zone-redundant instances. Flexible memory for the Next-gen General purpose tier is in public preview. May 6th 2026. Next-gen General Purpose: locally redundant instances. Flexible memory for the Next-gen General purpose tier is generally available (GA) As data workloads grow in complexity and scale, so does the need for more adaptable and performant database infrastructure. That’s why we’re excited to introduce a new capability in Azure SQL Managed Instance: Flexible Memory, now generally available. What Is Flexible Memory? Flexible Memory allows you to customize the memory-to-vCore ratio in your SQL Managed Instance, enabling finer control over both performance and cost based on your workload requirements. This capability is part of the next-generation General Purpose and Business Critical tiers. It introduces a memory slider, which enables you to scale memory independently within supported limits - without changing the number of vCores. The memory slider is currently available only on premium-series hardware. Why It Matters Traditionally, memory allocation in SQL Managed Instance was fixed per vCore. With Flexible Memory, you can now: Increase memory beyond the default allocation Optimize for memory-intensive workloads without overprovisioning compute Pay only for what you use - additional memory is billed per GB/hour This flexibility is especially valuable for scenarios like analytics, caching, or workloads with large buffer pool requirements. How It Works Memory scales based on the number of vCores and the selected hardware tier: Hardware Tier Memory per vCore (GB) Standard-series 5.1 Premium series 7–12 Premium series (memory-optimized) Up to 13.6 You can select from predefined memory ratios (e.g., 7, 8, 10, 12 GB per vCore) depending on your configuration. For example, a 10 vCore instance can be configured with 70 GB to 120 GB of memory. One of the most powerful aspects of the Flexible Memory feature is the ability to select from a range of memory-to-vCore ratios. These “click stops” allow you to tailor memory allocation precisely to your workload’s needs - whether you’re optimizing for performance, cost, or both. The table below outlines the available configurations for Premium Series hardware, showing how memory scales across 16 vCore sizes: vCores Available Ratios Total Memory Options (GB) 4 7, 8, 10, 12 28, 32, 40, 48 6 7, 8, 10, 12 42, 48, 60, 72 8 7, 8, 10, 12 56, 64, 80, 96 10 7, 8, 10, 12 70, 80, 100, 120 12 7, 8, 10, 12 84, 96, 120, 144 16 7, 8, 10, 12 112, 128, 160, 192 20 7, 8, 10, 12 140, 160, 200, 240 24 7, 8, 10, 12 168, 192, 240, 288 32 7, 8, 10, 12 224, 256, 320, 384 40 7, 8, 10, 12 280, 320, 400, 480 48 7, 8, 10 336, 384, 480 56 7, 8 392, 448 64 7 448 80 7 560 96 5.83 560 128 4.38 560 Pricing model Flexible Memory introduces a usage-based pricing model that ensures you only pay for the memory you actually consume beyond the default allocation. This model is designed to give you the flexibility to scale memory without overcommitting on compute resources - and without paying for unused capacity. How it works: Default memory is calculated based on the minimum memory-to-vCore ratio Billable memory is the difference between your configured memory and the default allocation. Billing is per GB/hour, so you’re charged only for the additional memory used over time. Let’s take an example of SQL Managed Instance running on premium series hardware with 4 vCores and 40GB of memory. Configuration Value vCores 4 Configured Memory 40 GB Default Memory (4 × 7 GB) 28 GB Billable Memory 12 GB Billing Unit Per GB/hour Charged For 12 GB of additional memory Management Experience Changing memory behaves just like changing vCores: Seamless updates via Azure Portal, PowerShell, SDK or API Failover group guidance remains the same Upgrade secondary first Configurations between primary and secondary should match Adjusting the memory is fully online operation, with a short failover at the very end of it. The operation will go through the process of allocating the new compute with specified configuration, which takes approximately 60 minutes, with new faster management operations. API Support Flexible Memory is fully supported via API (the minimal API version that can be used is 2024-08-01) and Azure Portal. Here’s a sample API snippet to configure memory: { "properties": { "memorySizeInGB": 96 } } Portal support Summary The new Flexible Memory capability in Azure SQL Managed Instance empowers you to scale memory independently of compute, offering greater control over performance and cost. With customizable memory-to-vCore ratios, a transparent pricing model, and seamless integration into existing management workflows, this feature is ideal for memory-intensive workloads and dynamic scaling scenarios. Whether you're optimizing for analytics, caching, or simply want more headroom without overprovisioning vCores, Flexible Memory gives you the tools to do it - efficiently and affordably. Next Steps Review the Documentation: Explore detailed configuration options, supported tiers, and API usage. Additional memory Management operations overview Management operations duration Test Your Workloads: Use the memory slider in the Azure Portal, PowerShell, SDK or API to experiment with different configurations. Learn more What is Azure SQL Managed Instance Try Azure SQL Managed Instance for free Next-gen General Purpose – official documentation Analyzing the Economic Benefits of Microsoft Azure SQL Managed Instance How 3 customers are driving change with migration to Azure SQL Accelerate SQL Server Migration to Azure with Azure Arc1.8KViews3likes0CommentsMore performance and flexibility for Azure SQL Managed Instance Business Critical
Higher transaction log throughput and flexible memory address two different resource dimensions, but they follow the same principle: giving customers more control over the resources they need for their workloads.190Views1like0CommentsPublic Preview: Zone-Redundant Next-Gen General Purpose for Azure SQL Managed Instance
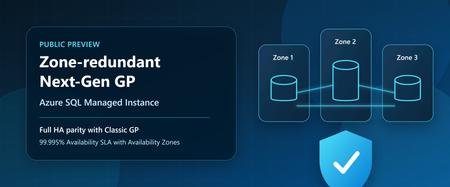
Customers no longer need to choose between the latest General Purpose architecture and zone-level resiliency. With the public preview of zone redundancy for Next-Generation General Purpose Azure SQL Managed Instance, organizations can now take advantage of all the benefits of Next-Generation General Purpose while meeting strict high availability and compliance requirements through Availability Zone protection. When Next-Generation General Purpose became generally available, it introduced a modernized General Purpose architecture delivering improved performance, greater scalability, enhanced flexibility, and better price-performance for Azure SQL Managed Instance workloads. Since then, customers have increasingly adopted the architecture to modernize SQL workloads, consolidate databases, and optimize total cost of ownership. Today, we're extending those benefits to customers who require zone-level resiliency. With zone redundancy now available in public preview, customers can realize all the advantages of Next-Generation General Purpose while meeting the same zone-level availability requirements previously available only with Classic General Purpose. This milestone brings full high-availability parity between Classic General Purpose and Next-Generation General Purpose, removing one of the last major reasons for customers to remain on the previous architecture. Closing the last major gap Zone redundancy has consistently been one of the most requested capabilities for Next-Generation General Purpose. Since its introduction, Next-Generation General Purpose has provided substantial improvements in scalability and flexibility, including support for up to 128 vCores, up to 32 TB of storage, up to 500 databases per instance, configurable IOPS, and flexible memory sizing. Customers can optimize resources for their workload requirements while continuing to benefit from the simplicity and compatibility of Azure SQL Managed Instance. With today's announcement, these capabilities can now be combined with zone-level resiliency, enabling customers to deploy highly available business-critical workloads on the latest General Purpose architecture without compromise. In addition, the flexible memory option for zone-redundant Next-Generation General Purpose instances is also available in public preview, providing even greater flexibility to balance performance requirements and infrastructure costs. Built-in high availability, now with Zone-level protection Azure SQL Managed Instance has always been designed for high availability. Next-Generation General Purpose delivers built-in high availability through its distributed architecture, leveraging Service Fabric together with fault domains and update domains to minimize the impact of hardware failures, software updates, and planned maintenance events. This architecture enables applications to remain available even during infrastructure events and maintenance operations. As a result, single-zone deployments provide a 99.99% availability SLA. For organizations with more demanding availability requirements, zone redundancy distributes service components across multiple Availability Zones within a region. This provides protection against zone-level failures and increases the availability SLA to 99.995%. While many workloads are well served by single-zone deployments, organizations in regulated industries and mission-critical environments often require zone-redundant architectures as part of compliance, operational resilience, or business continuity requirements. With today's preview, these customers can now adopt Next-Generation General Purpose without sacrificing those requirements. Regional availability Zone redundancy for Next-Generation General Purpose is available in public preview in all regions where the underlying ESAN infrastructure supports zone-redundant deployments. For the latest list of supported regions, check out the documentation page containing the regions where Elastic SAN is currently available and the supported redundancy options. Regions that do not yet support ESAN-based zone redundancy are not included in the preview at this time. Additional regions will become available as platform support expands. Upgrading existing deployments Whether you are already running Next-Generation General Purpose or remain on Classic General Purpose, adopting zone-redundant Next-Generation General Purpose is designed to be straightforward and transparent. Enable zone redundancy on existing Next-gen General Purpose instances Customers already running Next-Generation General Purpose can enable zone redundancy directly on existing instances and immediately benefit from enhanced resiliency and a higher availability SLA. Move from classic General Purpose zone-redundant to Next-generation General Purpose zone-redundant Customers currently running Classic General Purpose with zone redundancy can migrate to Next-Generation General Purpose while preserving zone-level resiliency and gaining access to the latest platform architecture, resource flexibility, and scalability improvements. This provides a natural modernization path for existing deployments and allows customers to standardize on the future architecture of the General Purpose tier. Online operation with a short failover Enabling zone redundancy or migrating between architectures is performed as an online management operation. During most of the operation, Azure SQL Managed Instance provisions and synchronizes the new infrastructure while the existing deployment continues serving application traffic. Near the end of the operation, a brief failover occurs as client connections are switched from the existing infrastructure to the newly provisioned environment. For more information about management operations, expected behavior, and application connectivity considerations, see management operations overview article. Protecting workloads beyond a single region For customers running in regions where zone redundancy is not currently available, or for customers seeking protection from broader regional outages, Failover Groups remain the recommended solution. Failover Groups enable disaster recovery across Azure regions by maintaining a secondary managed instance and providing automatic or manual failover capabilities when needed. This approach helps organizations meet business continuity objectives even when Availability Zone protection is unavailable or when protection from regional outages is required. Optimize disaster recovery costs with License Free failover rights Customers implementing disaster recovery through Failover Groups can further optimize costs through Azure SQL License Free failover rights. When the secondary managed instance is maintained exclusively for standby disaster recovery purposes and is not used for read-only workloads, SQL Server licensing costs do not apply to the secondary environment. Customers pay only for the compute resources required to maintain disaster recovery readiness, helping reduce overall total cost of ownership. Planning costs The Azure SQL Managed Instance pricing page and Azure Pricing Calculator have been updated to include the latest zone-redundant Next-Generation General Purpose offerings. These tools can help customers evaluate deployment options, compare availability architectures, and estimate costs associated with zone redundancy and disaster recovery configurations. Get started Zone redundancy for Next-Generation General Purpose marks the completion of an important milestone in the evolution of Azure SQL Managed Instance. Customers can now combine the performance, scalability, flexibility, and operational advantages of Next-Generation General Purpose with zone-level resiliency and a 99.995% availability SLA. Whether deploying new workloads, enabling zone redundancy on existing Next-Generation General Purpose instances, or modernizing Classic General Purpose deployments, organizations now have a clear path to adopting the latest General Purpose architecture without compromise. Learn more What is Azure SQL Managed Instance Availability through local and zone redundancy - Azure SQL Managed Instance Flexible memory - Azure SQL Managed Instance Next-gen General Purpose – official documentation Try Azure SQL Managed Instance for free Accelerate SQL Server Migration to Azure with Azure Arc Analyzing the Economic Benefits of Microsoft Azure SQL Managed Instance How 3 customers are driving change with migration to Azure SQL718Views1like0CommentsGenerally Available: Azure SQL Managed Instance Next-gen General Purpose
Overview Next-gen General Purpose is the evolution of General Purpose service tier that brings significantly improved performance and scalability to power up your existing Azure SQL Managed Instance fleet and helps you bring more mission-critical SQL workloads to Azure. We are happy to announce that Next-gen General Purpose is now Generally Available (GA) delivering even more scalability, flexibility, and value for organizations looking to modernize their data platform in a cost-effective way. The new #SQLMINextGen General Purpose tier delivers a built-in performance upgrade available to all customers at no extra cost. If you are an existing SQL MI General Purpose user, you get faster I/O, higher database density, and expanded storage - automatically. Summary Table: Key Improvements Capability Current GP Next-gen GP Improvement Average I/O Latency 5-10 ms 3-4 ms 2x lower Max Data IOPS 30-50k 80k 60% better Max Storage 16 TB 32 TB 2x better Max Databases/Instance 100 500 5x better Max vCores 80 128 40% better But that’s just the beginning. The new configuration sliders for additional IOPS and memory provide enhanced flexibility to tailor performance according to your requirements. Whether you require more resources for your application or seek to optimize resource utilization, you can adjust your instance settings to maximize efficiency and output. This release isn’t just about speed - It’s about giving you improved performance where it matters, and mechanisms to go further when you need them. Customer story - A recent customer case highlights how Hexure reduced processing time by up to 97.2% using Azure SQL Managed Instance on Next-gen General Purpose. What’s new in Next-gen General Purpose (Nov 2025)? 1. Improved baseline performance with the latest storage tech Azure SQL Managed Instance is built on Intel® Xeon® processors, ensuring a strong foundation for enterprise workloads. With the next-generation General Purpose tier, we’ve paired Intel’s proven compute power with advanced storage technology to deliver faster performance, greater scalability, and enhanced flexibility - helping you run more efficiently and adapt to growing business needs. The SQL Managed Instance General Purpose tier is designed with full separation of compute and storage layers. The Classic GP version uses premium page blobs for the storage layer, while the Next-generation GP tier has transitioned to Azure’s latest storage solution, Elastic SAN. Azure Elastic SAN is a cloud-native storage service that offers high performance and excellent scalability, making it a perfect fit for the storage layer of a data-intensive PaaS service like Azure SQL Managed Instance. Simplified Performance Management With ESAN as the storage layer, the performance quotas for the Next-gen General Purpose tier are no longer enforced for each database file. The entire performance quota for the instance is shared across all the database files, making performance management much easier (one fewer thing to worry about). This adjustment brings the General Purpose tier into alignment with the Business Critical service tier experience. 2. Resource flexibility and cost optimization The GA of Next-gen General Purpose comes together with the GA of a transformative memory slider, enabling up to 49 memory configurations per instance. This lets you right-size workloads for both performance and cost. Memory is billed only for the additional amount beyond the default allocation. Users can independently configure vCores, memory, and IOPS for optimal efficiency. To learn more about the new option for configuring additional memory, check the article: Unlocking More Power with Flexible Memory in Azure SQL Managed Instance. 3. Enhanced resource elasticity through decoupled compute and storage scaling operations With Next-gen GP, both storage and IOPS can be resized independently of the compute infrastructure, and these changes now typically finish within five minutes - a process known as an in-place upgrade. There are three distinct types of storage upgrade experiences depending on the kind of storage upgrade performed and whether failover occurs. In-place update: same storage (no data copy), same compute (no failover) Storage re-attach: Same storage (no data copy), changed compute (with failover) Data copy: Changed storage (data copy), changed compute (with failover) The following matrix describes user experience with management operations: Operation Data copying Failover Storage upgrade type IOPS scaling No No In-place Storage scaling* No* No In-place vCores scaling No Yes** Re-attach Memory scaling No Yes** Re-attach Maintenance Window change No Yes** Re-attach Hardware change No Yes** Re-attach Update policy change Yes Yes Data copy * If scale down is >5.5TB, seeding ** In case of update operations that do not require seeding and are not completed in place (examples are scaling vCores, scaling memory, changing hardware or maintenance window), failover duration of databases on the Next-gen General Purpose service tier scales with the number of databases, up to 10 minutes. While the instance becomes available after 2 minutes, some databases might be available after a delay. Failover duration is measured from the moment when the first database goes offline, until the moment when the last database comes online. Furthermore, resizing vCores and memory is now 50% faster following the introduction of the Faster scaling operations release. No matter if you have end-of-month peak periods, or there are ups and downs of usage during the weekdays and the weekend, with fast and reliable management operations, you can run multiple configurations over your instance and respond to peak usage periods in a cost-effective way. 4. Reserved instance (RI) pricing With Azure Reservations, you can commit to using Azure SQL resources for either one or three years, which lets you benefit from substantial discounts on compute costs. When purchasing a reservation, you'll need to choose the Azure region, deployment type, performance tier, and reservation term. Reservations are only available for products that have reached general availability (GA), and with this update, next-generation GP instances now qualify as well. What's even better is that classic and next-gen GP share the same SKU, just with different remote storage types. This means any reservations you've purchased automatically apply to Next-gen GP, whether you're upgrading an existing classic GP instance or creating a new one. What’s Next? The product group has received considerable positive feedback and welcomes continued input. The initial release will not include zonal redundancy; however, efforts are underway to address this limitation. Next-generation General Purpose (GP) represents the future of the service tier, and all existing classic GP instances will be upgraded accordingly. Once upgrade plans are finalized, we will provide timely communication regarding the announcement. Service update August 2026: Zone-redundancy for Next-gen General Purpose is now in preview. Conclusion Now in GA, Next-gen General Purpose sets a new standard for cloud database performance and flexibility. Whether you’re modernizing legacy applications, consolidating workloads, or building for the future, these enhancements put more power, scalability, and control in your hands - without breaking the bank. If you haven’t already, try out the Next-gen General Purpose capabilities for free with Azure SQL Managed Instance free offer. For users operating SQL Managed Instance on the General Purpose tier, it is recommended to consider upgrading existing instances to leverage the advantages of next-gen upgrade – for free. Welcome to #SQLMINextGen. Boosted by default. Tuned by you. Learn more What is Azure SQL Managed Instance Try Azure SQL Managed Instance for free Next-gen General Purpose – official documentation Analyzing the Economic Benefits of Microsoft Azure SQL Managed Instance How 3 customers are driving change with migration to Azure SQL Accelerate SQL Server Migration to Azure with Azure Arc6.5KViews5likes4Comments