azure monitor
1360 Topics
Action required: PromQL regex matching in Azure Monitor Workspace is becoming spec-compliant
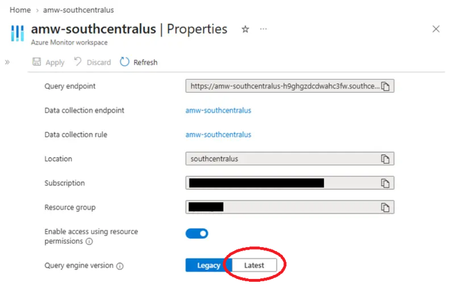
TL;DR: Bare regex matchers like pod=~"foo" will soon return only exact matches, not substring matches. If you rely on =~ for "starts with" or "contains" semantics, update your queries to add .* before the change lands. What is changing AMW's Prometheus Query Service is moving to fully-anchored regex matching, aligning with the upstream Prometheus specification. After the change, every =~ and !~ matcher is wrapped with ^…$ before evaluation. This matches the behavior of self-hosted Prometheus, Grafana Cloud Metrics, and Amazon Managed Prometheus. "Regex matches are fully anchored. A match of env=~"foo" is treated as env=~"^foo$"." Reference: Prometheus querying basics — Instant vector selectors Behavior delta Given these timeseries: kube_pod_container_status_ready{pod="grafana-otel-collector-97b6c55f4-abc12"} kube_pod_container_status_ready{pod="grafana-otel-collector-97b6c55f4-def34"} kube_pod_container_status_ready{pod="grafana-otel-collector-97b6c55f4"} Query: kube_pod_container_status_ready{pod=~"grafana-otel-collector-97b6c55f4"} Environment Effective regex Series returned AMW PQS — current grafana-otel-collector-97b6c55f4 (unanchored) 3 (all matching pods) AMW PQS — after change ^grafana-otel-collector-97b6c55f4$ 1 (exact name only) Self-hosted Prometheus, Grafana Cloud, AMP ^grafana-otel-collector-97b6c55f4$ 1 (exact name only) If your query depends on the first row, it will return fewer — often zero — series after the change. What to do Audit any query, alert rule, recording rule, or dashboard variable that uses =~ or !~. Map each to the table below. Intent Update to Exact match No change necessary; both label="value" and label=~"value" should return exact matches after updating query engine version for fully anchored regex support. Starts with label=~"value.*" Ends with label=~".*value" Contains label=~".*value.*" Set of prefixes label=~"(a\|b\|c).*" Recommendation: Where the intent is exact match, switch from =~ to = It is clearer to readers and skips per-series regex evaluation. When ready, update AMW configuration to use the latest Query engine version. This can be done via the Azure Portal UI, Azure CLI, or PowerShell. Configuring AMW to use the latest Prometheus query engine version Azure Portal In the Azure portal, open your Azure Monitor workspace. Under Settings, select Properties. Select the Latest segment of the Query engine version for the AMW. Azure CLI Run the following command to update to the latest (2.0) metrics query engine version for the AMW: Az monitor account metrics-container update --subscription <subscriptionId> -g <resourcegroupName> -w <azmonWorkspaceName> -n default --version 2.0 Azure PowerShell Run the following command to use the latest Query engine version for the AMW: $resourceId = “/subscriptions/<subscriptionId>/resourceGroups/<resourcegroupName>/providers/Microsoft.Monitor/accounts/<azureMonitorWorkspaceName>/metricsContainers/default” Az resource update --ids $resourceId --api-version 2025-10-03 --set properties.version=2.0 --force-string To confirm: Az resource show --ids $resourceId --api-version 2025-10-03 --query properties.version --output tsv Expected output: 2.0 Common pitfalls Alternation anchors the whole expression. pod=~"foo|bar" becomes ^(?:foo|bar)$, not ^foo|bar$. Add .* and parentheses for prefix sets. . matches any character, including -. pod=~"my-pod.*" will match my-pod-xyz, my-podxyz, and my-pod9xyz. Use character classes like [-] for tighter matches. Empty-label matching is unchanged. label=~"" still matches series without that label. Timeline Public Preview rollout: September 2026 In Public Preview, newly created AMWs will default to the latest metrics query version (“2.0”) which features fully anchored regex matching. AMWs created prior to September 2026 will continue using version (“1.0”) unless users take action to update. This provides users with the opportunity to verify their query intent and update accordingly prior to cutover to the latest AMW metrics query engine version. General Availability: March 2027 In General Availability, all AMWs regardless of creation date will be updated to version “2.0” for cross-workspace compatibility. Action window: Audit and update queries before the General Availability date.251Views0likes0Comments
Evoluindo a Resposta a Incidentes em AKS com Azure SRE Agent - Parte 1
Resumo executivo Em aplicações executadas no Azure Kubernetes Services (AKS), eventos OOMKilled estão entre as causas recorrentes de reinicialização de contêineres e indisponibilidade intermitente em aplicações web. A observabilidade fornecida por Azure Monitor, Container Insights, Log Analytics e métricas Prometheus permite detectar o sintoma, registrar o evento e disparar o alerta. A detecção isolada, porém, ainda deixa para a equipe de plantão o trabalho mais caro: correlacionar métricas, logs, eventos, alterações recentes e limites de recursos até chegar a uma hipótese defensável. Sobre essa base de observabilidade, o Azure SRE Agent adiciona uma camada de raciocínio e execução governada. Ao receber o incidente, ele coleta evidências nas fontes conectadas, valida hipóteses e produz um diagnóstico explicável. Em seguida, recomenda a ação de menor risco e, conforme o modo de execução configurado, solicita aprovação humana ou executa uma remediação pré-autorizada. O resultado é um fluxo mais rápido e rastreável, sem eliminar os controles de acesso e aprovação. Este whitepaper documenta o padrão em um laboratório reproduzível. No cenário, um pod em CrashLoopBackOff por limite de memória subdimensionado (20 Mi de limite, 10 Mi de solicitação) é investigado, diagnosticado e corrigido pelo agente sob aprovação humana, com verificação posterior e disparo automatizado por alerta do Azure Monitor. Além do passo a passo, o documento aprofunda a mecânica que sustenta o diagnóstico, cgroups v2, o OOM killer do kernel, classes de QoS, working set versus RSS e o comportamento de heap dos runtimes, porque a qualidade da resposta assistida depende diretamente da qualidade dos sinais que a alimentam. O que este documento entrega A anatomia técnica de um evento OOMKilled em AKS, do cgroup ao status do pod. Consultas KQL e PromQL prontas para detecção e para o desenho da regra de alerta. O modelo operacional do Azure SRE Agent: fontes de contexto, modos de execução, permissões, hooks e políticas de acesso a ferramentas. Um laboratório completo, do provisionamento do agente à recuperação verificada do workload. Um enquadramento de governança, auditoria e segurança para operações agênticas. O que este documento não cobre Disparo totalmente automatizado a partir do alerta e integração com o processo de gestão de incidentes, tema da Parte 2. Ajuste fino de capacidade em escala de frota (VPA/HPA em produção), tratado apenas como método. Valores de preço vigentes; o modelo de cobrança é descrito de forma qualitativa. 1. Introdução Aplicações nativas de nuvem distribuem o processamento entre pods, serviços, dependências e nós. Essa elasticidade melhora a escala, mas amplia a complexidade da investigação quando uma falha ocorre. Em um incidente de memória, o primeiro sinal pode ser um pod reiniciado, uma elevação de erros HTTP, aumento de latência ou degradação parcial de uma jornada específica. O problema raramente é a ausência de dados. É o custo cognitivo de atravessar métricas, logs, eventos do Kubernetes, histórico de implantação e manifestos sob pressão de tempo, para só então formular uma hipótese. Esse custo é pago integralmente a cada incidente, e não se acumula como conhecimento reutilizável. Este whitepaper apresenta um padrão de resposta a incidentes em que o Azure Monitor sustenta a detecção e a telemetria, enquanto o Azure SRE Agent converte sinais em contexto operacional acionável, preservando a decisão humana onde ela é necessária. 2. Contexto e desafio operacional O cenário considera uma aplicação web em AKS instrumentada com Container Insights, Log Analytics, métricas Prometheus e alertas do Azure Monitor. O desafio não é apenas saber que um contêiner foi encerrado, é determinar por que a memória ultrapassou o limite, qual versão e qual carga estavam envolvidas, qual foi o impacto ao usuário e qual ação reduz risco sem ocultar a causa raiz. Ou seja, transformar sinais distribuídos em uma decisão defensável sobre pressão de tempo. Telemetria distribuída entre métricas, logs, eventos e histórico de implantação. Pressão de tempo para restaurar o serviço antes da violação do SLO. Risco de reinicializações repetitivas que mascaram a ausência de correção estrutural. Necessidade de aprovação, rastreabilidade e segregação de funções em ambientes regulados. Há ainda um viés operacional relevante: sob pressão, o caminho mais curto, reiniciar o pod ou ampliar o limite de memória, quase sempre funciona no curto prazo. Isso torna difícil distinguir, retrospectivamente, um limite subdimensionado de um vazamento de memória lento, porque a evidência que separaria os dois é descartada junto com o contêiner encerrado. 3. Anatomia técnica do evento OOMKilled Antes de delegar a investigação a um agente, é necessário estabelecer com precisão o que o sinal significa. Boa parte dos diagnósticos incorretos de memória em Kubernetes nasce da confusão entre três mecanismos distintos: o OOM killer do kernel atuando no cgroup do contêiner, o despejo (eviction) decidido pelo kubelet por pressão no nó, e o encerramento por falha da aplicação. 3.1 O caminho do kernel: cgroups v2, memory.max e o OOM killer Quando um contêiner declara resources.limits.memory, o kubelet traduz esse valor para o controlador de memória do cgroup correspondente. Em nós AKS com imagens baseadas em Ubuntu 22.04 ou superior e Azure Linux 3.0, padrão em versões recentes do Kubernetes, o runtime opera sobre cgroup v2, e o limite é materializado no arquivo memory.max do cgroup do contêiner. A partir daí, o comportamento é do kernel Linux, não do Kubernetes. Quando as páginas anônimas do cgroup não podem mais ser recuperadas e a alocação ultrapassaria memory.max, o kernel invoca o OOM killer restrito àquele cgroup, escolhe um processo e envia SIGKILL. O contador correspondente é incrementado em memory.events, no campo oom_kill. # Dentro do nó, inspecionando o cgroup do contêiner (cgroup v2) cat /sys/fs/cgroup/.../memory.max # limite efetivo (bytes) cat /sys/fs/cgroup/.../memory.high # ponto de throttling por reclaim cat /sys/fs/cgroup/.../memory.current # uso corrente cat /sys/fs/cgroup/.../memory.events # low / high / max / oom / oom_kill Vale distinguir dois campos frequentemente confundidos em memory.events: max conta quantas vezes a alocação esbarrou no teto e forçou reclaim, enquanto oom_kill conta quantos processos foram efetivamente encerrados. Um valor alto em max com oom_kill igual a zero indica um contêiner operando permanentemente no limite: degradado, porém vivo. É exatamente o estado que antecede o incidente e que raramente dispara alerta. Como o processo recebe SIGKILL (sinal 9), o código de saída observado é 137, resultado da convenção POSIX 128 + número do sinal. O kubelet então registra o término e reinicia o contêiner conforme a restartPolicy. É por isso que a evidência canônica não está no status corrente do pod, mas no estado anterior do contêiner: kubectl get pod <pod> -n pets -o jsonpath='{.status.containerStatuses[0].lastState.terminated}' | jq # Saída esperada em um OOMKill: # { # "exitCode": 137, # "reason": "OOMKilled", # "startedAt": "...", # "finishedAt": "..." # } Reinícios sucessivos levam o pod a CrashLoopBackOff, em que o kubelet aplica um atraso exponencial entre tentativas, iniciando na ordem de dezenas de segundos e dobrando até um teto de poucos minutos, cujo valor padrão vem sendo revisado em versões recentes do Kubernetes. Esse atraso é o motivo pelo qual a indisponibilidade percebida cresce ao longo do incidente mesmo sem agravamento da causa raiz. 3.2 OOMKilled não é eviction: dois mecanismos, duas correções A distinção é operacionalmente decisiva porque as correções divergem: um OOMKill se resolve no manifesto do workload; um despejo se resolve na capacidade ou no agendamento do nó. Dimensão OOMKilled (cgroup) Eviction (kubelet) Gatilho Alocação excede memory.max do cgroup do contêiner memory.available do nó abaixo do limiar evictionHard/evictionSoft Quem decide Kernel Linux (OOM killer restrito ao cgroup) kubelet, ordenando os pods por QoS e excesso sobre requests Escopo Um contêiner O pod inteiro, podendo atingir vários pods do nó Sinal SIGKILL → exit code 137 Encerramento do pod; sem exit code 137 característico Evidência lastState.terminated.reason = OOMKilled status.phase = Failed, reason = Evicted Objeto do pod Preservado; contêiner reinicia no mesmo pod Pod permanece como registro de falha e é reagendado por seu controlador Correção típica Ajustar limits/requests ou o consumo da aplicação Capacidade do nó, requests coerentes, limiares de despejo, distribuição Nota. Um terceiro caso é frequentemente confundido com ambos: o encerramento do processo principal por erro da aplicação, que produz códigos de saída próprios (1, 2, 143 para SIGTERM). Verificar exitCode e reason antes de concluir por memória evita corrigir o sintoma errado. 3.3 Classes de QoS e a ordem em que os pods são sacrificados O Kubernetes deriva a classe de Quality of Service de cada pod a partir da relação entre requests e limits. Essa classe não é apenas rótulo: ela determina a prioridade de despejo e influencia diretamente o valor de oom_score_adj atribuído aos processos do contêiner. Classe de QoS Condição Prioridade de despejo Guaranteed requests iguais a limits para CPU e memória em todos os contêineres Última a ser despejada Burstable Pelo menos um request ou limit definido, sem igualdade entre eles Intermediária, proporcional ao excesso sobre o request BestEffort Nenhum request ou limit definido Primeira a ser despejada Para pods Burstable, o kubelet calcula oom_score_adj em função da fração da memória do nó reservada pelo request: quanto menor o request em relação à capacidade do nó, maior o score e mais atraente o processo se torna para o OOM killer. Pods Guaranteed recebem um valor fortemente negativo, e pods BestEffort recebem o valor máximo. Aplicação ao laboratório O order-service deste cenário declara requests de 10 Mi e limits de 20 Mi. A desigualdade entre os dois o classifica como Burstable, e o request muito baixo em relação à capacidade do nó eleva seu oom_score_adj. O workload é, portanto, simultaneamente o mais provável de estourar o próprio limite e um dos primeiros candidatos ao OOM killer sob pressão do nó, combinação que o torna um caso de teste representativo. Há uma consequência de projeto pouco explorada: elevar apenas o limit sem elevar o request melhora a sobrevivência ao OOMKill do cgroup, mas mantém o pod vulnerável em cenários de pressão do nó, porque o agendador continua reservando pouca memória para ele. Foi exatamente por isso que a recomendação do agente no laboratório ajustou os dois valores, e não apenas o limite. 3.4 Working set, RSS e por que o dashboard pode enganar A métrica que melhor aproxima a decisão do OOM killer é o working set, e não o RSS. Em cAdvisor, a fonte de container_memory_working_set_bytes e da métrica memoryWorkingSetBytes exposta pelo Container Insights, o working set corresponde ao uso total do cgroup menos o page cache inativo, isto é, a porção da memória que o kernel não conseguiria liberar trivialmente sob pressão. Métrica O que representa Uso recomendado container_memory_working_set_bytes Uso do cgroup menos page cache inativo Referência para alertas e para dimensionar limits container_memory_rss Páginas anônimas residentes do processo Investigação de vazamento no heap da aplicação container_memory_usage_bytes Uso total, incluindo page cache reclaimável Diagnóstico; superestima a pressão real container_memory_cache Page cache atribuído ao cgroup Explicar divergência entre usage e working set A armadilha prática: um painel construído sobre container_memory_usage_bytes pode indicar uso próximo ao limite sem risco real, porque boa parte é cache recuperável. Inversamente, um painel com média de 5 minutos pode mostrar 60% de uso e ainda assim o contêiner ser encerrado, porque o OOM killer reage a um pico instantâneo que a agregação suavizou. Alertas de memória devem usar working set e agregação por máximo, não por média. 3.5 Heap do runtime versus limite do contêiner Uma causa frequente de OOMKilled não está no limite em si, mas no desalinhamento entre o limite do cgroup e a política de heap do runtime. Runtimes que dimensionam o heap a partir da memória visível do host, e não do limite do cgroup, planejam crescer muito além do que o contêiner pode alocar, e o kernel encerra o processo antes que o coletor de lixo julgue necessário agir. Runtime Controle recomendado Observação Node.js --max-old-space-size (MB) Fixar abaixo do limite do contêiner; o order-service deste laboratório é Node.js JVM -XX:MaxRAMPercentage com UseContainerSupport Reservar espaço para metaspace, threads e buffers fora do heap .NET DOTNET_GCHeapHardLimitPercent; avaliar Server GC Server GC eleva o consumo por número de núcleos visíveis Go GOMEMLIMIT Limite flexível: intensifica a coleta em vez de abortar Python Limitar workers e pool de conexões Sem heap gerenciado; o consumo escala com concorrência Regra prática: o limite do contêiner deve acomodar o heap máximo do runtime somada a memória fora do heap, pilhas de threads, buffers de I/O, conexões, bibliotecas nativas e o próprio page cache anônimo. Dimensionar o heap igual ao limite do contêiner é uma causa clássica de OOMKilled sob carga. 3.6 Causas frequentes Limite subdimensionado: o consumo legítimo da carga excede o valor configurado, como ocorre neste laboratório. Vazamento de memória: o processo retém memória de forma progressiva entre requisições. Pico de tráfego ou payload atípico: a demanda transitória ultrapassa a capacidade provisionada. Concorrência excessiva: workers, filas ou caches locais ampliam o working set de forma não linear. Requests e limits incoerentes: o agendamento e a contenção não refletem o perfil real de consumo. Heap do runtime maior que o limite do cgroup: o processo planeja crescer além do permitido. Valores herdados de um dimensionamento anterior que nunca foi revisado após mudanças de código ou de carga. 4. Impactos para aplicações web em AKS Dimensão Impacto potencial Usuário Erros HTTP 5xx, timeouts, perda de sessão e latência elevada. Aplicação Interrupção de requisições em andamento, reprocessamento e perda de cache local. Plataforma CrashLoopBackOff, aumento de restarts e pressão sobre outros pods ou nós. Negócio Violação de SLO, risco à receita e degradação da experiência digital. Operações Escalonamento de plantão, investigação manual e aumento do MTTR. Um agravante específico do OOMKilled é o efeito em cascata: ao reiniciar, o contêiner reconstrói caches e refaz conexões, produzindo um pico de consumo de memória e CPU justamente no momento em que a capacidade agregada do serviço está reduzida. Isso pode encadear novos encerramentos em réplicas ainda saudáveis e transformar uma falha localizada em degradação do serviço. 5. Detecção: sinais, consultas e desenho do alerta A qualidade da investigação assistida depende da qualidade dos sinais disponíveis. Esta seção consolida as consultas usadas para detectar OOMKilled em AKS e o desenho da regra de alerta empregada no laboratório. 5.1 Sinais canônicos # Estado atual e contagem de reinícios kubectl get pods -n pets -o wide # Razão do término anterior, a evidência decisiva kubectl get pods -n pets -o custom-columns=\ NAME:.metadata.name,\ STATUS:.status.phase,\ RESTARTS:.status.containerStatuses[0].restartCount,\ REASON:.status.containerStatuses[0].lastState.terminated.reason,\ EXIT:.status.containerStatuses[0].lastState.terminated.exitCode # Limites efetivamente aplicados ao contêiner kubectl get deployment order-service -n pets \ -o jsonpath='{.spec.template.spec.containers[0].resources}' # Eventos correlatos na janela do incidente kubectl get events -n pets --sort-by=.lastTimestamp 5.2 Consultas KQL no Log Analytics Com Container Insights habilitado, o inventário de pods carrega o estado anterior de cada contêiner em formato JSON, o que permite isolar terminações por OOMKilled diretamente na consulta: // Contêineres encerrados por OOMKilled nas últimas 6 horas KubePodInventory | where TimeGenerated > ago(6h) | where isnotempty(ContainerLastStatus) | extend LastStatus = parse_json(ContainerLastStatus) | where tostring(LastStatus.reason) == "OOMKilled" | project TimeGenerated, ClusterName, Namespace, Name, ContainerName = ContainerName, ExitCode = toint(LastStatus.exitCode), RestartCount = ContainerRestartCount, FinishedAt = todatetime(LastStatus.finishedAt) | summarize Ocorrencias = count(), Ultima = max(FinishedAt), MaxRestarts = max(RestartCount) by ClusterName, Namespace, ContainerName | order by Ocorrencias desc Os eventos do Kubernetes oferecem uma segunda camada de confirmação, útil quando o intervalo de coleta do inventário perde uma terminação de curta duração: // Eventos de OOM e falhas de inicialização correlatas KubeEvents | where TimeGenerated > ago(6h) | where Reason in ("OOMKilling", "OOMKilled", "BackOff", "Failed") | project TimeGenerated, ClusterName, Namespace, Name, Reason, Message | order by TimeGenerated desc Para separar limite subdimensionado de vazamento, a consulta relevante é a tendência do working set contra o limite declarado. Um platô estável junto ao teto sugere subdimensionamento; uma inclinação positiva sustentada entre reinícios sugere retenção progressiva: // Working set máximo por contêiner, em janelas de 5 minutos Perf | where TimeGenerated > ago(24h) | where ObjectName == "K8SContainer" | where CounterName == "memoryWorkingSetBytes" | summarize MaxWorkingSetMi = max(CounterValue) / 1024 / 1024 by bin(TimeGenerated, 5m), InstanceName | render timechart 5.3 Equivalentes em PromQL Em clusters com Azure Monitor managed service for Prometheus, os mesmos sinais ficam disponíveis como séries temporais, o que facilita alertas baseados em razão de utilização: # Razão entre working set e limite declarado, por pod max by (namespace, pod, container) ( container_memory_working_set_bytes{namespace="pets", container!=""} ) / max by (namespace, pod, container) ( kube_pod_container_resource_limits{namespace="pets", resource="memory"} ) # Contêineres cuja última terminação foi OOMKilled kube_pod_container_status_last_terminated_reason{reason="OOMKilled"} == 1 # Taxa de reinícios na última hora increase(kube_pod_container_status_restarts_total{namespace="pets"}[1h]) > 0 Nota. Um alerta preventivo sobre a razão working set / limite acima de 0,85 por vários minutos antecipa o incidente antes do primeiro OOMKill, transformando uma interrupção em uma tarefa de dimensionamento planejada. Essa é a regra que mais reduz incidentes desta classe. 5.4 Desenho da regra de alerta utilizada no laboratório A regra empregada no cenário é uma Log Alert V2 sobre o workspace do Log Analytics, avaliando a consulta de OOMKilled e disparando quando a contagem de resultados é maior que zero. Parâmetro Valor no laboratório Consideração de produção Tipo Log search alert (Log Alerts V2) Consultas sobre logs; considerar alerta de métrica para latência menor Escopo Workspace do Log Analytics do cluster Escopo por cluster ou por assinatura, conforme o modelo de plantão Lógica Contagem de resultados maior que 0 Aumentar o limiar para tolerar reinícios isolados e evitar ruído Severidade 1, Error Alinhar à criticidade do serviço e à política de plantão Frequência / janela Avaliação periódica sobre janela curta Janela igual ou maior que a frequência, para não perder eventos Ação Action group com notificação por e-mail Encaminhar também a ITSM/PagerDuty e ao gatilho do agente Auto-resolução Padrão da regra Habilitar para incidentes transitórios; desabilitar se exigir baixa manual Latência esperada de ponta a ponta No laboratório, o pod entrou em OOMKilled às 17h45 e a notificação chegou às 17h47. Esses dois minutos somam ingestão no Log Analytics, período de avaliação da regra e entrega pelo action group. Alertas baseados em log carregam essa latência por construção, um dado relevante ao definir SLOs de detecção e ao decidir entre alerta de log e alerta de métrica. 6. O processo tradicional e seus limites 6.1 Fluxo típico de resposta O Azure Monitor dispara o alerta e notifica o plantão. O plantonista abre o portal, os dashboards e o Log Analytics. Executa comandos kubectl para localizar o pod e confirmar a razão do término. Compara consumo, limite, reinícios, eventos e alterações recentes. Formula uma hipótese, reinicia ou reimplanta o workload e acompanha a recuperação. Registra evidências e ações no sistema ITSM. 6.2 Limitações do modelo reativo Esse fluxo depende da experiência individual, exige alternância constante entre ferramentas e produz decisões inconsistentes entre plantonistas. Um restart reduz o sintoma, mas não distingue vazamento de memória, limite inadequado ou pico legítimo de carga. Sob pressão, cresce também o risco de ampliar recursos sem validação, perder evidências ao encerrar o contêiner afetado ou executar ações privilegiadas fora do processo de mudança. O custo mais alto, porém, é invisível: o conhecimento produzido durante a investigação permanece no indivíduo e não fica disponível para o próximo incidente da mesma classe. 7. Azure SRE Agent: arquitetura e modelo operacional O Azure SRE Agent é um agente de confiabilidade que conecta fontes de observabilidade, plataformas de incidente, repositórios de código e conhecimento operacional. Ele investiga causas prováveis, propõe mitigações e automatiza respostas orientadas por planos e runbooks, dentro de guardrails e fluxos de aprovação. Princípio de arquitetura O Azure Monitor permanece como fonte de detecção e evidência. O SRE Agent atua como camada de investigação, decisão e orquestração governada. O agente não substitui a observabilidade: ele consome e correlaciona o que ela produz. 7.1 Fontes de contexto A qualidade do diagnóstico é função direta das fontes conectadas. Durante a configuração, o agente solicita explicitamente a associação de quatro categorias de contexto. Fonte O que habilita Uso no cenário OOMKilled Recursos do Azure Consultar e operar recursos por meio da identidade do agente Ler o estado do cluster AKS e aplicar a mitigação aprovada Logs Consultar workspaces do Log Analytics Correlacionar eventos, inventário de pods e métricas de working set Código Acessar repositórios e artefatos de engenharia Relacionar o limite aplicado ao manifesto de origem Incidentes Integrar Azure Monitor, ServiceNow e PagerDuty Receber o alerta e vincular a investigação ao incidente 7.2 Execução por ferramentas e classificação de risco O agente não age por um canal opaco, cada passo é uma chamada de ferramenta explícita, um comando da CLI do Azure, uma consulta KQL, um comando kubectl, apresentada na thread com o comando exato e uma classificação de risco associada. No laboratório, comandos de leitura como az aks show aparecem marcados como Safe, enquanto operações como kubectl get deployments e kubectl patch recebem a marcação Medium risk. Essa transparência tem duas consequências práticas. A primeira é auditoria: a thread registra a sequência exata de comandos, permitindo reconstruir a investigação. A segunda é revisão: o operador avalia o comando concreto, não uma descrição em linguagem natural do que o agente pretende fazer. 7.3 Modos de execução (Run Modes) Os modos de execução controlam o fluxo de aprovação, isto é, se o agente pergunta antes de agir. É importante separar esse conceito das permissões, que controlam o acesso ao recurso. O agente precisa das duas condições satisfeitas para executar uma ação. Modo Comportamento Indicação Review O agente propõe a ação e aguarda Approve ou Deny Produção, infraestrutura crítica, alertas de segurança Autonomous O agente executa imediatamente e relata o que fez Ambientes de não produção e tarefas recorrentes confiáveis Três detalhes que mudam o desenho de governança Primeiro: o modo de execução é definido por plano de resposta e por tarefa agendada, não no nível do agente; a configuração do agente serve apenas como padrão de fallback. Segundo: os botões Approve e Deny aparecem para operações de infraestrutura do Azure; outras ações, como enviar e-mail, publicar no Teams ou consultar fontes externas, seguem a instrução do plano de resposta e exigem hooks ou políticas de acesso a ferramentas para receber controle equivalente. Terceiro: apenas administradores do SRE Agent podem aprovar ações, o que materializa a segregação de funções. Uma observação de adoção relevante: os planos de resposta e as tarefas agendadas assumem Autonomous como padrão, enquanto o agente é criado em Review. Assumir que criar o agente em Review protege automaticamente todos os fluxos é um erro de configuração fácil de cometer e caro de descobrir. 7.4 Permissões, escopo e elevação sob demanda O agente opera por meio de uma identidade gerenciada, e o que ele consegue fazer é delimitado pelas atribuições RBAC dessa identidade e pelo escopo em que foram concedidas. Quando o agente não possui a permissão necessária para uma operação, ele solicita acesso temporário por meio do fluxo On-Behalf-Of do Microsoft Entra, em vez de falhar silenciosamente. Esse comportamento é arquiteturalmente importante: ele permite conceder à identidade do agente um conjunto mínimo e permanente de permissões de leitura, deixando as operações de escrita dependentes de uma elevação explícita e rastreável. É o oposto do padrão adotado no laboratório, que concede permissões amplas por conveniência de demonstração. 7.5 Hooks e políticas de acesso a ferramentas Hooks são pontos de verificação personalizados que validam, auditam ou bloqueiam o comportamento do agente em momentos específicos do fluxo. Eles complementam os modos de execução: enquanto os modos controlam quando o agente pode agir, os hooks controlam o que acontece antes e depois de cada ação. Evento Quando dispara Aplicações típicas PostToolUse Após a execução de uma ferramenta Auditar o uso, bloquear ou sinalizar operações inseguras, injetar contexto adicional no resultado Stop Quando o agente vai devolver a resposta final Validar completude, exigir formato, rejeitar a resposta e forçar continuidade da investigação Tipos de execução: Prompt, avaliado pelo modelo para verificações que exigem julgamento; e Command, script determinístico para auditoria e aplicação de política. Escopos de configuração: no nível do agente, aplicando-se a todas as threads; ou no nível de um agente personalizado. Quando ambos correspondem, os dois executam. Políticas de acesso a ferramentas complementam os hooks ao restringir previamente quais ferramentas podem ser invocadas em cada contexto. 7.6 Provedor de modelo e residência de dados O provedor de modelo é escolhido na criação do agente e pode ser alterado depois, sem recriar o recurso. Há duas famílias disponíveis, com perfis distintos: modelos do Azure OpenAI e modelos Anthropic Claude. Para organizações reguladas, essa escolha ultrapassa o critério de qualidade de raciocínio e entra no domínio de conformidade: os provedores diferem quanto à cobertura de requisitos de residência de dados, incluindo o EU Data Boundary, e a disponibilidade varia por região. A recomendação é validar os requisitos de residência e a lista de regiões suportadas na documentação vigente antes de padronizar o provedor para cargas de produção. 7.7 Modelo de consumo O consumo do agente é medido em Azure Agent Units e combina dois componentes: um fluxo contínuo, associado à existência do agente e ao monitoramento de base, e um fluxo ativo, proporcional aos tokens processados durante investigações. Modelos com janelas de contexto maiores tendem a consumir mais no fluxo ativo. A implicação de FinOps é direta: o custo escala com o volume de investigações e com a profundidade do contexto conectado, não com o número de recursos monitorados. Reduzir alertas ruidosos diminui o custo do agente pelo mesmo mecanismo que reduz a fadiga do plantão. Consulte a página de preços para os valores vigentes. 8. Processo de resposta com o SRE Agent Receber e classificar: consumir o incidente do Azure Monitor e aplicar filtros por severidade, serviço e título. Coletar evidências: consultar Log Analytics, métricas, eventos do Kubernetes, estado do pod, histórico de implantação e runbooks. Formar hipóteses: comparar limite versus uso, tendência temporal, payload, versão implantada e eventos correlatos. Validar: sustentar cada hipótese com evidência observável e registrar as alternativas descartadas. Recomendar: apresentar ação imediata, correção estrutural, risco associado e critérios de rollback. Agir sob governança: executar apenas ações pré-autorizadas ou aguardar aprovação, conforme o modo de execução do plano. Verificar e aprender: confirmar a estabilidade, documentar o resultado e enriquecer a memória operacional. A etapa 4 é a que mais diferencia uma investigação assistida de uma sugestão genérica. Um diagnóstico útil não afirma apenas qual é a causa provável: registra qual evidência sustenta a conclusão, qual hipótese foi descartada e por quê. É esse registro que permite ao operador revisar a decisão em segundos, em vez de refazer a investigação. 9. Cenário do incidente 9.1 Situação O serviço order-service, no namespace pets, processa requisições de uma aplicação web de comércio eletrônico. Após aumento de tráfego e uso de payloads maiores, as réplicas passam a reiniciar. O Azure Monitor detecta a elevação na contagem de reinicializações e a ocorrência de eventos OOMKilled. 9.2 Linha de investigação # Evidência buscada Interpretação 1 reason igual a OOMKilled e exitCode 137 em lastState Encerramento pelo kernel por ultrapassagem do limite do cgroup, não falha da aplicação. 2 Working set atingindo o limite declarado Distinguir limite inadequado de crescimento anômalo entre requisições. 3 Pico correlacionado a tráfego ou tamanho de payload Avaliar comportamento legítimo versus retenção progressiva de memória. 4 Implantação recente do workload Determinar se houve regressão em código ou em configuração de recursos. 5 Contagem de restarts e erros HTTP Quantificar impacto ao usuário e urgência da mitigação. 6 Classe de QoS e relação requests/limits Avaliar exposição adicional a despejo por pressão no nó. 9.3 Formato do diagnóstico assistido O agente entrega um resumo com causa provável, grau de confiança, evidências que a sustentam, alternativas descartadas e plano de mitigação com critério de reversão. A estrutura importa tanto quanto o conteúdo: ela permite que a revisão humana seja auditoria, e não repetição do trabalho. O contêiner atingiu repetidamente o limite de memória durante o processamento de payloads acima do padrão histórico. Não há evidência suficiente de crescimento contínuo entre requisições; a hipótese principal é limite subdimensionado para a nova carga. Mitigação proposta: elevar limits e requests de memória, com verificação do consumo após a alteração. 10. Implementação e validação do cenário no AKS A seguir, o padrão conceitual é aplicado a um ambiente AKS de demonstração. O objetivo é conectar o cluster ao SRE Agent, conceder as permissões necessárias, integrar as fontes de observabilidade e validar o fluxo de diagnóstico e recuperação de um pod afetado por OOMKilled. Preparar o ambiente: validar o cluster AKS, a aplicação de demonstração e o estado inicial do workload. Criar o SRE Agent: provisionar o agente e selecionar o provedor de modelo conforme os requisitos do ambiente. Conectar as fontes de dados: integrar o cluster, o Azure Monitor e o Log Analytics para disponibilizar alertas, logs e métricas. Conceder permissões: atribuir à identidade gerenciada do agente o acesso necessário para investigar e, no laboratório, executar a remediação aprovada. Validar diagnóstico e recuperação: provocar o evento OOMKilled, acompanhar a investigação, aprovar a recomendação e confirmar a recuperação do pod. Escopo do laboratório As permissões concedidas nesta seção são deliberadamente amplas para reduzir o atrito da demonstração. Elas não representam uma configuração recomendada para produção. A seção 10.5 apresenta o desenho de menor privilégio equivalente, e a seção 12 detalha as implicações de segurança. 10.1 Ambiente e pré-requisitos A aplicação utilizada é o AKS Store Demo, exemplo de referência da Microsoft que representa uma loja de comércio eletrônico decomposta em microsserviços poliglotas. A tabela a seguir consolida a configuração do ambiente, para permitir a reprodução do cenário. Componente Configuração no laboratório Cluster AKS-SRE-Demo-Cluster, SKU Base, tier Free, 1 node pool Versão do Kubernetes 1.35.6 Região East US 2 Rede Azure CNI Overlay Observabilidade Container Insights habilitado, enviando logs e métricas ao Log Analytics Aplicação AKS Store Demo, namespace pets, exposta por Service do tipo LoadBalancer Workload em falha order-service (Node.js), requests 10 Mi / limits 20 Mi de memória Alerta Alert-OOMKilled-Pods, Log Alerts V2, severidade 1, Error Agente Azure SRE Agent provisionado no grupo de recursos Azure-SRE-RG A arquitetura da aplicação é relevante para o diagnóstico: o order-service recebe pedidos do store-front e os publica em uma fila RabbitMQ, consumida pelo makeline-service. Um serviço que faz buffer de mensagens antes de publicar é estruturalmente sensível ao tamanho do payload e à concorrência, precisamente o perfil que torna um limite de 20 Mi insustentável sob carga. 10.2 Arquitetura e estado inicial da aplicação Figura 1: Arquitetura do AKS Store Demo. O store-front e o store-admin consomem o order-service (Node.js), o product-service (Rust), o makeline-service (Go) e o ai-service (Python), com RabbitMQ como broker de mensagens e MongoDB como armazenamento de estado. Figura 2: Página inicial da aplicação de demonstração, publicada por meio de um Service do tipo LoadBalancer. O endereço IP público foi suprimido. Figura 3: Visão geral do cluster AKS antes da investigação: Kubernetes 1.35.6, região East US 2, configuração de rede Azure CNI Overlay e um único node pool. Identificadores de assinatura e o endereço do servidor de API foram suprimidos. A inspeção do namespace revela o estado que servirá de referência para todo o exercício. O pod do order-service encontra-se em CrashLoopBackOff, acumulando reinicializações sucessivas, o sintoma de superfície de um encerramento repetido pelo kernel. Figura 4: Saída de kubectl get all -n pets. O pod do order-service aparece em CrashLoopBackOff com reinicializações acumuladas, enquanto os demais serviços do namespace permanecem íntegros. Endereços IP públicos foram suprimidos. Nota. Observe que apenas um serviço está afetado. Essa assimetria já elimina hipóteses de escopo mais amplo, pressão de memória no nó, falha do runtime de contêiner ou problema de rede, e concentra a investigação na configuração ou no comportamento daquele workload específico. 10.3 Criação do agente e escolha do provedor de modelo O agente é provisionado no portal do SRE Agent, em sre.azure.com. Figura 5: Portal do Azure SRE Agent. A criação inicia pela opção Create Agent. No formulário, define-se o grupo de recursos, o nome do agente e o provedor de modelo. É possível escolher entre Azure OpenAI, com a família GPT-5, e Anthropic, com a família Claude, e alterar essa opção posteriormente sem recriar o recurso. Conforme discutido na seção 7.6, essa escolha deve considerar também os requisitos de residência de dados da organização. Figura 6: Formulário de criação do agente, com a seleção do grupo de recursos, do nome e do provedor de modelo. Figura 7: Revisão da configuração antes da confirmação. Nomes de assinatura foram suprimidos. Figura 8: Provisionamento do agente em andamento. Figura 9: Agente criado. A opção Set up your agent conduz à configuração das fontes de contexto. 10.4 Conexão das fontes de contexto O objetivo do agente é investigar as aplicações em execução no cluster AKS. Para isso, conecta-se primeiro o recurso do cluster. Figura 10: Associação do recurso do cluster AKS ao agente. Figura 11: Seleção do grupo de recursos onde o cluster AKS está provisionado. Figura 12: Confirmação do escopo selecionado. Nomes de assinatura foram suprimidos. Neste laboratório, o agente receberá permissões ampliadas para executar tarefas específicas no cluster. Essa configuração é restrita ao ambiente de demonstração. Em produção, recomenda-se aplicar o princípio do menor privilégio, limitar o escopo das funções, exigir aprovação para ações de maior impacto e validar previamente operações autorizadas, como alterar um pod ou recuperar um nó com estado desconhecido. Figura 13: Definição do nível de permissão concedido ao agente sobre os recursos conectados. Em seguida, integra-se o agente ao Azure Monitor, para que ele acesse os alertas configurados e inicie uma investigação quando o incidente correspondente for emitido. Figura 14: Integração com o Azure Monitor, habilitando o consumo de alertas como gatilho de investigação. Além do Azure Monitor, o agente pode ser integrado ao ServiceNow e ao PagerDuty para apoiar fluxos de investigação e gestão de incidentes, permitindo que a thread da investigação seja correlacionada ao registro formal do incidente. Figura 15: Integrações disponíveis com plataformas de gestão de incidentes. O cluster tem o Container Insights habilitado e envia logs e métricas ao workspace do Log Analytics. Conectar esse workspace é o que permite ao agente executar as consultas KQL apresentadas na seção 5 durante a investigação. Figura 16: Início da conexão com o Log Analytics. Figura 17: Seleção do workspace do Log Analytics associado ao cluster. Figura 18: Preenchimento dos dados do workspace. Identificadores de assinatura foram suprimidos. Figura 19: Conclusão da conexão com o Log Analytics. Figura 20: Painel de configuração das fontes de contexto, consolidando código, logs, recursos do Azure e incidentes. A amplitude do contexto conectado determina diretamente a profundidade possível do diagnóstico. 10.5 Identidade gerenciada e atribuições RBAC Neste ponto o agente já é funcional para investigação. Para que ele também possa executar a remediação no cluster, atribuem-se funções à sua identidade gerenciada. O primeiro passo é identificar essa identidade. Figura 21: Identidade gerenciada associada ao agente. Os identificadores de cliente, de principal e de assinatura foram suprimidos. No laboratório, foram atribuídas as funções Azure Kubernetes Service Cluster Admin Role e Azure Kubernetes Service Contributor Role, com escopo no grupo de recursos do cluster. az role assignment create ` --assignee "<uami-client-id>" ` --role "Azure Kubernetes Service Cluster Admin Role" ` --scope "/subscriptions/<subscription-id>/resourceGroups/Azure-SRE-RG" az role assignment create ` --assignee "<uami-client-id>" ` --role "Azure Kubernetes Service Contributor Role" ` --scope "/subscriptions/<subscription-id>/resourceGroups/Azure-SRE-RG" Figura 22: Resultado da atribuição da função Azure Kubernetes Service Cluster Admin Role. Identificadores de assinatura, de principal e da atribuição foram suprimidos. Figura 23: Resultado da atribuição da função Azure Kubernetes Service Contributor Role. A confirmação é feita no painel Access control (IAM) do cluster, localizando as atribuições concedidas à identidade gerenciada do agente. Figura 24: Painel de controle de acesso do cluster, confirmando as duas atribuições à identidade gerenciada do agente (destacadas). Identificadores de objeto e nomes de entidades de serviço do locatário foram suprimidos. Por que essa configuração não deve ir para produção A função Azure Kubernetes Service Cluster Admin Role autoriza a obtenção da credencial administrativa do cluster. Essa credencial é um certificado de cliente que opera fora da integração com o Microsoft Entra ID e da autorização RBAC do Kubernetes, ou seja, contorna exatamente os controles de identidade que a organização configurou no cluster. Some-se a isso a função Contributor no grupo de recursos, e a identidade do agente passa a acumular controle administrativo do plano de dados e amplo poder no plano de controle. O desenho equivalente sob menor privilégio troca esse par de funções por um conjunto mínimo, com escopo no cluster e não no grupo de recursos, apoiando-se no fluxo de elevação sob demanda descrito na seção 7.4 para as operações de escrita eventuais. Necessidade Função recomendada Escopo Obter kubeconfig respeitando o Entra ID Azure Kubernetes Service Cluster User Role Cluster Leitura no plano de dados do Kubernetes Azure Kubernetes Service RBAC Reader Cluster ou namespace Escrita controlada no plano de dados Azure Kubernetes Service RBAC Writer Namespace do workload Consultar métricas e logs Monitoring Reader Workspace do Log Analytics Operações de infraestrutura do cluster Elevação sob demanda via fluxo On-Behalf-Of Por operação, com registro Nota. As funções RBAC do Kubernetes (Reader, Writer, Admin) exigem que a autorização RBAC do Azure para Kubernetes esteja habilitada no cluster. Escopar por namespace, e não pelo cluster inteiro, reduz o raio de impacto de uma ação incorreta ao conjunto de workloads sob responsabilidade daquele agente. 10.6 Investigação assistida A primeira interação é deliberadamente simples: uma pergunta aberta sobre a saúde do cluster, sem indicar o problema. O objetivo é avaliar se o agente chega ao workload afetado por conta própria. Figura 25: Estado do pod do order-service imediatamente antes da investigação, usado como linha de base para validar diagnóstico e recuperação. Figura 26: O agente inicia a investigação executando comandos de inspeção. Cada chamada de ferramenta exibe o comando exato e a classificação de risco associada: Safe para az aks show e Medium risk para kubectl get deployments. Identificadores de assinatura foram suprimidos. A Figura 26 concentra o que diferencia esse modelo de uma automação convencional. O agente não executa um runbook fixo: ele escolhe o próximo comando a partir do resultado do anterior, e cada escolha fica registrada com o comando literal e sua classificação de risco. O operador acompanha a cadeia de raciocínio como uma sequência auditável de operações, não como uma caixa-preta que devolve uma conclusão. Figura 27: O agente identifica o pod do order-service em CrashLoopBackOff, com 13 reinicializações acumuladas. A partir do estado do pod, o agente correlaciona a razão do término com os limites declarados no manifesto e conclui que o limite de 20 Mi é insuficiente para a carga observada. A recomendação é elevar o limite para 128 Mi e a solicitação para 64 Mi, acompanhando o consumo após a alteração. Figura 28: Diagnóstico do agente: OOMKilled associado ao limite de 20 Mi e à solicitação de 10 Mi, com recomendação de elevação para 128 Mi e 64 Mi respectivamente. Figura 29: Continuação do diagnóstico, com o detalhamento das evidências e das alternativas consideradas. Leitura crítica da recomendação A recomendação ajusta requests e limits em conjunto, e não apenas o limite, o que, conforme a seção 3.3, preserva a classe Burstable com uma reserva de memória compatível e reduz a exposição a despejo por pressão no nó. O agente também sinaliza que valores maiores, como 256 Mi, só devem ser adotados após análise de métricas, testes de carga e investigação de possível vazamento. Essa ressalva é o que separa uma mitigação de uma correção: o número proposto restabelece o serviço, mas ainda não é um dimensionamento validado. 10.7 Mitigação aprovada e verificação A recomendação é apresentada como uma ação concreta a ser aprovada. O comando exibido é exatamente o que será executado: kubectl patch deployment order-service -n pets --type='json' -p='[ {"op":"replace", "path":"/spec/template/spec/containers/0/resources/limits/memory", "value":"128Mi"}, {"op":"replace", "path":"/spec/template/spec/containers/0/resources/requests/memory", "value":"64Mi"} ]' O efeito é alterar os recursos de memória do deployment order-service no namespace pets: o limite passa de 20 Mi para 128 Mi e a solicitação, de 10 Mi para 64 Mi. Como a alteração atinge o template do pod, o controlador executa um rollout, substituindo as réplicas existentes. Figura 30: Proposta de alteração apresentada para revisão. A ação é classificada como Medium risk e apresenta os controles Approve action e Cancel, com a indicação de que as permissões do agente serão utilizadas para concluí-la. Aprovada a ação, o agente a executa e passa espontaneamente à verificação, consultando o estado do novo pod em vez de declarar sucesso pela ausência de erro no comando. Figura 31: Após aplicar o patch, o agente consulta o estado do novo pod e aguarda a conclusão do startup probe antes de concluir. Esse detalhe merece destaque: o agente distingue a execução bem-sucedida de um comando da recuperação efetiva do serviço, e aguarda a passagem pelo startup probe antes de afirmar que o problema foi resolvido. É a mesma disciplina que se espera de um operador experiente. Figura 32: Comparação entre o estado anterior e o posterior apresentada pelo agente, acompanhada da ressalva sobre reconciliação com a fonte da verdade quando o deployment é gerenciado por GitOps, Helm ou pipeline de IaC. Dimensão Antes Depois Estado do pod CrashLoopBackOff, 13 reinicializações Running, Ready, 0 reinicializações Memória (request/limit) 10 Mi / 20 Mi 64 Mi / 128 Mi Classe de QoS Burstable, com reserva mínima Burstable, com reserva compatível Figura 33: Validação manual por kubectl: todos os objetos do namespace pets em execução, com o order-service estável e sem reinicializações. 10.8 Reconciliação com a fonte da verdade Um ponto levantado pelo próprio agente na Figura 32 merece tratamento explícito, porque é onde a maioria das remediações assistidas falha silenciosamente: a alteração foi aplicada diretamente ao objeto no cluster. Se o deployment for gerenciado por GitOps, Helm ou qualquer pipeline de infraestrutura como código, a fonte da verdade continua declarando 20 Mi. A próxima reconciliação do controlador, ou a próxima implantação, reverterá a correção e reintroduzirá o incidente, agora sem a memória do diagnóstico que o originou. O sintoma reaparece dias depois, aparentemente sem causa. Modelo de gestão Efeito do kubectl patch Ação obrigatória de fechamento Manifesto aplicado manualmente Persiste até a próxima aplicação Atualizar o manifesto no repositório Helm Revertido no próximo upgrade Atualizar o values.yaml e versionar o chart GitOps (Flux/Argo CD) Revertido na próxima reconciliação Abrir pull request na fonte da verdade Pipeline de IaC Revertido na próxima execução Atualizar o template e o registro de mudança Regra operacional Toda mitigação aplicada diretamente ao cluster deve gerar um item de acompanhamento na fonte da verdade antes do encerramento do incidente. Um incidente cuja correção existe apenas no cluster não está resolvido: está agendado para reincidir. 10.9 Do acionamento sob demanda ao disparo por alerta Até aqui, o agente foi acionado sob demanda. A etapa seguinte valida o caminho automatizado: um alerta do Azure Monitor configurado para disparar quando um pod apresentar terminação por OOMKilled. Figura 34: Regra de alerta configurada no Azure Monitor para detectar terminações por OOMKilled no cluster. Para provocar o evento de forma controlada, utiliza-se uma aplicação local que gera carga sobre o order-service até que o consumo ultrapasse o limite do cgroup. Figura 35: Painel local de simulação, com o gatilho de geração de carga sobre o order-service e o acompanhamento de pods íntegros, terminações por OOMKilled e alertas disparados. Às 17h45, o pod entra em estado OOMKilled com código de saída 137. Figura 36: Confirmação do estado por kubectl, evidenciando a terminação por OOMKilled. Dois minutos após o evento, a notificação do alerta chega ao destinatário configurado no action group, intervalo que corresponde à soma da ingestão no Log Analytics, do período de avaliação da regra e da entrega da notificação. Figura 37: Notificação recebida por e-mail às 17h47, referente à regra Alert-OOMKilled-Pods. Figura 38: Detalhe da notificação, indicando a condição atendida: contagem de resultados maior que zero, com o valor alcançado igual a 1. O disparo é então confirmado no portal do Azure, com a severidade e o tipo de sinal registrados. Figura 39: Alerta registrado no portal do Azure com estado Fired. Figura 40: Detalhes do alerta: severidade 1, Error, tipo de sinal Log Alerts V2 e horário de disparo consistente com o evento observado no cluster. Com esse alerta emitido e o agente integrado ao Azure Monitor, o gatilho necessário para a automação completa está validado. A Parte 2 tratará da transição do acionamento assistido para o fluxo disparado automaticamente pelo alerta, incluindo planos de resposta, modos de execução por plano e a integração com o processo de gestão de incidentes. 10.10 Do restabelecimento ao dimensionamento correto O laboratório encerra com o serviço estável, mas os valores aplicados são uma mitigação informada, não um dimensionamento validado. Fechar o ciclo exige um método, e esse método é independente do agente. Estabelecer a linha de base: medir o working set em percentil 95 e 99 sobre uma janela que cubra o ciclo completo de carga do serviço, incluindo picos previsíveis. Definir o request pelo consumo típico: o percentil 95 do working set em regime normal, valor que o agendador usará para reservar capacidade. Definir o limit com folga sobre o pico: o percentil 99 acrescido de margem para transientes, tipicamente entre 25% e 50%, evitando folga excessiva que desperdiça capacidade do nó. Alinhar o runtime: ajustar o heap máximo conforme a seção 3.5, reservando espaço para memória fora do heap. Validar sob carga: reproduzir o cenário que originou o incidente e confirmar que o working set permanece abaixo do limite com margem estável. Descartar vazamento: comparar a inclinação do consumo entre reinícios; crescimento sustentado sem correlação com a carga indica retenção progressiva, que nenhum aumento de limite resolve. Automatizar a revisão: usar o Vertical Pod Autoscaler em modo recomendação para acompanhar a adequação dos valores ao longo do tempo, sem aplicação automática. Nota. Elevar o limite de memória é uma resposta legítima quando a evidência aponta subdimensionamento, e ilegítima quando serve para adiar a investigação de um vazamento. A diferença entre as duas situações está na inclinação do consumo entre reinícios, um dado que só existe se a telemetria for retida além do ciclo de vida do contêiner. 11. Governança, aprovação e rastreabilidade Esta seção separa deliberadamente dois planos: capacidades do produto, que podem ser verificadas na documentação, e recomendações de arquitetura, que cada organização deve validar e adaptar às próprias políticas. Nota. Nomenclaturas, opções e comportamentos evoluem. Antes de aplicar este padrão em produção, valide a documentação vigente, os controles disponíveis no ambiente e os requisitos internos de segurança, auditoria e mudança. 11.1 O que foi observado no laboratório O agente coletou métricas, eventos e o estado dos pods para investigar o incidente, com cada comando registrado na thread. Identificou que os valores de memória estavam subdimensionados para a carga observada. Propôs um comando kubectl patch explícito, exibindo a alteração de 20 Mi para 128 Mi no limite e de 10 Mi para 64 Mi na solicitação. Apresentou a ação para revisão humana, classificada como Medium risk, e aguardou aprovação antes de executar. Após a aprovação, executou a alteração e verificou a recuperação do pod antes de concluir. Sinalizou espontaneamente o risco de reversão da correção em cenários gerenciados por GitOps ou Helm. Esse comportamento reflete o cenário demonstrado e não estabelece regra universal para todas as ferramentas, comandos ou ambientes. 11.2 Referência de governança para a organização A tabela a seguir é uma recomendação de desenho, não uma matriz fixa nem garantia de comportamento do produto. Categoria Exemplos Política sugerida Leitura get, list, show, describe, consultas KQL Permitir quando escopo e RBAC forem compatíveis com a investigação. Escrita patch, update, scale, restart Exigir revisão humana em ambientes críticos por meio de Review Mode no plano de resposta ou de hooks. Alto impacto delete, redução de capacidade, mudanças destrutivas Restringir por RBAC e por política de acesso a ferramentas; submeter a processo formal de mudança ou negar conforme o risco. A classificação de risco deve ser definida pela organização conforme o ambiente, o tipo de recurso, a criticidade do serviço e os requisitos regulatórios. A documentação do produto não deve ser interpretada como regra universal de que toda leitura é sempre permitida, toda escrita sempre exige aprovação ou todo delete é sempre negado. 11.3 Camadas de evidência para auditoria Nenhuma fonte isolada reconstrói o incidente por completo. A rastreabilidade útil vem da correlação entre camadas com escopos distintos. Camada O que registra Limitação Thread do agente Comandos executados, evidências, proposta e aprovação Escopo da conversa; confirmar retenção e exportação no ambiente Telemetria de auditoria do agente Atividade do agente para acompanhamento e conformidade Confirmar granularidade e campos disponíveis no ambiente Log de auditoria do Kubernetes Chamadas ao servidor de API do cluster Requer habilitação e destino de coleta configurados Azure Activity Log Operações do plano de controle do Azure Não cobre alterações internas do Kubernetes Sistema de ITSM Registro formal de incidente e mudança Depende da integração e da disciplina de preenchimento Recomenda-se correlacionar, conforme disponibilidade: horário da proposta e da execução; a ação ou comando apresentado ao operador; o estado anterior e posterior do recurso; o resultado da ferramenta e mensagens de erro relevantes; os identificadores do agente, recurso, alerta, incidente e mudança; e as informações de aprovação expostas pelos mecanismos disponíveis. 11.4 Fluxo recomendado para este cenário Etapa Aplicação no laboratório Controle recomendado 1. Diagnóstico e proposta O agente consulta métricas, eventos e estado do cluster e apresenta a ação recomendada. RBAC de menor privilégio, escopo por namespace e evidências observáveis. 2. Revisão humana Em Review Mode, o operador analisa o comando, o impacto e o escopo antes da execução. Critérios de aprovação e rollback definidos; aprovação restrita a administradores do agente. 3. Execução controlada Após a aprovação, o agente executa a alteração dentro das permissões concedidas. Identidade gerenciada, escopo mínimo, hooks de PostToolUse para auditoria. 4. Verificação O agente valida a recuperação antes de concluir. Critério de sucesso objetivo, baseado em estado observado e não em ausência de erro. 5. Reconciliação Não aplicável ao laboratório; a alteração permaneceu no cluster. Atualizar a fonte da verdade e vincular ao registro de mudança. 6. Registro O resultado é apresentado na thread do agente. Correlação entre telemetria, logs do cluster, registros do Azure e ITSM. Enquadramento Os modos de execução, os controles de acesso, os hooks e a telemetria são capacidades do produto. A matriz de risco, as evidências exigidas, as convenções de repositório e as integrações de auditoria são decisões de governança da organização. Manter essa separação explícita evita transformar recomendações de arquitetura em garantias de produto. 12. Considerações de segurança para operações agênticas Introduzir um agente com capacidade de execução no caminho de resposta a incidentes altera o modelo de ameaças da plataforma. As considerações a seguir derivam diretamente da configuração demonstrada. Consideração Risco Mitigação Privilégio excessivo Cluster Admin Role concede credencial que contorna o Entra ID e o RBAC do Kubernetes Substituir por Cluster User + RBAC Reader/Writer com escopo por namespace; elevar sob demanda Escopo amplo demais Funções no grupo de recursos alcançam recursos não relacionados ao incidente Escopar no recurso, não no grupo de recursos Segregação de funções Quem opera aprova a própria ação Restringir aprovação a administradores do agente distintos de quem aciona a investigação Conteúdo não confiável no contexto Logs e eventos podem carregar texto capaz de influenciar o raciocínio do agente Hooks de PostToolUse e políticas de acesso a ferramentas; revisão humana para ações de escrita Raio de impacto Uma ação incorreta atinge o cluster inteiro Escopo por namespace, janelas de mudança e critérios de rollback definidos previamente Residência de dados O provedor de modelo determina onde o contexto é processado Selecionar o provedor conforme os requisitos regulatórios e as regiões suportadas Exposição em capturas e threads Identificadores e segredos aparecem em evidências compartilhadas Revisar artefatos antes de circular; suprimir identificadores, como feito neste documento O item sobre conteúdo não confiável merece atenção particular. Durante a investigação, o agente lê logs e eventos produzidos pela aplicação, dados que, em última instância, podem ser influenciados por entradas de usuários. Tratar esse conteúdo como dado, e não como instrução, é responsabilidade compartilhada entre o produto e o desenho de governança: manter operações de escrita sob revisão humana em ambientes críticos é a defesa mais direta contra essa classe de risco. Princípio de composição Nenhum controle isolado é suficiente. A defesa em profundidade nesse modelo compõe quatro camadas independentes: RBAC delimita o que a identidade alcança; os modos de execução determinam se há aprovação humana; a classificação de risco por chamada de ferramenta informa a decisão do revisor; e os hooks aplicam política e auditoria antes e depois de cada ação. Remover qualquer uma delas transfere risco às demais. 13. Métricas para avaliar a adoção A adoção de resposta assistida deve ser avaliada por evidência, não por percepção. As métricas a seguir permitem comparar o antes e o depois de forma objetiva. Métrica O que mede Sinal de maturidade MTTD Tempo entre o evento e a detecção Estável; limitado pela latência de ingestão e avaliação MTTA Tempo entre o alerta e o início da investigação Redução acentuada com investigação automática MTTR Tempo entre o alerta e a recuperação verificada Redução sustentada, sem aumento de reincidência Taxa de aprovação sem alteração Recomendações aprovadas sem ajuste pelo operador Crescente; habilita migração seletiva para modo autônomo Taxa de reincidência em 30 dias Incidentes da mesma classe que retornam Decrescente; indica correção estrutural e não apenas mitigação Aderência à reconciliação Mitigações refletidas na fonte da verdade Próxima de 100%; principal defesa contra reincidência Ações autônomas por classe de risco Distribuição entre leitura, escrita e alto impacto Crescimento apenas nas classes com histórico consistente A recomendação de adoção é conservadora e apoiada na própria documentação do produto: iniciar em Review Mode, observar as recomendações por algumas semanas e migrar para modo autônomo apenas os gatilhos cujo padrão de aprovação já se mostrou consistente. A taxa de aprovação sem alteração é o indicador que sustenta essa decisão com dados. 14. Limitações e armadilhas observadas A mitigação foi aplicada diretamente ao cluster. Em ambientes gerenciados por GitOps, Helm ou IaC, a correção será revertida se a fonte da verdade não for atualizada. Os valores de 128 Mi e 64 Mi restabeleceram o serviço, mas constituem mitigação informada, não dimensionamento validado por testes de carga. As permissões concedidas no laboratório são amplas por conveniência de demonstração e contornam a integração com o Entra ID no plano de dados do cluster. Alertas baseados em log carregam latência de ingestão e de avaliação, dois minutos no laboratório, o que os torna inadequados para SLOs de detecção mais agressivos. Um restart bem-sucedido mascara a distinção entre limite subdimensionado e vazamento de memória; sem telemetria retida além do ciclo do contêiner, a diferença se perde. O modelo pode propor valores plausíveis, mas a validação por métricas e carga permanece responsabilidade da engenharia. O cenário cobre uma única classe de falha em um único workload; a generalização para outras classes exige validação própria. 15. Conclusão da Parte 1 O Azure Monitor e o Azure SRE Agent transformaram um evento OOMKilled em um fluxo governado de detecção, investigação, recomendação, aprovação e recuperação verificada. O resultado demonstra valor não apenas por restabelecer o pod, mas por correlacionar evidências, manter a decisão explicável e executar a remediação dentro dos limites de acesso definidos. Três observações se destacam do exercício. A primeira é que a transparência por chamada de ferramenta, com o comando literal e sua classificação de risco, transforma a revisão humana em auditoria rápida em vez de repetição do trabalho. A segunda é que o agente verificou a recuperação antes de concluir, distinguindo execução bem-sucedida de serviço restabelecido. A terceira é que ele sinalizou o risco de reversão por GitOps, armadilha que mais frequentemente converte uma correção em incidente recorrente. A conclusão arquitetural permanece: a observabilidade continua sendo a base. O agente amplifica o valor de uma telemetria bem construída, e amplifica igualmente as lacunas de uma telemetria pobre. Investir em sinais corretos, como working set em vez de uso bruto, agregação por máximo em vez de média e retenção além do ciclo de vida do contêiner, é pré-requisito, não consequência. Na Parte 2, o fluxo evoluirá do acionamento assistido para o disparo automatizado por alertas, com planos de resposta, definição de modos de execução por plano, hooks de auditoria e integração com o processo de gestão de incidentes. 16. Referências Azure SRE Agent Documentação do Azure SRE Agent Run Modes in Azure SRE Agent Agent Hooks in Azure SRE Agent Tutorial: Configure Agent Hooks Model Provider Selection in Azure SRE Agent Execute Mitigations in Azure SRE Agent Set up ServiceNow incident indexing Azure SRE Agent: preços Azure Monitor e observabilidade de contêineres Azure Monitor overview Overview of Azure Monitor alerts Container insights overview Consultas de exemplo para KubePodInventory Azure Monitor managed service for Prometheus Kubernetes e AKS Configure Quality of Service for Pods Node-pressure Eviction Resource Management for Pods and Containers Access and identity options for AKS AKS Store Demo: code sample362Views4likes1CommentGoverning Log Analytics retention at scale
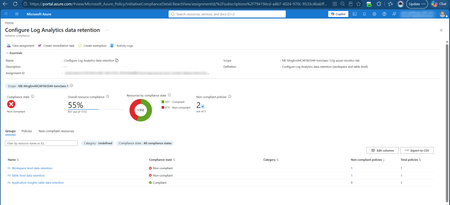
A Log Analytics workspace stores its data in tables, and data retention can be configured at two levels: Workspace level: a default interactive (Analytics) retention that applies to the whole workspace (30–730 days). Table level: each table has its own Analytics retention and its own total retention (Analytics + long-term/archive). By default a table's Analytics retention is set to "Workspace default", i.e. it inherits the workspace value. Two ideas are worth keeping in mind: Analytics vs. long-term (archive) retention. Analytics retention is the "hot", fully queryable period. Beyond that, data can be kept in cheaper long-term retention for compliance, and restored or searched when needed. See Manage data retention in a Log Analytics workspace. Tables can be configured individually: instead of configuring retention on the highest level, the workspace, this can also be done at a table level. The cost optimization opportunity Here's a concrete, very common scenario. A customer needs to retain data for 2 years. The typical reaction: set the workspace retention to 730 days. The catch: because every table's Analytics retention defaults to "Workspace default", this quietly sets the interactive (Analytics) retention of all tables to two years. Analytics retention is the expensive tier; so in many cases this drives up storage cost significantly, for data that nobody queries interactively after the first few weeks. A more cost-effective pattern is usually: Keep the workspace default retention low (for example 30 or 90 days - depending whether Sentinel and/or Application Insights are enabled). Set each table's Analytics retention to what it actually needs interactively (often 30–90 days). Use long-term (non-interactive) retention at the table level where you genuinely need to keep data longer (e.g. 2 years) for compliance, at a fraction of the Analytics cost. With a maximum of 12 years of retention. The result is the same "keep data for 2 years" outcome, but only the data you actually query interactively sits in the expensive tier. The governance opportunity Configuring this once in the portal is straightforward. The real win is making it consistent, scalable, and self-maintaining - and that's very achievable with the right approach: A single workspace can expose hundreds to well over a thousand tables, so a repeatable, automated method pays off quickly. With a central definition of your target retention model, you can apply it uniformly across many workspaces and subscriptions. Add drift detection and you'll always know when a table's retention changes - and can bring it back automatically. In other words, retention governance is a great candidate for policy-driven automation. To make it easy, I built a reusable solution and open-sourced it. The solution: law-retention-guardrails Repository: claestom/law-retention-guardrails The solution is Azure Policy, end to end. Two custom policy definitions, grouped into one initiative, both using the DeployIfNotExists effect: Definition Target What it sets Workspace retention Microsoft.OperationalInsights/workspaces the workspace default analytics retention Table retention Microsoft.OperationalInsights/workspaces/tables per-table analytics and total retention Because it's DeployIfNotExists, the policy does both jobs at once: Audit: Azure Policy → Compliance shows every workspace and table whose retention drifts from your target, fleet-wide. Remediate: new and updated resources are configured automatically, and a remediation task brings existing workspaces and tables into compliance. The assignment's managed identity (granted Log Analytics Contributor) performs the change. Keeping the free 90 days: Sentinel & Application Insights One nuance worth calling out. Enabling Microsoft Sentinel on a workspace, or using workspace-based Application Insights, grants 90 days of interactive (analytics) retention for free. A blanket 30-day target would throw that away. Application Insights is handled for you. The initiative ships a dedicated third policy that targets exactly the 11 workspace-based App Insights tables (AppRequests, AppDependencies, AppExceptions, AppTraces, ...). The general table policy excludes those same tables, so the two never overlap: a single assignment governs everything, with App Insights keeping its own values (appInsightsRetentionInDays / appInsightsTotalRetentionInDays, defaulting to 90 / 90) while the rest of your tables sit at the baseline. No second assignment, no wildcard juggling. Sentinel is a scope split. Sentinel's free 90 days apply at the workspace level, which the table exclusions don't cover. Since Sentinel usually lives in a dedicated workspace or resource group, assign 90-day values there and carve that scope out of the baseline with -NotScopes. Keep any such extra assignments mutually exclusive, two DeployIfNotExists assignments that both match the same resource will fight over it. How to deploy You need rights to create policy and role assignments at the target scope (e.g. Owner). Pick one of two paths. Option A: One click The repo ships a Deploy to Azure button backed by a subscription-scoped ARM template. It creates the three definitions, the initiative, the assignment (with a managed identity), and the Log Analytics Contributor role assignment — then you fill in the retention values in the portal form. You can optionally scope the assignment to a single resource group right in the form. Option B: The deploy script git clone https://github.com/claestom/law-retention-guardrails.git cd law-retention-guardrails ./deploy.ps1 -SubscriptionId <sub-id> ` -WorkspaceRetentionInDays 30 ` -TableRetentionInDays 30 ` -TableTotalRetentionInDays 730 ` -AppInsightsRetentionInDays 90 ` -AppInsightsTotalRetentionInDays 90 That single command creates the definitions and initiative, assigns it with a system-assigned managed identity, grants the identity Log Analytics Contributor, and starts a remediation task to fix existing resources. Scope it as narrowly or broadly as you like: # A management group ./deploy.ps1 -ManagementGroupId <mgId> # A single resource group ./deploy.ps1 -SubscriptionId <sub> -ResourceGroupName rg-monitoring # A single Log Analytics workspace ./deploy.ps1 -SubscriptionId <sub> ` -Scope /subscriptions/<sub>/resourceGroups/<rg>/providers/Microsoft.OperationalInsights/workspaces/<workspace> Prefer the portal? Paste each definition's azurepolicy.portal.json into Policy → Definitions → + Policy definition, then assign at the scope you want with a managed identity and a remediation task. A note on valid retention values Azure accepts these total retention values: 4–730 days, and beyond two years only full years: 1095, 1460, 1826, 2191, 2556, 2922, 3288, 3653, 4018, 4383. The solution validates this up front so you get a clear message instead of per-table errors. (Note: Basic/Auxiliary plan tables have a fixed analytics retention and will always report non-compliant - exempt them or treat as noise.) Wrapping up Configuring retention per table, keeping the workspace default low, trimming interactive retention, and pushing long-lived data into cheaper long-term retention, can meaningfully reduce Azure Monitor cost while still meeting compliance requirements. With law-retention-guardrails, that model is enforceable and auditable across your whole environment using nothing but Azure Policy: it tells you where you stand and fixes drift, with no Automation Account to run. I'd love your feedback and contributions on the repository. Resources Manage data retention in a Log Analytics workspace | Microsoft Learn Log Analytics workspace overview | Microsoft Learn Azure Policy documentation | Microsoft Learn Remediate non-compliant resources with Azure Policy | Microsoft Learn Azure Policy DeployIfNotExists effect | Microsoft Learn claestom/law-retention-guardrails (GitHub) Thank you!555Views2likes0CommentsShare Azure Monitor Logs to Microsoft Fabric (preview)
Azure Monitor Logs sharing to Microsoft Fabric is now in public preview. In just a few steps, you can share the logs you already send to a Log Analytics workspace with OneLake in Delta Parquet—the open format—without duplication, at no additional cost. This opens your observability data to all analytics, data science, and business intelligence tools available in Fabric. Today, observability, operational, and business data often live in separate silos. While Microsoft Fabric already provides a unified foundation in OneLake for business and operational data, observability data is frequently disconnected—hard to reach with the broader tools of your data estate, and disconnected from the business context needed to act. Sharing Azure Monitor data to Microsoft Fabric closes these gaps. Let's see how: Open format: your logs as Delta Parquet in OneLake In just a few steps, you can share every log you send to a Log Analytics workspace—across all tiers, including Analytics, Basic, and Auxiliary—to OneLake as Delta Parquet. Once setup completed, telemetry is available in Fabric without duplication, at no additional cost, and with near real-time availability. Because Delta Parquet is an open standard, you can read the same data with any engine that understands it—no proprietary export, no copy to maintain. Bring the full breadth of Fabric analytics to your telemetry With your logs in OneLake, you can apply the full range of Fabric analytics to your telemetry. Examples of what you can do: Build Power BI reports over long-term telemetry for trend analysis and reporting. Run Spark for large-scale processing, machine learning, and analysis across long ranges of historical telemetry. Query and correlate telemetry alongside operational and business data in one place—we'll explore this further in the next section. Going further: cross-domain intelligence The biggest shift comes when observability data is combined with business context and acted on in near real time. By bringing Azure Monitor telemetry together with business data such as ERP and CRM, organizations can reason and act across domains as events happen: Signals are evaluated with full business context, not as isolated alerts—so you can see who and what is affected, and how much it's costing. Signals turn into operational and business action—triggering the right response to mitigate the business impact of incidents before it grows. . Scenario in action: airport check-in disruption At Zava Airport, self-check-in kiosks stream telemetry into Azure Monitor. Following a deployment issue, customers are unable to complete self check-in. The Fabric Operations Agent detects the problem, enriches it with business context from ERP and CRM systems, and helps Vic, the operations manager, quickly understand that high-value loyalty customers are affected and that operational costs are rising. Based on this context, Vic approves the Operations Agent’s recommendations to open a dedicated counter to reduce customer impact and to escalate the issue to IT for faster resolution, given the high business impact. Instead of reacting after the fact, she makes decisions in the moment, based on full business context. Learn how organizations can move from operational signals to business action: So how is this powered in Fabric? Behind the scenes: how it's built in Fabric This experience runs on a simple, unified setup in Fabric: Azure Monitor data in OneLake — Telemetry from the Log Analytics workspace is brought in through a Mirrored Azure Monitor item, without duplication. Cross-domain data ready in Eventhouse — Telemetry and business data such as ERP and CRM are made available in one place, ready for real-time analysis and action. Real-time analytics and action — A Real-Time Dashboard and the Operations Agent run on this combined data, triggering automated actions across systems. Together, this creates a continuous flow from data to insight to action on a single data foundation. Learn how this solution is built in Microsoft Fabric: Key takeaways Multiple data domains, unified in OneLake — In a few steps, you can share your Azure Monitor Logs, across all tiers, to OneLake as open Delta Parquet, without duplication and at no additional cost. Full Fabric analytics — Power BI, Spark, and machine learning apply directly to your telemetry, alongside your business data. Real-time cross-domain intelligence — Observability and business data are reasoned about together in seconds, not passed sequentially between teams. Drive action, not just reports — The system detects, decides, and triggers actions based on all available context. Looking ahead... Fabric IQ and Ontology will further enrich the experience by helping organizations model business entities and relationships across domains, enabling even deeper understanding of business context. Next steps Explore how Azure Monitor data and business data come together in Microsoft Fabric to enable cross-domain intelligence, analytics, and action. We'd love to hear how this experience works for you. Drop us a comment or reach out to azmon-in-fabric@microsoft.com. Your input directly shapes what comes next.635Views2likes0CommentsJune 2026 Recap: Azure Database for PostgreSQL
POSETTE 2026 We hosted POSETTE: An Event for Postgres 2026 in June! This year marked our 5th annual event featuring 50 speakers and a total of 44 talks. PostgreSQL developers, contributors, and community members came together to share insights on topics covering everything from AI-powered applications to deep dives into PostgreSQL internals. If you missed it, you can catch up by watching the POSETTE livestream sessions. If this conference sounds interesting to you and want to be part of it next year, don’t forget to subscribe to POSETTE news. Features 💡 Chaos Studio Workspaces for Azure Database for PostgreSQL Flexible Server – Public Preview Chaos Studio Workspaces now support Azure Database for PostgreSQL Flexible Server in Public Preview. You point a Workspace at a subscription or resource group, and Chaos Studio discovers your Flexible Server instances and recommends a PostgreSQL zone-down failover Scenario. The Scenario requires a Flexible Server with High Availability enabled. Running the Scenario simulates an availability-zone outage, drives an HA failover, and produces a Scenario report of exactly what happened. Read more here: https://aka.ms/ChaosStudioPostgreSQL Try it today: https://aka.ms/chaos-portal Microsoft Defender Security Assessment for Azure Database for PostgreSQL - General Availability Microsoft Defender security posture assessments for Azure Database for PostgreSQL Flexible Server are now generally available. Built-in assessments continuously evaluate PostgreSQL configurations against PostgreSQL-specific security best practices, helping identify vulnerabilities and misconfigurations with actionable remediation guidance. Customers can use these assessments to strengthen their security baseline, prioritize remediation efforts, and support compliance requirements. Assessments are automatically available for servers already protected by Microsoft Defender for Cloud Security Posture Management (CSPM), with no additional setup required. An initial set of assessments is available today, with additional coverage planned for future releases to help strengthen the security posture of PostgreSQL workloads. Read more here: Microsoft Defender for Cloud - Azure Database for PostgreSQL | Microsoft Learn DROP CAST Support added Custom casts can be useful when applications need to convert between data types in a way that matches their business logic or migration requirements. Previously, while you could create custom casts, it wasn’t possible to drop them once they were no longer needed. With this update, you can now use the PostgreSQL DROP CAST command to clean up unused or obsolete casts, making it easier to manage schema customizations over time. Example: CREATE CAST (bigint AS text) WITH INOUT; … DROP CAST IF EXISTS (bigint AS text); Latest PostgreSQL minor versions: 18.4, 17.10, 16.14, 15.18, 14.23 Azure Database for PostgreSQL now supports the latest PostgreSQL minor versions: 18.4, 17.10, 16.14, 15.18, and 14.23. These updates are applied automatically during planned maintenance windows, helping keep your databases current with the latest PostgreSQL community fixes and reliability improvements, with no manual action required. This release includes fixes across query correctness, planner behavior, replication, backup and restore tooling, logical replication, foreign data wrapper behavior, and timezone data, improving overall stability and correctness of database operations. For details about the minor release, see the PostgreSQL announcement. Azure PostgreSQL Learning Bytes 🎓 Generate a pgBadger report from Server Logs Need a quick workload readout from PostgreSQL logs? Use pgBadger with Azure PostgreSQL Server Logs. Fast path: Server logs → Download '.log' files → Generate pgBadger report Before collecting logs, set log_line_prefix in Server parameters: %m user=%u db=%d pid=%p: Then enable Server logs > Capture logs for download, download the .log files for the time window you want to analyze, place them in a local folder, and run: FOLDER=<logs-folder-name> pgbadger -f stderr \ --prefix '%m user=%u db=%d pid=%p:' \ ./$FOLDER/*.log \ -o ./$FOLDER/pgbadger-report.html Open the generated report: start ./$FOLDER/pgbadger-report.html This gives you a quick HTML report for query activity, connection patterns, events, lock waits, and workload spikes - without setting up a storage account, BlobFuse mount, or JSON extraction pipeline. 💡Tip: Start with one or two hourly log files first. Confirm the report looks right, then expand the log analysis window. Learn more: Log Insights in Minutes: A Simpler pgBadger Workflow275Views1like0CommentsUnderstanding billing for the Azure Copilot Observability Agent
The Azure Copilot Observability Agent brings an agentic investigation experience directly into Azure Monitor. Teams can chat with their observability data, run deep investigations across application and infrastructure signals, and, in preview, use autonomous operations to correlate alerts and create issues for review. The common thread across these experiences is that the agent performs AI work on behalf of the user or configured workflow, and that work has a cost. Azure Copilot Observability Agent billing went into effect July 1, 2026. This post explains the billing model at a practical level: what is measured, which agent operations are billable today, how usage appears to users, and how this differs from the standard Azure Monitor costs customers already manage for telemetry ingestion, retention, alerting, and other monitoring capabilities. For current list pricing and the most detailed billing guidance, always refer to the official billing documentation and the Azure Monitor pricing page. A consumption-based model for agentic work The Observability Agent uses a consumption-based pricing model: customers pay for the AI work the agent performs. This consumption is measured in Azure Agent Credits, or AAC. AAC provides a consistent unit for agent work across models and tokens used. AAC is designed to reflect the amount of agentic processing required to complete a task. Simple questions, such as "what was the maximum latency of this app yesterday?", typically use few tokens. A deep investigation consumes more agent and tool work, and therefore typically incurs higher cost. Note that a single agent operation - be it a chat question or a deep investigation - is currently capped at 500 AACs. Charges are scoped to the Azure subscription of the monitored resource, or to the subscription of the named agent instance if one is used (required for autonomous operations). This keeps the cost associated with the environment where the agent is being used, and lets teams review agent consumption alongside other subscription-level Azure costs. What is billable today There are three main usage patterns to understand. Chat - the agent's chat allows users to explore and analyze their observability data through natural-language questions about their Azure resources and their logs, metrics, traces, or related telemetry, and the agent performs the work needed to answer. This is typically the lowest-cost pattern because the scope is often focused and iterative. Deep investigation - can be initiated through a number of entry points in the Azure Portal, and also through the chat (users can tell the agent to run a deep investigation). A deep investigation performs a broader analysis - it gathers signals, correlates findings, reasons across application, infrastructure, and Azure platform context, and produces an investigation report. Because this workflow runs multiple agent and tool steps, it typically consumes more AAC than chat. Autonomous operations are currently in preview. Autonomous alert processing, triage and optional correlation can run in the background to group related alerts and reduce noise. Alert correlation itself isn’t billed during preview. If autonomous operations automatically run a deep investigation on an agent-created issue, that deep investigation is billable. This is an important distinction: preview correlation and issue creation are different from the investigation work that may be triggered as part of that flow. How users see usage in the product Cost transparency is part of the experience. After the agent returns a response in chat, users can open the usage indicator (hexagon-shaped icon) located next to the thumbs-up/down icons, to see how many AACs were used to generate that response. This makes consumption visible at the point where the user sees the value of the answer, rather than only later in a billing report. This is especially useful because not all agent interactions are equal. A short question that summarizes a recent trend can require much less agent work than a long-running investigation that reviews multiple signals and hypotheses. Showing AAC usage per response helps users understand that relationship and adjust how they use the agent when needed. How costs appear in Azure Cost Management Teams can review the overall agent cost in subscription Cost Management. The product name appears as Azure Monitor Observability Agent, and the meter name appears as Observability Agent Azure Agent Credits. This gives admins a familiar place to monitor consumption. The agent cost is not a replacement for standard Azure Monitor charges. Existing Azure Monitor costs — such as logs ingestion, retention, alerting, web tests, and other metered monitoring capabilities — continue to follow their own billing models. Through Cost Analysis smart views, such as Services, users can select the Azure Monitor service and review specific entries of the Azure Monitor Observability Agent. Practical guidance for teams Start by using chat for focused exploration: ask about trends, errors, performance, anomalies, or a specific resource. Use deep investigations when you need a broader, multi-signal analysis of an incident or suspected root cause. Review the AAC usage shown after agent responses so users can build intuition about which prompts stay lightweight and which workflows require deeper analysis. Use Azure Cost Management to monitor the subscription-level cost of agent usage, and keep the Observability Agent cost distinct from standard Azure Monitor telemetry costs such as logs ingestion, retention, alerting, and web tests. For current pricing details, billable behavior, and any updates to what is billed in preview or GA experiences, use the official billing documentation as the source of truth. Coming up... Looking ahead, we plan to introduce billing caps for the Observability Agent, giving customers greater control over monthly token consumption, capacity usage, and overall costs. Learn more Billing and cost management for Azure Copilot Observability Agent Azure Copilot Observability Agent overview Chat with your observability data Deep investigations in the Azure Copilot Observability Agent Autonomous operations in the Observability Agent Azure Monitor pricing We’d love your feedback The Observability Agent continues to evolve based on real-world usage and operator feedback. Share feedback through the Give Feedback option in the product, or reach us at noakuper@microsoft.com.743Views0likes1CommentPublic Preview: Advanced platform metrics in Azure Monitor
We are excited to announce the Public Preview of advanced platform metrics for Azure Monitor, delivering more granular telemetry to help customers monitor and optimize their workloads more effectively. This new capability builds on Azure Monitor platform metrics, which continue to provide broad insight into the health, activity, and consumption of Azure resources. Advanced platform metrics add finer-grained signals, helping customers pinpoint changes and trends within resources more quickly and accurately. Azure Storage is the first Azure resource to provide advanced platform metrics to customers. Today, Azure Storage users rely on platform metrics to understand overall storage account trends, but this account-level telemetry does not always show what is driving change. For example, a storage account may show steady capacity growth without revealing which specific container is responsible. That growth could be coming from one container used for backups, another storing application logs, or a staging container used by a data pipeline. Advanced platform metrics for Azure Monitor address this scenario by providing container-level visibility, helping customers quickly identify where growth is occurring, investigate unexpected consumption increases, and make more informed cost and capacity planning decisions. What is available in Public Preview? In Public Preview, the following advanced platform metrics are available for Azure Storage across all Azure public cloud regions: Container Blob Capacity: The amount of storage used by a specific container in a storage account. Container Blob Count: The number of blob objects in a specific container in a storage account. Pricing and billing Advanced platform metrics for Azure Monitor are offered as a paid capability during Public Preview. For the latest pricing details, see Azure Monitor pricing. Getting started Advanced platform metrics can be enabled per storage account through PowerShell or Azure CLI. For instructions on enabling, managing, and viewing Azure Storage advanced platform metrics, see Azure Platform Metrics for Azure Blob Storage (preview). After advanced platform metrics are enabled for a storage account, they can be queried, visualized, and used for alerts through the same existing platform metrics experiences. Container Blob Capacity and Container Blob Count will appear in the Metric dropdown menu in Metrics Explorer, alongside all existing Azure Storage platform metrics. Users can then select Apply splitting and choose Container name to view metrics for individual containers. The chart below shows container-level capacity data for three containers. Azure Storage scenarios enabled by advanced platform metrics Standard Azure Monitor platform metrics provide visibility into the storage account as a whole, such as total blob capacity or total object count. With the addition of advanced platform metrics for Azure Storage, customers can understand which individual containers are contributing to growth, object count increases, or operational issues, enabling scenarios such as: Cost analysis and internal attribution: In shared storage accounts, identify which containers are consuming the most storage so teams can better understand which applications, environments, or business functions are driving usage without building custom reporting pipelines for this scenario. Capacity planning and growth forecasting: Track storage growth at the container level to see which workloads are driving overall account growth and make more informed planning and budgeting decisions. Runaway storage growth detection: Quickly isolate individual containers experiencing unexpected increases in capacity or object count, reducing investigation time when usage changes unexpectedly. What's next? As the feature moves toward General Availability (GA) and beyond, customers can expect to see more advanced platform metrics for Azure Storage, as well as new advanced platform metrics for other Azure resources. Continue to follow the Azure Observability Blog for the latest updates. Feedback We would love to hear your feedback on advanced platform metrics, including how your teams are using the feature to optimize workloads and additional advanced platform metrics that you would like to see onboarded to Azure Monitor. Please fill out this Azure Monitor advanced platform metrics feedback form, or email advancedplatformmetrics@microsoft.com.1.2KViews1like0CommentsAzure Monitor Observability Agent goes autonomous (preview)
Autonomous operations for the Azure Copilot Observability Agent are now in public preview, alongside the agent's general availability. With autonomous operations enabled, the Observability Agent listens to your alerts as they fire, triages them in the background, and runs deep investigations on the issues it creates. Along the way, it correlates related alerts into a single issue - so your team starts from a small set of explained, investigated issues instead of a stream of raw alerts. Until now, teams invoked the agent when they needed it - an interactive assistant, ready to investigate when you pointed it at a problem. Now it also prepares triage context continuously, on its own, while people stay responsible for decisions and any change to the environment. See autonomous operations in action. The Observability Agent triages incoming alerts, correlates related ones into a single Azure Monitor issue, and runs a deep investigation automatically, with no human trigger. From alerts to answers Azure Monitor already gives you strong signals when something is wrong - across both metric and log alerts. Dynamic thresholds learn normal behavior and flag anomalies automatically, and that same anomaly detection now extends to log search alerts and, in preview, to Prometheus and OpenTelemetry metrics. Smart detection in Application Insights surfaces failures and performance anomalies without manual rules. The hard part is what happens next: connecting dozens of alerts, working out what they share, and figuring out what's actually going on - before anyone can act. That's the work that still lands on a person, often in the middle of the night. It's exactly where the Observability Agent comes in. What's in the public preview In public preview, you can enable the Observability Agent to: Promote individual prominent alerts into issues when you configure that with custom instructions. Run a deep investigation automatically on every issue it creates. Correlate related alerts into a single Azure Monitor issue, with a natural-language explanation of why they belong together. You provision the agent once as a resource in your Azure environment - a dedicated identity to scope, govern, and assign autonomous tasks to - then turn on autonomous operations and it gets to work. What it changes for your team The outcome is fewer things to look at and faster triage: Your team works from a short queue of meaningful issues, not a constant stream of alerts. Each issue arrives with context, reasoning, and an investigation already attached. Low-priority issues can be reviewed and dismissed in seconds. The assembly work that used to come first now happens before anyone is paged. People still make every decision and every change. The agent just makes sure they start with full context. How it works Your own instructions. Topology shows how services connect, but your team knows which boundaries matter: ownership, escalation paths, and the alerts that should always become issues. Custom instructions let you capture that in plain language and apply it going forward. For example: "The billing service is owned by a different team with a separate on-call rotation. Even when billing alerts fire alongside clinical service alerts, treat them as separate issues." Instructions shape how the agent correlates and creates issues. They don't grant permissions, bypass Azure RBAC, or change resources. Automatic topology discovery. Point the agent at your Application Insights resource and it maps services, dependencies, and how they relate. That map becomes persisted knowledge the agent builds and reuses - the same context that grounds both its correlation decisions and its deep investigations, so reasoning reflects your real architecture instead of starting from scratch each time. Deeper investigations. When the agent investigates a correlated issue, it starts from the whole picture: every related alert, every impacted resource, and the reasoning correlation already produced. The result is sharper root-cause hypotheses and recommendations that account for the full scope of impact. In practice A database latency spike triggers alerts across checkout, billing, and recommendation services. Without autonomous operations, each alert is triaged on its own. With autonomous operations enabled, the Observability Agent groups the related alerts into one issue, explains the shared timeline, and starts investigating automatically. Because your custom instructions define billing as a separate ownership boundary, its alerts become a distinct issue routed to that team's rotation. Responders start from two clear, ownership-aligned issues - each already investigated - instead of dozens of isolated alerts. What's next Autonomous operations mark the next step for the Observability Agent: from user-invoked analysis to continuous preparation. The agent assembles the context, explains the issue, and runs the investigation; your team reviews the evidence and decides what to do. And once issues are created, you can act on them. Azure Monitor issues connect to Action Groups, so approved actions can flow into your existing workflows - more on that in a future post. Next steps Learn how to get started with the Azure Copilot Observability Agent. Review the preview details in Autonomous operations in the Observability Agent. Explore how investigations work in Deep investigations in the Observability Agent. Learn how teams preserve context with Azure Monitor issues. Stay connected Follow this blog for ongoing deep dives, updates on current capabilities, and a preview of what's coming next. Live webinar A walkthrough of real Observability Agent scenarios, best practices, and what's available today, along with a look at what's coming next and live Q&A with the product team. Register for the Observability Agent webinar We'd love your feedback The Observability Agent continues to evolve based on real-world usage and operator feedback. Share your thoughts directly through the Give Feedback option in the experience or reach us at azureobsagent@microsoft.com. 577Views1like0Comments
Export historical data from Log Analytics workspace with Export Job (preview)
Log Analytics Export Job is now available in public preview. It gives you a straightforward way to export historical log data from your workspace to Azure Blob Storage, without writing custom scripts or disrupting live operations. You submit a job including a query, time range, and the service handles the rest asynchronously. Historical data had no built-in exit path Your Log Analytics workspace accumulates months, sometimes years, of telemetry. That data has real value beyond the workspace: training security models, satisfying compliance requirements, supporting forensic investigations with external tools, or migrating to a new analytics platform. The challenge has always been getting it out. Log Analytics supports continuous data export for ongoing ingestion, but that doesn’t help with data that already exists. Teams that needed to export historical data had to build their own solutions: scripted query loops, Logic Apps, or Azure Functions calling the query API in batches and stitching results into storage. These approaches were slow, brittle, and hard to operationalize at scale. Export Job closes that gap. One job per table, across Analytics and Basic tiers You target a specific table, define a KQL filter on table, set a time range, and the job exports that data, whether it sits in Analytics or Basic tier, writing the results directly to your storage account as Parquet files. End-to-end flow of a Log Analytics Export Job You can filter with KQL to scope the export to exactly the columns and records you need, reducing cost and downstream processing time. Output is gzip-compressed Parquet, the standard columnar format for data lakes, Spark, Azure Data Explorer, and most ML frameworks, with no conversion step required. Export data in hourly folders to your blob storage. Billing is based on two existing meters: data scanned, using existing Log Analytics scan rates, and data volume exported as measured in your storage account. Resilient execution Large exports can be interrupted by network issues, transient storage errors, or downtime. Export Job includes a built-in retry mechanism to overcome these interruptions automatically. The service splits the job into hourly bins, each tracked and written independently to your storage container. Transient failures are retried without any action on your part. If a bin fails after retry exhaustion or job 7-days' timeout, you can retry it manually within 7 days of job completion, without restarting the entire job or re-exporting data that already completed successfully. Before a retry writes new data, any partial output from the failed bin is automatically cleaned up, so there is no risk of duplicates in your storage account. Getting started Log Analytics Export Job is available in public preview today. Configuration is programmatic through the Azure Monitor REST API, letting you create, check status, cancel, and retry jobs. Before your first job: Enable the workspace Managed Identity in your Log Analytics workspace settings. Assign the Storage Blob Data Contributor and Log Analytics Reader roles to the workspace Managed Identity on your destination storage account. Ensure the destination storage account is in the same Azure region as the workspace (cross-region support is on the roadmap). Enable the Jobs category in your workspace’s diagnostic settings, to route job execution records to the LAJobLogs table. This gives you creation time, job parameters, and bin-level status for every job you run. Assess that export volume and run duration using suggested query in export job article. Consider export job bounderies: The maximum time range per job is one year The maximum run duration per job is seven days. When reached due to volume, you can retry to continue export from where it stopped. Five concurrent jobs are supported Once prerequisites are in place, create a job with a single API call: POST https://api.loganalytics.azure.com/v2/subscriptions/{subscriptionId}/resourcegroups/{resourcegroup}/providers/Microsoft.OperationalInsights/workspaces/{workspace}/jobs/export?api-version=2023-09-01-preview Authorization: {credential} content-type: application/json { "startTime": "2025-01-01T00:00:00Z", "endTime": "2025-06-30T23:59:59Z", "query": "{query}", "destinationStorageAccounts": [ "/subscriptions/{subscriptionId}/resourceGroups/{resourceGroupName}/providers/Microsoft.Storage/storageAccounts/{storageAccountName}" ], "containerName": "{containerName}", "outputDataFormat": "Parquet", "dateTimeFormat": "yyyy-MM-ddTHH" } Copy the job ID returned in the response, which can be used to poll status, cancel, or retry individual failed bins. Learn more: https://aka.ms/LogsExportJob Share your feedback as we continue to improve the feature.527Views0likes0Comments
Find anomalies in Prometheus and OpenTelemetry metrics with Dynamic Thresholds (Preview)
Dynamic thresholds are extended to query-based metric alerts in Azure Monitor, allowing to detect and alert on anomalies in Azure Monitor managed Prometheus metrics and OpenTelemetry metrics stored in an Azure Monitor Workspace. This follows the introduction of Dynamic Thresholds for Log search alerts — Azure Monitor now offers consistent Dynamic Thresholds support across logs and metrics — platform metrics, log search queries, and now query-based metric alerts. A consistent anomaly-detection approach, wherever your signals live. Dynamic thresholds are not a single static formula. They apply a range of machine-learning models and algorithms to historical query results, learn each series’ normal rhythm — including hourly, daily, and weekly seasonality — and automatically fit the most appropriate baseline separately to every time series. This way, a single alert rule can monitor many resources or dimensions while each one gets its own independent, self-refining baseline. Why Dynamic Thresholds Matter Simpler configuration: Reduce the need to define, maintain, and continuously tune static thresholds inside PromQL alert logic. Adaptive monitoring: Let alert thresholds adjust to changing workload behavior, recurring traffic peaks, and seasonal usage patterns. At-scale intelligence: Monitor multiple time series with a single alert rule, while Azure Monitor learns an independent baseline for each resource or dimension combination. Example 1 — Spot CPU anomalies in AKS workloads Scenario: Monitor container CPU utilization across pods or deployments in AKS with a query-based metric alert built on Prometheus metrics. Example query: sum by (microsoft_resource_id, namespace, deployment, container) (rate(container_cpu_usage_seconds_total[5m])) / sum by (microsoft_resource_id, namespace, deployment, container) (container_spec_cpu_quota / container_spec_cpu_period) Why dynamic thresholds help: CPU usage of a Kubernetes workload changes with workload mix, deployment timing, scaling activity, and traffic patterns. Static thresholds can be difficult to tune across namespaces, deployments, and containers. Dynamic thresholds learn a separate baseline for each monitored time series — in this example, for every pod, deployment, and container combination — so genuine CPU spikes stand out while expected variation from autoscaling and traffic mix stays quiet. Example 2 — Catch application latency regressions sooner Scenario: Detect abnormal latency patterns in an application by alerting on custom OpenTelemetry metrics stored in an Azure Monitor Workspace. Example query: histogram_quantile(0.95, sum by (le, service_name, http_route, http_method) (rate(http_server_duration_seconds_bucket[5m]))) Why dynamic thresholds help: Application latency naturally changes with traffic, user behavior, and release cadence. Fixed thresholds can be noisy during peak periods and too loose during quiet ones. Dynamic thresholds learn a separate baseline for each time series — here, for every service, route, and method — so real p95 latency regressions surface even as traffic and release cadence shift throughout the day. Best practices for better results To get the best results from dynamic thresholds for PromQL-based alerts, design your query so Azure Monitor can learn a clear, stable signal over time: Keep the expression numeric. Dynamic thresholds work best when the query returns a continuous numeric signal rather than a Boolean true/false result. For example, use an expression that calculates CPU usage, not a Boolean comparison like CPU > 0.8. Use meaningful dimensions. Split by dimensions such as namespace, deployment, service, or route when you want separate baselines for different workloads or endpoints. Prefer stable entities. Use longer-lived dimensions or aggregate across short-lived entities so the model has enough consistent history to learn from. In Kubernetes, for example, deployment is usually a better baseline dimension than individual pod ID. Choose the right threshold behavior. Decide whether the alert should trigger on values above the learned upper bound, below the lower bound, or both. Start with medium sensitivity. Use Medium as a balanced default, then tune up or down based on noise and missed anomalies. Allow enough historical data. Dynamic thresholds improve as more history is collected. Initial seasonal patterns use recent history, and weekly seasonality becomes more effective after several weeks of data. Get started Ready to try it? Create a query-based metric alert with dynamic thresholds on your metrics in Azure Monitor Workspace. You can create such rules in the Azure portal, where the built-in preview chart shows when your dynamic threshold alert would have fired based on historical baseline analysis. Use the preview chart to tune both the PromQL query and the dynamic threshold sensitivity before enabling the rule. You can also create query-based metric alert rules using programmatic interfaces or resource templates. Figure 1. Dynamic thresholds preview chart showing the learned baseline and the points where an alert would have fired. Dynamic thresholds cut alert noise where it starts — at detection. The alerts that do fire connect into Azure Monitor’s broader AIOps experience, where the Azure Copilot Observability Agent can help correlate signals into investigated issues with explainable reasoning — with humans in control. Next steps Related blog: Anomaly detection made easy with Dynamic thresholds for Log search alerts Dynamic thresholds in Azure Monitor Query-based metric alerts overview Create query-based metric alerts Prometheus metrics in Azure Monitor OpenTelemetry on Azure Monitor Stay connected Follow the Azure Observability Blog for more updates on Azure Monitor, Prometheus-based monitoring, alerting, and troubleshooting experiences. We’ll continue sharing product updates, practical guidance, and examples to help you improve observability across your Azure environments. Feedback We’d love to hear how dynamic thresholds for query-based metric alerts work for your scenarios. Share your feedback through your Microsoft account team, Azure support channels, or the feedback options in the Azure portal so we can continue improving the experience.261Views0likes0Comments