azure databricks
3 TopicsDetecting corrupted data in under 1ms: what changes when Spark stops waiting for the micro-batch
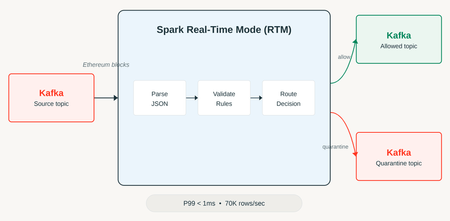
Streaming anomaly detection almost always runs into the same wall: the micro-batch. Traditional Structured Streaming processes data in one-to-two-second windows, which is fast enough for most use cases, but terrible when the very act of waiting for the batch to close is already too late. Fraud, sensitive payload validation, corrupted data entering a critical pipeline — these scenarios can't tolerate even a second of structural delay. Apache Spark's Real-time mode exists to attack exactly that gap, and Databricks published an experiment that uses a concrete use case to prove the point: analyzing Ethereum transactions in real time. What structurally changes in Real-time mode Unlike the micro-batch trigger, Real-time mode processes data as it arrives, without waiting for a window to close. That's possible through three combined architectural changes: a continuous flow of data between stages (instead of materializing an intermediate result on every batch), scheduling all stages of the query simultaneously (instead of scheduling stage by stage), and an in-memory streaming shuffle between stages, eliminating the cost of writing and reading shuffle files on every round. In practice, this brings Spark Structured Streaming closer to a continuous processing model, something historically associated with engines like Flink, but within the same runtime that already runs the rest of your organization's batch and streaming pipeline. The experiment: Ethereum transactions as a stress test The Databricks team built a pipeline that ingests blocks and transactions from the Ethereum network and classifies each event as ALLOW or QUARANTINE, based on two checks: Protocol invariant validation: a block where gas_used is greater than gas_limit is logically impossible under the Ethereum protocol's own rules, so it becomes an automatic signal of corrupted or malformed data. Payload hygiene: the block's extra_data field is scanned for patterns that shouldn't be there, such as a fragment of PII, a JWT token, or an AWS access key leaked by accident. The cluster used was Databricks Runtime 16.4 LTS, four i3.xlarge workers, a dedicated (single-user) cluster, with Photon deliberately disabled to isolate the effect of Real-time mode itself. The numbers behind the promise Sustained input rate of approximately 65,592 rows per second. Sustained processing rate of approximately 69,713 rows per second (the engine was able to absorb the input without building up backlog). More than 23.2 million messages processed over the course of the experiment. P95 latency under 0.5 millisecond. P99 latency of 1 millisecond. For context: a traditional 1-2 second micro-batch represents a three-order-of-magnitude difference in detection latency. If the goal is to stop a suspicious transaction before it propagates, that difference isn't cosmetic. Hands-on: a skeleton for real-time classification The "classify and route" pattern described in the experiment can be reproduced on any structured event schema. Here's a simplified example using transformWithState, the operator that gives you access to custom stateful logic inside Structured Streaming: from pyspark.sql.streaming import StatefulProcessor, StatefulProcessorHandle from pyspark.sql.types import StructType, StructField, StringType, LongType class BlockValidator(StatefulProcessor): def init(self, handle: StatefulProcessorHandle): self.handle = handle def handleInputRows(self, key, rows, timer_values): for row in rows: status = "ALLOW" if row["gas_used"] > row["gas_limit"]: status = "QUARANTINE" elif self._contains_sensitive_pattern(row["extra_data"]): status = "QUARANTINE" yield {"block_id": row["block_id"], "status": status} def _contains_sensitive_pattern(self, payload: str) -> bool: markers = ["AKIA", "eyJhbGciOi", "-----BEGIN"] return any(m in (payload or "") for m in markers) query = ( spark.readStream.table("bronze.eth_blocks") .groupBy("block_id") .transformWithState( statefulProcessor=BlockValidator(), outputStructType=StructType([ StructField("block_id", LongType()), StructField("status", StringType()), ]), ) .writeStream .trigger(availableNow=False) # real-time trigger is configured at the cluster/runtime level .toTable("silver.eth_blocks_classified") ) Worth reinforcing: enabling Real-time mode itself depends on runtime- and cluster-level configuration, it's not just a matter of swapping the trigger in the API, so the official reference documentation should be consulted before running this in production. In practice: I'd test this kind of pipeline under real load spikes, not just a constant rate, before blindly trusting the p99 number. Real Ethereum network traffic has much more irregular transaction bursts than a synthetic constant-throughput test, and it's under bursts that any low-latency system tends to reveal its real queueing behavior. Why Ethereum was a smart benchmark choice It's worth pausing for a moment on why Ethereum was chosen as the test scenario, because it isn't obvious at first glance. Ethereum transactions have two properties that make them an honest stress test for an anomaly detection system: first, the volume is public and replicable, anyone can audit the dataset used, which reduces the chance of an artificially favorable benchmark. Second, and more important, the protocol's invariant rules (like gas_used never being allowed to exceed gas_limit) are known and deterministically verifiable, so there's no ambiguity about what counts as a real anomaly versus a false positive. That removes a confounding variable common in anomaly-detection benchmarks, where the very definition of "anomaly" is already subjective. Applied to a corporate scenario, the equivalent would be having clear, auditable business rules (credit limit, expected value range, field format) before trying to apply this kind of real-time classification; without that, the technical pipeline works fine, but classification quality collapses. What this doesn't solve Real-time mode drastically reduces processing latency, but it doesn't replace the need for a good response strategy for suspicious data. Classifying something as QUARANTINE in one millisecond is pointless if the human or automated process that handles that alert still takes minutes or hours to act. It's also important to note the documented limitations of transformWithState in real-time mode: transformWithStateInPandas isn't supported in this mode, and state management (timers, TTL) has its own rules that differ from the traditional micro-batch mode, which requires extra care when migrating an existing pipeline. Wrapping up The Ethereum experiment works as a proof of concept for something broader: once Spark Structured Streaming itself can operate in the millisecond range, scenarios that used to require leaving the Spark ecosystem (fraud, critical validation, immediate operational alerting) start to fit inside the same runtime that already processes the rest of your data pipeline. It's worth testing, but with a realistic expectation of what still depends on human decision-making and response after detection. References Ultra-fast anomaly detection using Apache Spark Real-Time Mode (https://www.databricks.com/blog/ultra-fast-anomaly-detection-using-apache-spark-real-time-mode) (official Databricks blog) Apache Spark Structured Streaming Real-Time Mode: concepts (https://docs.databricks.com/aws/en/structured-streaming/real-time/concepts) (official documentation) Real-time mode concepts (https://learn.microsoft.com/en-us/azure/databricks/structured-streaming/real-time/concepts) (Microsoft Learn) Stateful applications with transformWithState (https://docs.databricks.com/aws/en/stateful-applications/) (official documentation) Build a custom stateful application with transformWithState (https://learn.microsoft.com/en-us/azure/databricks/stateful-applications/) (Microsoft Learn)46Views0likes0CommentsThe Gap Between Applications and Analytics, and "How Lakebase Solves It"
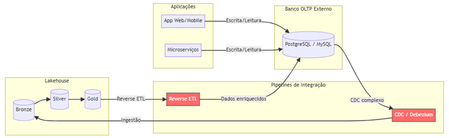
The Problem Nobody Likes to Admit. Imagine this scenario: your data team has built a flawless lakehouse. Ingest pipelines, bronze/silver/gold tiers, gleaming dashboards. Everything is working perfectly. Until someone asks: "And the production app? Where does it store the transactional data?" That's where the headache begins. You need a separate OLTP database (Postgres, MySQL, DynamoDB...), CDC pipelines to bring data into the lakehouse, reverse ETL to return enriched data to the app, and an infrastructure team to keep it all running. The result? Data silos, synchronization latency, operational complexity, and ever-increasing costs. Traditional Architecture (and Its Pain Points) Here's how most companies operate today: Pain points in this architecture: Multiple tools and suppliers for managing Significant latency between writing on OLTP and availability on Lakehouse. Fragmented governance — Unity Catalog doesn't see the external bank. High operational costs associated with synchronization pipelines. What is Lakebase? Lakebase is a fully managed Postgres database natively integrated with the Databricks Data Intelligence Platform. It is designed to bridge the gap between transactional (OLTP) and analytical (OLAP) workloads, unifying everything into a single ecosystem . In simple terms: it's like having a high-performance Postgres server living inside your lakehouse , with unified governance via Unity Catalog, native bidirectional synchronization, and modern capabilities such as autoscaling, scale-to-zero, and database branching. The New Architecture with Lakebase: What changes? Zero external database infrastructure Native bidirectional synchronization (no Debezium, no Airflow, no pain) Unified governance through the Unity Catalog A single control plane for OLTP + OLAP The Architectural Innovations of Lakebase Lakebase is not "just another managed Postgres." It brings modern data engineering concepts to the transactional world. 1. Separation of Compute and Storage Unlike traditional data banks where CPU and disk are coupled, Lakebase completely separates computing resources from storage. This means you scale each independently, paying only for what you use. 2. Copy-on-Write Storage The storage system uses a copy-on-write approach. In practice, when you create a branch of the database, there is no data duplication —only the changes are stored separately. This makes operations like branching and restoring virtually instantaneous. 3. Autoscaling and Scale-to-Zero The compute system automatically adjusts its capacity based on demand. During periods of inactivity, the database scales to zero , eliminating costs. When a request arrives, it "wakes up" in seconds. Database Branching: Git for Your Data This is probably the most innovative feature. Just as developers create branches in Git to work on isolated features, Lakebase allows you to create branches for the entire database . Powerful use cases: Development : each developer has their own branch of the database, without interfering with production. Migration testing : test schema changes in an isolated branch before applying them to production. Instant Restore : Restore the database to any point in time (configurable window from 0 to 30 days) by creating a branch from that point. Two-Way Synchronization: The End of Reverse ETL One of the biggest advantages is the native synchronization between Lakehouse and Lakebase: Synced Tables (Lakehouse → Lakebase) Unity Catalog tables are automatically synchronized to Lakebase, allowing applications to query rich analytical data with low latency. Supports Snapshot, Triggered, and Continuous modes. Lakehouse Sync (Lakebase → Lakehouse) Transactional data from Lakebase is continuously replicated to Delta tables in the Unity Catalog using Change Data Capture (CDC). The destination tables follow the SCD Type 2 standard , maintaining a complete history of changes. This completely eliminates the need for: External CDC tools (Debezium, Fivetran) Reverse ETL pipelines (Census, Hightouch) Custom synchronization jobs in Airflow/Prefect Three Strategic Use Cases Feature Serving for Real-Time ML Lakebase functions as an online store for Databricks' Feature Store. Features computed in the lakehouse are synchronized via Synced Tables to Lakebase, from where ML models query them with millisecond latency. State of AI Agents AI agents need to persist state between requests — conversation context, action history, workflow data. Lakebase provides a native transactional database to store this state with ACID consistency. Transactional Data for Applications Databricks Apps (or any external application) can use Lakebase as their primary database. The integration is native: simply add the Lakebase project as a resource in your app. Additionally, the Data API offers a PostgREST-compatible REST interface for direct HTTP access. Comparison: Before and After Availability Lakebase Autoscaling is available in the following AWS regions: us-east-1, us-east-2,us-west-2 ca-central-1, sa-east-1 eu-central-1, eu-west-1,eu-west-2 ap-south-1, ap-southeast-1,ap-southeast-2 The presence in sa-east-1 is particularly relevant for us in the Brazilian community, ensuring low latency for applications hosted in Brazil. Conclusion Lakebase represents a paradigm shift: instead of treating OLTP and OLAP as separate worlds that need complex "bridges," it unifies them into a single platform. For Brazilian data teams, this means: Fewer tools to manage and integrate. Fewer pipelines that silently break down at 3 a.m. More time focused on generating value with data. Real governance across the entire data lifecycle — from transactional writing to the executive dashboard. Lakehouse finally has its native transactional database. And it speaks Postgres. This post was inspired by concepts from the official Databricks documentation. For more technical details, please refer to the Lakebase documentation . Wiliam Rosa Data Engineer | Machine Learning Engineer linkedin.com/in/wiliamrosa Blog: https://wiliamrosa.github.io65Views0likes0Comments
Workspace failure
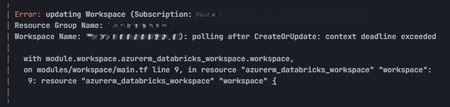
Hi Community, I had my Databricks workspace up and running and it was managed through terraform, and encryption was enabled through cmk, there were some updation in the code, so I put terraform plan, one of the key changes(replace) it showed me was "azurerm_role_assignment.storage_identity_kv_access module.workspace.azurerm_role_assignment.storage_identity_kv_access" the terraform run was running for 30 min, and the workspace was in deployment for long time and then ultimately got failed. Again, as all the changes were not done, I reapplied, and I got this error "Performing CreateOrUpdate: unexpected status 400 (400 Bad Request ) With error: InvalidEncryptionConfiguration: Configure encryption for workspace at creation is not allowed, configure encryption once workspace is created and key vault access policies are added" Again, I applied and everything and terraform run succeeded but I can see in azure portal that workspace is in failed state, but if I go to Databricks account I can see Databricks as running and if I go to workspace, I am able to start clusters and execute some queries. I am not able to launch the workspace using azure portal, not sure there will be other issues due to this. Could anyone help me to resolve this issue. Let me know if you need anything further to investigate the issue.218Views0likes3Comments