azure app service
518 TopicsRun an Ollaya decision model on Azure Container Apps
Many AI calls are not really conversations. A support message needs an intent. A workflow needs a route. A policy check needs a yes or no. An agent needs to select its next action from a known list. These are bounded decisions, but they are often sent to a general-purpose LLM. The LLM reads the request, generates an answer token by token, and then the application validates and parses the response. That is useful when the task needs reasoning or language generation. It is more machinery than necessary when the only valid answer is one of 60 labels. On September 15, 2026, TypeSafe released Jev, its first public System One Model, in early access. Jev has helped bring attention to models built specifically for decisions: structured state goes in, and typed choices with probabilities come out. Ollaya approaches the same problem from a self-hosted direction. It is a model runtime that can serve open decision models, including the winnow:e4b model used here. Jev and Ollaya are not connected products. Jev is a hosted model from TypeSafe; Ollaya provides a way to run decision models in infrastructure you control. They are related by the kind of work they target. What decision models are good at A decision model scores predefined options rather than generating open-ended text: Decision model Traditional LLM Selects from allowed choices Generates text Returns a probability for each decision Usually returns one generated answer Has a bounded, typed output Needs schema constraints and validation Supports confidence thresholds Often needs a separate confidence strategy Fits classification, routing, scoring, policy, and prioritization Fits generation, summarization, coding, and open-ended reasoning That narrower interface creates several practical benefits: Predictable outputs: the application receives an allowed value rather than text that must be repaired or parsed. Lower decision latency: there is no autoregressive output sequence to generate. Token savings: a decision can be returned without generating output tokens. Useful uncertainty: calibrated probabilities let the application act, reject, or escalate. Smaller infrastructure: a specialized model can fit on hardware that would be modest for a general LLM. Decision models are not replacements for every LLM call. They make sense when the possible outcomes are known before the request arrives. An LLM remains the better tool when the output itself is language, code, or open-ended reasoning. Why Azure Container Apps serverless GPU Azure Container Apps serverless GPUs make self-hosted inference feel much closer to consuming a managed API. You bring the container and model; Azure manages the underlying GPU infrastructure. The Consumption GPU profile provides: NVIDIA T4 or A100 GPUs without managing GPU nodes or a Kubernetes cluster. Automatic scaling with the option to scale to zero. Per-second GPU billing while replicas are running. Container Apps networking, identity, ingress, logging, and revision management. A private inference path where the model and request data stay inside your Azure environment. That last point matters for data-sensitive decisions. In the Ollaya-only configuration, text is sent to an internal Ollaya endpoint rather than an external model API. The model, API, persistent cache, and operational controls remain in the application's Azure environment. Serverless does not remove the need to think about cold starts. A model still needs to be loaded into VRAM. For low or sporadic traffic, scaling to zero can avoid idle GPU cost. For latency-sensitive traffic, a warm minimum replica avoids making a user wait for the model to load. Azure Files can retain the model layers across revisions so a new deployment does not download the full model again. The T4 is also an important part of this experiment. It is not the largest GPU available, but the goal is not to run the largest model. The goal is to match the hardware to a model designed for the task. A focused decision model on a T4 can compete with a hosted API when the workload is a bounded classification rather than text generation. The experiment I deployed winnow:e4b through Ollaya on an Azure Container Apps Consumption-GPU-NC8as-T4 workload profile. An authenticated API exposed the classifier while Ollaya remained on internal-only ingress. A second path sent the same requests to GPT-5.4 Nano through Azure OpenAI using managed identity. The evaluation used the complete 2,974-record test partition from Amazon MASSIVE 1.1. It contains 18 scenarios and 60 intents. Both providers received the same records, labels, and descriptions. The benchmark measured latency at concurrency 1 and throughput at concurrency 8. Providers and modes ran sequentially so one measurement did not load the service used by another. This was not a direct benchmark of Jev; it tested the same decision-model pattern with an open model that could run inside the Azure environment. What the results showed The benchmark ran on September 30, 2026. Provider Successful Intent accuracy Macro-F1 p50 p95 Winnow on T4 2,974 / 2,974 75.59% 76.40% 946 ms 960 ms GPT-5.4 Nano 2,974 / 2,974 79.12% 78.07% 1,369 ms 2,489 ms Nano led intent accuracy by 3.53 percentage points. Winnow was 30.9% faster at p50 and 61.4% faster at p95. This is the useful T4 result: a smaller GPU running the right specialized model matched and beat the hosted endpoint on response latency, though not on accuracy. At concurrency 8, Nano delivered 1.367 requests per second compared with Winnow's 1.120. Nano also had 25 requests fail after eight retries because the deployment exceeded its token-rate limit. Winnow completed all 2,974 requests, but its single loaded runner serialized work and increased queue time. The token comparison shows what the decision-only path removes: Provider, both benchmark passes Input tokens Cached input tokens Output tokens Winnow on T4 9,252,872 0 0 GPT-5.4 Nano 8,501,200 7,564,800 122,759 Winnow returned every decision without generating output tokens. Nano generated 122,759 output tokens across the latency and throughput passes. The rows do not represent equivalent billing models: Winnow consumes self-hosted GPU time, while Nano is metered by hosted token usage. The comparison isolates the generated tokens that a bounded decision did not need. Winnow also returned calibrated probabilities. At a 0.90 threshold, it accepted 53.73% of the records and was correct on 94.43% of those accepted decisions. An application could handle that high-confidence group locally and send only the uncertain remainder to an LLM or human reviewer. In brief A decision model is useful when software needs a bounded answer rather than generated language. In this experiment, Winnow on a serverless T4 traded some accuracy for lower latency, zero generated output tokens, private inference, and an explicit confidence signal. The practical design is often a combination: use the decision model for fast, high-confidence choices and reserve LLM calls for uncertain or open-ended work. Try it with the template The Azure Developer CLI template packages the Container Apps environment, T4 workload profile, authenticated API, internal Ollaya service, persistent model cache, GPU readiness checks, and benchmark. It supports two deployment modes: Mode What it deploys ollaya-only Private Winnow inference on a serverless T4 plus the authenticated API full The Ollaya deployment, GPT-5.4 Nano, and the comparison benchmark Read the deployment guide Inspect every benchmark prediction and retry Review the shared MASSIVE taxonomy469Views0likes0CommentsMeet the Hosted Skills Canvas: Build, Run, and Debug in GitHub Copilot
Build, run, and debug event-driven AI apps right inside GitHub Copilot. The new Azure Functions Hosted Skills canvas brings instructions, triggers, and live results into one workspace—so you can spend less time switching tools and more time building. 572Views1like0Comments
Bring managed browser automation to your agent applications
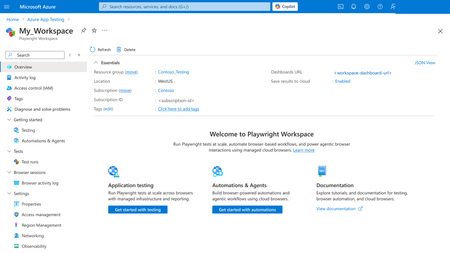
AI agents become more useful when they can move beyond conversation and complete real workflows. Playwright Cloud Browsers provides managed, on-demand browser capacity that agent applications can access through Model Context Protocol (MCP). You can connect Playwright Cloud Browsers to agent applications, including coding agents such as the GitHub Copilot app and Visual Studio Code: when they support custom remote MCP servers. Once connected, an agent can navigate an approved application, complete forms, verify results, capture evidence, and close the managed browser session. Your team gets browser automation without maintaining browsers in every user or agent environment. In this example, we use the GitHub Copilot app to show the connection and workflow. You can extend the same approach to other compatible applications by adding the Playwright workspace endpoint through their custom remote MCP configuration. Example: Follow one registration request from start to finish If your team processes employee registrations for approved training programs, each request can involve several repetitive steps: open the portal, enter employee and course information, check required fields, review the details, submit the form, and retain confirmation evidence. After you connect the workspace MCP endpoint, you can ask your agent application to handle the browser steps. In the GitHub Copilot app, for example, you could use this prompt: "Use Playwright Cloud Browsers to open <approved-registration-portal-url> and process case <number>. Enter the employee and course information I provide, validate all required fields, and show me a structured summary. Do not submit until I approve it. After approval, submit once, verify the confirmation number and success message, capture a screenshot, and close the browser session. If submission times out, inspect the page before deciding whether a retry is safe." The prompt defines the outcome, approved destination, human decision point, evidence, and cleanup expectation. The agent handles repetitive browser interaction while you remain in control of the consequential submission. Connect managed browser capacity in minutes Every Playwright workspace provides a workspace-scoped MCP endpoint: https://<region>.mcp.playwright.microsoft.com/playwrightworkspaces/<workspace-id>/mcp Provision a Playwright workspace in the Azure portal. Open the workspace and copy its MCP endpoint. In the GitHub Copilot app, open Customize, select Add, and then select MCP. Choose HTTP, enter a server name, paste the endpoint, and select Save. For this illustrated setup, only the server name and workspace endpoint are entered. Follow your organization's authentication and access policies for the workspace. Figure 1. Open the Playwright workspace Overview page in the Azure portal Figure 2. Copy the workspace-scoped MCP endpoint Figure 3. Open Customize in the GitHub Copilot app Figure 4. Select 'MCP' Tab, and add the workspace endpoint as a custom HTTP MCP server This article demonstrates Add > MCP in the GitHub Copilot app. Other compatible applications use their own custom remote MCP configuration. Using another compatible application? In Visual Studio Code or another client that supports custom remote MCP servers, add the same workspace endpoint through that application’s MCP configuration. The interface can differ, but the endpoint and connection model remain the same. Features of Playwright Cloud Browsers 1. Watch the agent complete the form When the task begins, the agent creates a managed browser session and uses its browserSessionId throughout the registration flow. Session creation might also return a liveViewUrl; Live View availability depends on the session. When available, Live View lets you watch while the agent opens the portal, finds the registration fields, and enters the supplied information. The agent follows an observe-act-verify loop: inspect the page, enter the required values, wait for validation or dependent fields, and observe the page again. If you need to intervene rather than observe, Playwright Cloud Browsers provides Take Control for supported active sessions. An authorized operator can interact directly with the running browser to address an unexpected page state, complete an action that requires human judgment, or help troubleshoot the flow. Control can then return to automation. 2. Review before the consequential action Before submission, the agent presents a structured summary with the case ID, employee name, selected course, date, contact information, required acknowledgements, and any validation warning. It waits for explicit approval. Automation removes repetitive entry and navigation, while you retain authority over the action that creates the registration. After approval, the agent submits once. It verifies the success message and confirmation identifier, captures a screenshot when evidence is required, and reports the outcome. 3. Investigate errors before retrying A timeout or disconnected caller does not prove that submission failed. Repeating a non-idempotent action can create a duplicate registration. If the result is unclear, the agent first checks the page for a confirmation number, success message, changed status, or validation error. It retries only when the page state shows that repeating the action is safe. Console messages and network activity can explain client-side errors, failed requests, authentication problems, or validation behavior. Playwright Cloud Browsers also provides built-in observability and browser session data, including logs, traces, screenshots, recordings, and execution artifacts. Availability depends on the workflow, session, and configuration. 4. Close the session and monitor the result The agent closes the browser session whether the registration succeeds, fails, or is cancelled. Closed or expired sessions cannot be reopened. Explicit cleanup releases browser capacity promptly and reduces unexpected activity. Figure 5. Review MCP created sessions in the Azure portal Browser activity log Use Browser sessions > Browser activity log to review MCP-created sessions, source, start time, and duration. The result is one connected workflow: your agent application provides the conversational or coding experience, MCP provides the connection, and Playwright Cloud Browsers provides managed execution, visibility, human intervention, evidence, diagnostics, and auditability. Responsible use: Use browser automation only with approved websites, accounts, and data. Retain human review before consequential submissions, and never place workspace credentials, access tokens, or sensitive form data in prompts, source control, screenshots, or logs. Learn more Azure portal: https://portal.azure.com/ What is Playwright Workspaces?: https://learn.microsoft.com/azure/app-testing/playwright-workspaces/overview-what-is-microsoft-playwright-workspaces Create and manage a workspace: https://learn.microsoft.com/azure/app-testing/playwright-workspaces/how-to-manage-playwright-workspace Playwright Workspaces remote MCP server: https://learn.microsoft.com/en-us/azure/app-testing/playwright-cloud-browsers/quickstart-automate-browser-tasks-remote-mcp Manage workspace access tokens: https://learn.microsoft.com/azure/app-testing/playwright-workspaces/how-to-manage-access-tokens Customize the GitHub Copilot app: https://docs.github.com/copilot/how-tos/github-copilot-app/customize-github-copilot-app Add and manage MCP servers in Visual Studio Code: https://code.visualstudio.com/docs/agent-customization/mcp-servers256Views0likes0CommentsIntroducing a Guided Copilot Experience for Building Azure Apps in VS Code
Today we're previewing a new way to build cloud apps with GitHub Copilot in VS Code: a guided Copilot experience that takes you from idea to a deployed Azure app through a structured, predictable workflow instead of a free-form chat session that may or may not land where you need it to. The problem: Copilot is powerful, but unpredictable Ask Copilot to "build me a Node.js API on Azure Functions with a Postgres database" today, and you might get a working project, or you might not. Sometimes Copilot scaffolds the app but skips infrastructure. Sometimes it generates a deployment script that fails halfway through. Sometimes it forgets what you were building three prompts later. The underlying model is capable. The problem is the shape of the experience: an open-ended chat with no checkpoints, no guardrails, and no consistent path from "I have an idea" to "it's running in Azure." How it works The guided Copilot experience adds to that open-ended flow with three clear, explicit stages: 1. Project scaffolding: Describe your app in plain language. Copilot proposes an architecture and asks for anything that is missing (e.g., language, app type, Azure services) through simple forms and pickers, not more back-and-forth chat. You review and approve the plan before any code is written. 2. Local development: Your project is scaffolded then Copilot checks for the runtimes, emulators, and tools you'll need and helps you install what's missing, so the project runs locally from the very first launch. Debug configurations are wired up automatically, so you can test and iterate on your app before it ever touches Azure. 3. Deployment: Copilot shows the tools that will be used for deployment along with a summary of all resources that will be created and a cost estimate so you can be confident in what you're getting. Infrastructure files are created for your app to ensure a consistent and reproducible deployment environment for testing and staging before going to production. Deployment runs through the same reliable tooling used across Azure (az and azd), so if something goes wrong, you get a clear explanation and a concrete next step instead of a wall of CLI output. Once your app is live, the guided experience doesn't disappear, Copilot retains context about your project's architecture, so coming back later to add a service or make a change picks up right where you left off. 🎉 What this means for how you work Determinism over guesswork. The same input reliably produces the same kind of outcome, so no more wondering which "mode" Copilot is going to be in. First try success. Projects are built to run and deploy on the first attempt, not after several rounds of manual repair. Structure over chat walls. Decisions that matter such as architecture choices, missing configuration, and deployment targets are surfaced through real UI, so you're not parsing paragraphs of text to figure out what Copilot needs from you. Stay in VS Code. The entire journey, from planning through deployment, happens without leaving your editor. What's in the initial preview The first version focuses on JavaScript and TypeScript projects, including web apps, Azure Functions, Container Apps, and Static Web Apps, with support for PostgreSQL, Azure Storage, Azure Key Vault, and Azure OpenAI. .NET and Python support are on the roadmap for a future release. Nothing about your existing Copilot workflows changes, the guided experience is an additional, opinionated path alongside the free form chat you already know, for when you want a reliable, structured way to go from zero to deployed. What's next This is an early look at a broader shift in how we think about AI-assisted development on Azure: less "ask and hope," more structured collaboration with clear checkpoints and real UI where it counts. We're continuing to expand language support, refine the deployment experience, and incorporate feedback from developers using it in the wild. Install the Azure Tools extension pack and open an empty folder to try the guided Copilot experience and let us know what you think. File issues or share feedback on the GitHub repo.1.2KViews2likes0CommentsAzure App Service is now a trigger destination for Azure Managed Connectors
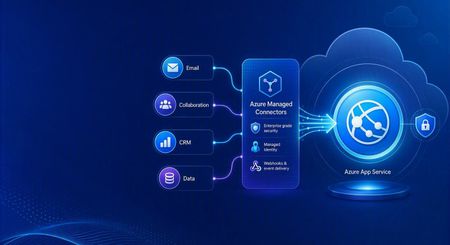
Azure Managed Connectors, currently in public preview, now lets you choose Azure App Service as a trigger destination. Connector events can be delivered directly to applications running on App Service, including ASP.NET Core, Java, Node.js, and Python applications. This is a new capability in the Managed Connectors public preview. It is not the announcement of a separate App Service preview. What's new When you create a trigger in the Managed Connectors portal, App Service now appears as a first-class destination alongside Azure Functions and the generic HTTP endpoint option. After selecting an existing App Service app, you configure: The application route that receives the event. New triggers default to POST /api/webhook , and the route can be edited. The Connector Namespace managed identity used to authenticate the callback. The Microsoft Entra audience expected by the receiving application. Managed Connectors then records the selected App Service resource, route, managed identity, and audience as part of the trigger configuration. You no longer need to select the generic HTTP destination and manually assemble the App Service callback URL. What are managed connectors? Managed connectors provide a consistent way for applications to integrate with services such as Office 365, SharePoint, Teams, Dataverse, and Salesforce. A Connector Namespace manages connections and connector operations so developers do not need to build a separate OAuth flow and service-specific client for every integration. Managed connectors support both directions: Triggers deliver events to your application, such as a new Outlook email or a file added to SharePoint. Actions let your application call operations such as posting a Teams message, flagging an email, or creating a list item. The App Service destination makes the trigger side a first-class option for existing web applications and APIs. How it works In the Managed Connectors portal, create a trigger and select App Service as its destination. Select the web app, callback route, Connector Namespace managed identity, and Microsoft Entra audience. When the source event occurs, Managed Connectors requests a token using the selected managed identity and sends the event to the App Service route. App Service built-in authentication validates the token before the request reaches application code. The application processes the event and can use Managed Connectors actions to continue the workflow. The callback is an ordinary authenticated HTTP request, so the application can use its normal framework, routing, dependency injection, logging, monitoring, and deployment practices. Configure receiving-app authentication The App Service destination configures the Managed Connectors side of the callback. The receiving application must still be configured to trust it. The reference sample uses App Service built-in authentication, also known as Easy Auth, with: A Microsoft Entra application that identifies the receiving application and its audience. A secretless federated credential configuration. The Connector Namespace managed identity pinned as an allowed principal. Authentication required for requests reaching the application. This configuration rejects unauthenticated requests and allows callbacks carrying the expected managed-identity token. The Managed Connectors trigger wizard does not currently create or update the App Service authentication configuration automatically. Try the end-to-end sample The Managed Connectors on Azure App Service email-triage sample demonstrates a complete workflow: An Office 365 Outlook trigger delivers a new email to an ASP.NET Core application on App Service. App Service built-in authentication validates the managed-identity callback. The application classifies the message and enriches the sender through the Office 365 Users connector. Important mail produces a Microsoft Teams triage card. The application flags the source email in Outlook. The repository includes the application, Bicep infrastructure, App Service authentication configuration, Connector Namespace connections, and an Azure Developer CLI deployment flow. We validated the complete workflow end to end: the authenticated callback reached POST /api/webhook , the application processed the event, a Teams card was posted, and the source Outlook message was flagged. Current limitations The capability is configured through the Managed Connectors portal, not the App Service portal. The wizard configures the Managed Connectors trigger but does not configure App Service built-in authentication on the selected web app. The current sample authentication setup requires a Microsoft Entra application, audience configuration, federated credential, and allowed-principal configuration. Depending on the application's Easy Auth configuration, authentication can apply to the whole application rather than only the connector callback route. The reference sample validates one push-trigger scenario; it is not a compatibility statement for every connector and operation. What's next The first-class App Service destination removes the generic callback URL step and provides an App Service-aware trigger experience in Azure Managed Connectors. We are also exploring ways to simplify receiving-side authentication so applications can establish connector-scoped trust without manually assembling the App Service authentication configuration. Try the reference sample and share feedback on the connectors and App Service scenarios you want to use.495Views0likes0CommentsAnnouncing public preview: Markdown for Agents in Azure App Service
Why Markdown for Agents? Web pages often contain scripts, styles, and HTML markup that are useful to browsers but add noise when the content is sent to an AI model. Markdown for Agents removes that extra markup and returns a smaller, text-focused response that is easier for agents to process and can reduce token usage. In internal testing across more than 637,000 pages, converted Markdown responses were 97 percent smaller at the median than the source HTML, with a median conversion time of 2 milliseconds. Results vary based on the page and its content. Public preview availability Markdown for Agents is available in public preview for Windows apps on Azure App Service in all public regions. The app must use an App Service plan in the Basic tier or higher. No additional authentication setup is required for Markdown conversion. Your app's existing authentication, authorization, and network access controls continue to apply. This feature is only supported on Windows App Service at this time. Support for Linux apps will come later this year. Enable Markdown for Agents During the public preview, you can enable the feature through the REST API, ARM/Bicep template, or the Azure CLI using az rest . Dedicated Azure CLI commands and portal support are planned for a future update. Azure CLI with az rest Replace the placeholders with your subscription ID, resource group, and app name: az rest --method patch --url "https://management.azure.com/subscriptions/<SUBSCRIPTION_ID>/resourceGroups/<RESOURCE_GROUP>/providers/Microsoft.Web/sites/<APP_NAME>?api-version=2026-03-15" --headers "Content-Type=application/json" --body '{"properties":{"aiIntegration":{"markdown":{"enabled":true}}}}' Verify the setting: az rest --method get --url "https://management.azure.com/subscriptions/<SUBSCRIPTION_ID>/resourceGroups/<RESOURCE_GROUP>/providers/Microsoft.Web/sites/<APP_NAME>?api-version=2026-03-15" --query "properties.aiIntegration.markdown" To disable the feature, send the same PATCH request with enabled set to false . ARM template Add the following property to your Microsoft.Web/sites resource using API version 2026-03-15 : "properties": { "aiIntegration": { "markdown": { "enabled": true } } } Bicep resource webApp 'Microsoft.Web/sites@2026-03-15' = { name: appName location: location properties: { serverFarmId: appServicePlanResourceId aiIntegration: { markdown: { enabled: true } } } } Request a Markdown response After enabling the feature, request an HTML page from your app with the Accept: text/markdown header: curl -i -H "Accept: text/markdown" "https://<APP_NAME>.azurewebsites.net/" A successfully converted response includes these headers: Content-Type: text/markdown; charset=utf-8 x-markdown-source: easy-markdown The response body contains Markdown generated from the page's HTML. Common content such as headings, paragraphs, links, lists, images, emphasis, and code is preserved, while script and style content is removed. Pages that cannot be safely converted may return their original HTML. Clients should check the Content-Type and x-markdown-source response headers before processing the response as Markdown. What's next Linux support is planned before the feature reaches general availability. We also plan to add dedicated Azure CLI commands and a portal experience in future updates. Share your feedback Try Markdown for Agents with your Windows App Service apps and let us know how it works for your agent scenarios. Share feedback, questions, and feature requests in the comments below.1.3KViews0likes0CommentsWhat the New API Management AI Gateway Tier Changes for App Service-Hosted Agents
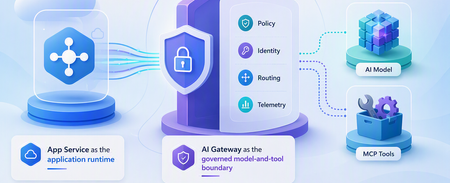
A runnable App Service agent sample that uses the dedicated API Management AI Gateway tier for governed model and MCP tool access, streaming, policy enforcement, identity separation, and telemetry.721Views0likes0CommentsAnnouncing General Availability of Managed Instance on Azure App Service
Today, we are thrilled to announce the General Availability (GA) of Managed Instance on Azure App Service. Following the tremendous response to our Public Preview announcement at Ignite 2025, we've spent the past nine months working closely with customers, partners, and the community to harden the platform, expand capabilities, and validate real-world enterprise migration scenarios. Managed Instance on Azure App Service is now ready for your production workloads, backed by a full enterprise SLA. The journey from Preview to GA Since November 2025, thousands of customers have used the public preview to move workloads that were previously "stuck" on-premises or on aging Windows Server VMs. The feedback has been unmistakable: Managed Instance on Azure App Service dramatically shortens the path to the cloud for legacy and complex .NET Framework applications often removing the need for code changes entirely. Enterprises across various sectors like financial services, healthcare, manufacturing, and the public sector migrated applications that depended on GAC assemblies, COM components, Windows Services, registry configuration, and mapped network drives apps that historically required expensive re-platforming or a full rewrite. With Managed Instance on Azure App Service, these workloads now run on a fully managed PaaS platform, side-by-side with modern cloud-native apps. What's new at GA Building on the preview foundation of configuration scripts, registry adapters, storage mounts, and RDP via Azure Bastion, GA brings several important additions: Production SLA (99.95%) – Full enterprise-grade availability commitment across all supported regions. Expanded regional availability – Available in at least 8 Azure regions worldwide at GA with continued expansion planned through the remainder of 2026. Deeper Premium v4 integration – Managed Instance now takes full advantage of the Premium v4 App Service Plan tier for enhanced performance, memory-optimized SKUs, and improved price-performance. Zone redundancy – Deploy Managed Instance workloads across Availability Zones for higher resiliency without additional configuration effort. Enhanced observability – First-class integration with Azure Monitor, Application Insights, and Log Analytics, including instance-level metrics for CPU, memory and disk. Improved configuration script experience – Faster startup times, richer diagnostics when scripts fail, versioning support for configuration bundles, and streamlined rollback. Managed Identity everywhere – All secrets, storage connections, and Key Vault references at GA use Managed Identity by default, eliminating stored credentials from your deployment pipelines. Azure Policy and Defender for Cloud coverage – Governance, compliance, and threat protection controls now apply to Managed Instance the same way they apply to standard App Service workloads. Bicep, Terraform, and ARM templates – Full IaC support with new resource providers and modules for repeatable, auditable deployments. GitHub Copilot Modernization - Deep Integration with GitHub Copilot modernization for Application assessment targeting Managed Instance on App Service https://learn.microsoft.com/en-us/dotnet/azure/migration/appmod/working-with-assessment Why customers are choosing Managed Instance on Azure App Service The core value proposition remains the same and it's stronger than ever at GA: 1. Lift-and-Improve legacy applications Migrate .NET Framework apps with hardcoded file paths, COM dependencies, GAC entries, or registry access with no major code rewrites. Install custom components directly on the managed instance using configuration scripts. 2. Re-platform hard-to-modernize apps Move applications with lost source code, legacy middleware (MSMQ, SMTP servers, third-party runtimes), or tight infrastructure coupling. Managed Instance removes the blockers that historically forced these apps to stay on VMs. 3. Hybrid and regulated workloads Integrate securely with on-premises resources using VNet integration and private endpoints. Enforce data residency, Bring Your Own Storage, and Managed Identity–backed access controls to meet finance, healthcare, and government compliance requirements. 4. Incremental modernization Start with "lift and Improve" then adopt PaaS features like DevOps automation, autoscaling, deployment slots, and centralized configuration at your own pace. Future-proof your portfolio without a big-bang transformation. What customers are saying During preview, we saw real numbers: Migration timelines cut from months to weeks for apps that would otherwise have required substantial refactoring. Zero code changes for a significant share of preview workloads that previously blocked App Service adoption. Reduced infrastructure footprint as customers consolidated Windows Server VMs onto managed App Service Plans with zone redundancy and autoscaling built in. We are grateful to every preview customer whose feedback shaped this release. Pricing and licensing Managed Instance on Azure App Service is billed as a capability on top of the Premium v4 App Service Plan. There is no separate Managed Instance surcharge at GA you pay for the underlying Premium v4 compute you consume. Existing App Service reservations, savings plans, and any other Azure Benefit all apply, helping you optimize the total cost of ownership as you migrate. Getting started Getting started is straightforward: Assess your workload using Azure Migrate's updated App Service assessment, which now flags candidates ideal for Managed Instance. Create a new Web App using the Managed Instance on Azure App Service option in the Azure Marketplace, or via Bicep, Terraform, or the Azure CLI. Package your dependencies into a configuration bundle (a zip file plus a PowerShell install script) and store it in Azure Storage. Grant access via Managed Identity. Configure registry values, storage mounts, and networking to match your on-premises environment. Deploy your application using the same App Service deployment mechanisms you already know—ZIP deploy, GitHub Actions, Azure DevOps, or Visual Studio publish. Operate with confidence use RDP over Azure Bastion for deep troubleshooting when you need it, and Azure Monitor for everything else. Resources 📘 Managed Instance on Azure App Service documentation 🎥 Technical Deep Dive session recording from Build 2026 🧭 GitHub Repo with sample configuration scripts, webapp and guidance for Managed Instance on App Service workloads Looking ahead GA is a milestone, not a finish line. On our roadmap we're already working on: Deeper integration with Azure Migrate's web app discovery and assessment capabilities to help identify web apps suitable for migration to Managed Instance on App Service Enhanced migration tooling with easier dependency detection and one-click configuration bundle generation. Expanded Rollout to Azure Regions across 2026 and beyond. Continuously Release new features and capabilities to make migrations easier and faster than ever before We can't wait to see what you build and what you migrate. Managed Instance on Azure App Service is here to make your modernization journey faster, simpler, and more secure than ever. Welcome to GA. 🚀 The Azure App Service Team3KViews1like0CommentsGoverning a Risk Operations Agent with the Microsoft Agent Framework Harness and AGT
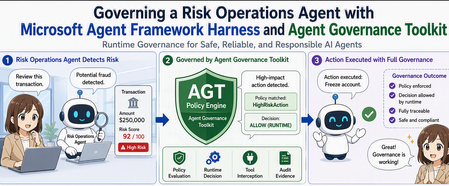
This post walks through combining the Microsoft Agent Framework Harness with the Agent Governance Toolkit (AGT) to build a governed file-access agent. Harness supplies the file_access_* tools (list, read, grep, write, delete, replace); AGT's .WithGovernance() intercepts each tool call and enforces a YAML policy that allows reads but denies writes and deletes — at the execution layer, not just in the prompt. The post covers how Harness assembles a long-running agent from an IChatClient, how context-window compaction works, how to write deny-list vs. allow-list policies, and how to wire governance events into an audit trail. A working .NET 10 sample is included.748Views7likes2CommentsMemory Dump Collection using Procdump.exe for App Service (Windows)
A memory dump is a snapshot of the contents of a computer's volatile memory (RAM) stored for analysis or debugging purposes. ProcDump is a command-line tool designed to monitor applications for CPU/Memory spikes and generate crash dumps when spikes occur. Administrators or developers can then use these dumps to pinpoint the cause of the spikes. This guide will walk you through collecting a memory dump using Procdump.exe for applications hosted on App Service (Windows).6KViews3likes1Comment