artificial intelligence
409 TopicsClosing the AI Agent Governance Gap with Microsoft Foundry
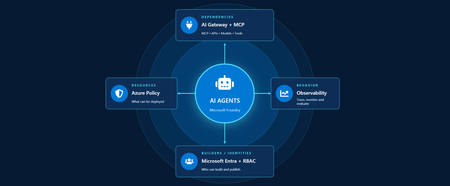
Developers are shipping agents faster than security teams can catalog them. As organizations move beyond pilots and begin operating dozens or hundreds of agents, one question keeps coming up: how do we actually get visibility into our AI agents across our environment? In this article, we'll walk through how Azure services can help establish visibility, guardrails, and cost accountability across your AI estate. Governance for AI happens across four layers: Resources – who can create new AI resources Builders – who can develop and publish agents in a certain scope Behavior – how agent outputs are evaluated, monitored, and governed Dependencies – what models, tools, APIs, and MCP servers agents can interact with Most organizations already have governance controls for identities, networking, and compliance. The challenge isn't creating new controls. It's connecting existing controls into an operating model that works for AI agents. Below we walk through each area and go a bit deeper on how to close the gap. Setting up boundaries with Azure Policy First, let's start in the Azure portal with Azure Policy. Azure Policy lets you set guardrails on what can be deployed in your environment and flags or blocks anything that doesn't comply. For AI workloads, the built-in definitions range from limiting models that people in your organization can deploy to locking down the network through enabling private endpoints. Some policies you get started with: Foundry model deployments should only use approved models: Restricts deployments to models or publishers your organization has explicitly approved Foundry model deployments should meet eligibility requirements (preview): Applies rules based on model attributes like preview vs. GA status and distribution source Azure AI Services resources should have key access disabled: Makes Microsoft Entra ID the only entry point The full list of policies related to Azure AI Services are available here: List of built-in policy definitions - Azure Policy | Microsoft Learn Why this comes first: Policy checks resources before they are created, so it proactively keeps your environment aligned with your standards. Implementing role-based access control (RBAC) Once these boundaries are in place, the next step is RBAC. Setting RBAC up early ensures that people and identities building agents have the right scope for what they actually need to do. Foundry roles only apply when you authenticate using Microsoft Entra ID. If you're using key-based authentication instead, the key grants full access with without role restrictions. API keys are convenient for quick development usage but when moving towards production, Microsoft Entra ID is the preferred method. Roles can be assigned at three scopes: the Foundry resource, a Foundry project, or an individual agent itself. Below is an example of how different personas within organization can map to a certain scope for creating and building agents with Foundry. Here's how each role in the diagram compares, from least to most privileged: Role Privilege Level What it does in Microsoft Foundry Foundry Agent Consumer Least Interact with agent endpoints in a project. This is your least-privilege role for people who only need to use agents. Foundry User Low Grants reader access to the Foundry project, the Foundry resource, and data actions for your Foundry project. Least-privilege access role for developers building and testing agents. Foundry Project Manager Medium This role lets you perform management actions on Foundry projects, build and develop with projects, and conditionally assign the Foundry User role to other user principals. Foundry Account Owner Higher Grants full access to manage Foundry projects and resources, and lets you assign the Foundry User role to other user principals. Foundry Owner Highest Grants full access to manage Foundry projects and resources to build and develop with projects. This role can also assign the Foundry User, ACR, and monitoring roles to users in the environment. Source: Role-based access control for Microsoft Foundry - Microsoft Foundry | Microsoft Learn For the agent resources themselves, assign managed identities rather than API keys since it lowers the risk of having compromised credentials. Note if you're scripting RBAC permissions: these roles were recently renamed from Azure AI User, Azure AI Owner, Azure AI Account Owner, and Azure AI Project Manager. The role IDs and permissions didn't change, so use the role definition GUID in your code to avoid issues while the rename rolls out. Observability in Microsoft Foundry Governance requires more than access control. Organizations also need evidence of how agents are being used. Observability provides the audit trail needed to investigate incidents, understand usage patterns, and track costs. The Foundry Control Plane brings these observability and governance tools together in one place, alongside services like Azure Monitor, Microsoft Entra, Microsoft Purview, and Azure Policy. In the Foundry portal, tracing is a good starting point. Once you connect an Application Insights resource to your project, Foundry turns on tracing automatically so every run, including the ones you test in the playground, is logged. After it is completed, you can search by Response ID or Trace ID to see the conversation history, token usage, run steps, tool calls, and inputs and outputs between the user and the agent. For more granular queries, you can write KQL to dive into individual agent runs or use the prebuilt Grafana dashboards in Azure Monitor. With client-side tracing, you can also export traces to observability tools you may already use, such as Datadog or Jaeger. Note: Permissions required for viewing this telemetry requires the Log Analytics Reader role on the connected Application Insights resource, and Privileged Monitoring Data Reader on top of that if the underlying Log Analytics tables are protected. Alongside all of these monitoring features, every agent comes with content safety guardrails and evaluations let you test and optimize performance before and after you publish your agents. When agents get published to Microsoft Teams and Microsoft 365 Copilot, Microsoft 365 admins can approve usage requests. These requests can be further scoped to a limited group for pilot testing/department usage or the full organization. Adding an AI gateway Observability tells you what your agents are doing, but how do you actually control them? This is where Azure API Management comes in. Once you have more than one agent, model deployment, or multiple teams consuming them, you need a single enforcement point between the agents and the resources they call. Adding Azure API Management in front of Microsoft Foundry gives you: Rate limiting and load balancing across regions and model deployments Consistent authentication and quota policies for model and tool traffic Usage tracking per team or cost center so you can accurately charge back to different departments Governed access to your custom and remote MCP servers Note: When choosing MCP servers, start with trusted, enterprise supported sources (GitHub, Microsoft, internally developed servers, etc.) that have documented security controls, enterprise authentication, clear ownership, and least-privilege permissions. Treat community MCP servers as untrusted until they have undergone a formal security review and are verified by organizations. Adding an AI gateway completes the governance picture. Azure Policy governs what can be deployed. RBAC governs who can build and manage agents. Observability provides evidence of how agents behave in production. The AI gateway extends governance into runtime, controlling how agents interact with models, tools, and external systems. Combined, these layers help organizations move beyond simply building agents to operating them responsibly at scale. Extend governance across the wider estate A few directions to take this further: MCP registry in Azure API Center – As MCP usage grows, you can create an approved inventory of MCP servers and APIs that can be used across an organization. Microsoft Agent 365 – Microsoft's enterprise control plane for AI agents. It gives every agent its own Microsoft Entra Agent ID and published Foundry agents sync to its registry automatically. This gives your IT team one place to run access reviews, lifecycle policies, and owner attestation across every agent in the tenant, including shadow agents discovered outside Foundry. Copilot Studio – when you add an MCP tool, you can point it at the API Management URL instead of the direct remote endpoint to gain additional observability through the gateway. GitHub Copilot – you can apply the same AI gateway-fronted MCP registry, applied to the developer side. Microsoft Purview – data classification, DLP, audit, and AI interaction governance across the wider estate. Where to go next Looking for a quick start? Turn on the three Azure Policy definitions above in audit mode against a non-production subscription and see what gets flagged that is out of compliance. Ready to design the end-to-end pattern? Take a look at this Cloud Adoption Framework guidance on AI governance and governing Azure platform services for AI. Want to go deeper on agent observability? Start with these articles around Application Insights integrations with Foundry: Use Insights in Microsoft Foundry and Monitor AI Agents with Application Insights Governing AI agents doesn't require starting from scratch. The identity, policy, monitoring, and cost controls you already use for the rest of your Azure estate can extend to AI workloads. Start with one layer, connect the next, and build a governance foundation that grows with your AI adoption.234Views2likes0CommentsResource Guide: Making Physical AI Practical for Real‑World Industrial Operations
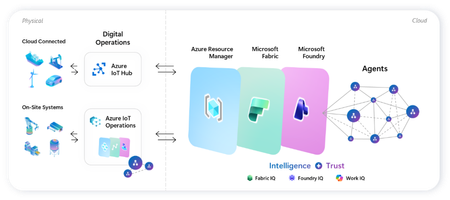
Microsoft's adaptive cloud approach brings cloud, edge, data, and AI together to help organizations turn operational technology (OT) data into intelligent action, without requiring everything to live in the cloud. At the center of this approach are key technologies that connect physical operations to cloud-scale data, analytics, and AI: Key Purpose Offering Direct-to-cloud device management + telemetry ingestion Azure IoT Hub Industrial connectivity + edge data plane Azure IoT Operations Unified analytics + real-time intelligence Microsoft Fabric On-device AI inferencing runtime Microsoft Foundry Industry recognition Microsoft named a Leader in the 2026 Gartner® Magic Quadrant™ for Global Industrial AIoT Platforms Read the announcement See it all come together Before diving into each component, watch this end-to-end demo showing how Azure IoT Operations, Azure IoT Hub, Microsoft Fabric, and Foundry Local work as one stack across the edge-to-cloud lifecycle - Making industrial AI practical for real-world operations with adaptive cloud. How these components work together Azure IoT Operations and Azure IoT Hub collect real-time data from operational assets and send semantically-ready, modeled data to Microsoft Fabric, where it's contextualized with enterprise data for downstream analytics. Microsoft Foundry extends to the edge through Foundry Local, so the same tooling used to deploy and manage AI models in the cloud applies to edge use cases. All of it integrates into Azure Resource Manager, bringing OT devices, assets, and edge AI models into the same management and security paradigm as every other Azure-managed resource. This blog walks through where to get started with each product capability: 1. Manage Cloud-Connected Devices and Telemetry with Azure IoT Hub Azure IoT Hub is a fully managed cloud service that enables secure bidirectional communication, device-to-cloud telemetry ingestion, cloud-to-device command execution, per-device authentication, remote management and more. Telemetry from IoT Hub can also be routed downstream into analytics platforms like Microsoft Fabric for visualization or AI modeling. Recommended Usage: Devices that utilize IoT Hub are distributed, stand-alone devices with fixed-functions. These devices typically do not require cloud-managed containerized workloads or cloud-managed proximal industrial protocol connectivity. Examples of appropriate device-to-cloud IoT Hub endpoint devices include water monitoring stations, vehicle telematics, distributed fluid level sensors, etc. Resources Current in-market services overview: IoT Hub: What is Azure IoT Hub? - Azure IoT Hub DPS: Overview of Azure IoT Hub Device Provisioning Service - Azure IoT Hub Device Provisioning Service ADU: Introduction to Device Update for Azure IoT Hub Building scalable solutions with Azure IoT platform: Best practices for large-scale IoT deployments - Azure IoT Hub Device Provisioning Service Scale Out an Azure IoT Hub-based Solution to Support Millions of Devices - Azure Architecture Center Azure IoT Hub scaling Try out our preview of new IoT Hub capabilities (integration with Azure Device Registry and Certificate Management) Learn more about these capabilities on our blog post: Azure IoT Hub + Azure Device Registry (Preview Refresh): Device Trust and Management at Fleet Scale… Integration with Azure Device Registry (preview): Integration with Azure Device Registry (preview) - Azure IoT Hub Microsoft-backed X.509 certificate management (preview): What is Microsoft-backed X.509 Certificate Management (Preview)? - Azure IoT Hub How to start with the preview: Deploy IoT Hub with ADR integration and certificate management (Preview) - Azure IoT Hub 2. Connect Industrial Assets with Azure IoT Operations Azure IoT Operations provides a unified data plane for the edge that runs on Azure Arc–enabled Kubernetes clusters and supports open industrial standards. It allows organizations to connect and capture equipment telemetry, normalize OT data locally, route hot-path signals to real-time analytics, securely manage layered industrial networks, and more. Edge‑processed data can then be sent upstream to Microsoft Fabric for AI‑driven analysis. Recommended Usage: Azure IoT Operations is intended to be the data plane for an adaptive cloud deployment extending the management, data, and AI capabilities of the Microsoft cloud to an on-prem device. This device binds to these cloud planes providing a platform for local data processing and intermittent connectivity. The target for these devices range from a small-gateway-style PC to a full data center. Azure IoT Operations endpoints enable cloud-managed containerized workloads and cloud-managed proximal industrial protocol connectivity. Examples of appropriate adaptive cloud and Azure IoT Operations endpoints include, on-robot computers, industrial machine controllers, retail store sensor/vision processing, and top-of-factory site infrastructure for line of business applications. Resources Azure IoT Operations Overview Azure IoT Operations Documentation Hub Releases · Azure/azure-iot-operations Quickstart: explore-iot-operations/quickstart at main · Azure-Samples/explore-iot-operations Latest release update: Open-source framework for scaling robotics from simulation to production on Azure + NVIDIA: microsoft/physical-ai-toolchain Demo video showcasing this in action: Making industrial AI practical for real-world operations with adaptive cloud How we built the demo: explore-iot-operations/quickstart at main · Azure-Samples/explore-iot-operations Edge-AI: microsoft/edge-ai: Production-ready Infrastructure as Code, applications, pluggable components, and… Latest Announcements & Blogs Making Physical AI Practical for Real-World Industrial Operations: Part 1 | Microsoft Community Hub Making Physical AI Practical for Real-World Industrial Operations: Part 2 | Microsoft Community Hub Introducing small form factor infrastructure: embed intelligence into physical systems Unlock Industrial Intelligence | Microsoft Hannover Messe 2026 From pilots to production: How Microsoft and partners are accelerating intelligent operations Partner Solutions How Mesh Systems Builds on Azure IoT Hub and Azure IoT Operations to Accelerate Industrial AI | Microsoft Community Hub Unlocking the Human Telemetry Layer for Safer Industrial Operations | Microsoft Community Hub Unlocking Smart Manufacturing: Siemens Industrial Edge Meets Azure IoT Operations Solving the Data Challenge for Manufacturers with Sight Machine & Azure IoT Operations | Microsoft Community Hub Microsoft and Rockwell Automation: Transforming Industrial AI Together | Microsoft Community Hub 3. Advanced Analytics with Microsoft Fabric Microsoft Fabric delivers a unified, end‑to‑end analytics platform that transforms streaming OT telemetry into real‑time insights and live dashboards. Fabric Operations Agents monitor industrial signals to recommend targeted actions, while Fabric IQ provides a shared semantic foundation that enables AI agents to reason over enterprise data with business context. Together, Fabric turns live industrial data into AI‑powered operational intelligence. Resources Get Started with Microsoft Fabric Learning Path Fabric Real-Time Intelligence documentation - Microsoft Fabric | Microsoft Learn Create and Configure Operations Agents - Microsoft Fabric | Microsoft Learn Fabric IQ documentation - Microsoft Fabric | Microsoft Learn 4.Run AI Models On‑Device with Foundry Local Foundry Local extends on‑device AI to Arc‑enabled Kubernetes edge clusters, providing a Microsoft‑validated inferencing layer for running AI models in industrial, disconnected or sovereign environments. Resources Foundry Local on Azure Local Documentation Participate in Foundry Local on Azure Local preview form Foundry Local on Azure Local: HELM deployment Demo Customer Stories Chevron: Chevron plans facilities of the future with Azure IoT Operations Husqvarna: Husqvarna Group Boosts Operational Efficiency with Azure Adaptive Cloud Ecopetrol: Azure IoT Operations and Azure IoT for energy help Ecopetrol optimize energy distribution while lowering operational costs P&G: Procter & Gamble cuts model deployment time up to 90% with Azure IoT Operations Toyota: Toyota Industries innovates its paint shop processes with Azure industrial AI and Azure IoT Hub1.3KViews3likes0Comments
Your Agents Need More Than a Place to Run
In architecture reviews with enterprise teams moving their first agentic applications toward production, I often hear the same plan: the team has containerized their agent and intends to run it on the managed Kubernetes cluster the organization already trusts. The reasoning is sensible, since the platform team knows the tooling and security has approved the network model, and for the first use case or two it is often the right call. Having watched this unfold in my years leading AgenticAI customer engineers and forward deployed engineers, and now helping customers reach production on Azure, I want to describe what happens next, before leaders commit rather than after. One thing to note is Azure supports multiple ways to build and operate agents. Foundry Agent Service provides an integrated managed runtime around your agent code. Azure Kubernetes Service supports teams that need Kubernetes-level control or want to extend an established platform, while Azure Container Apps provides managed container hosting. These services can work together. The decision is which capabilities and responsibilities best fit the workload. Where the cluster is the right answer A stateless retrieval application, a document extraction pipeline, or a classification job is a web service that happens to call a model, and a container platform runs web services well. A large retail customer of mine ran an invoice extraction agent on containers for over a year with almost no issues, and I never suggested they move it. The cluster remains the right home for several other situations as well. LLM invocations embedded inside existing microservices, event driven, or batch pipelines fit container platforms naturally. Genuine constraints such as air-gapped or sovereign environment, regions where a managed service is not yet offered are a good reason to run your own stack, and strong engineering team that already operates at that level can be a real asset. Even when the agents themselves move to a managed runtime, the tool servers, business APIs, and data services those agents call, often stay on your cluster, so they are complementary far more often than they are competitors. The problem is that these early wins can make agents seem like just another workload. Where the wheels come off The first failure is the state. A research agent that plans, searches, and synthesizes for ninety minutes is a long-running stateful process, while a Kubernetes pod is a disposable container the scheduler may restart at any time. A financial services team I worked with lost costly research run to a routine node upgrade, and responded as capable engineers do by building checkpointing, a durable store, and a resume mechanism. It worked, but they now owned a piece of infrastructure they had to keep correct as their agent's framework changed beneath it. A managed agent runtime absorbs this. Hosted agents in Foundry Agent Service, as one example, give every session a VM-isolated sandbox with a persistent file system, a durable state store that survives crashes and restarts and can hold checkpoints for frameworks such as LangGraph or Microsoft Agent Framework, and a resilient execution mode that recovers long-running work after a process interruption. The second is the human-in-the-loop. A commercial insurance customer’s claims agent needed sign-off from an adjuster and sometimes a second reviewer, with days between steps. Stopping an agent cleanly at the moment it needs a decision, holding its full session for four days without paying to keep it running, and resuming it correctly when the approval arrives is not something a container orchestrator gives out the box. The team built agent session suspend and resume, a queue, a durable state store, notifications, and an approval interface, and ended up with a small workflow engine nobody had planned to own. In hosted agents, an idle session is deprovisioned with its state persisted and restored onto fresh compute when the same session ID returns, so an agent waiting on an approval cost nothing while it waits, and sessions are retained for up to thirty days of inactivity. The approval experience remains yours to design, which is where your engineers' time should go. The third is multi-turn conversation, which quietly pushes teams into building their own context management system. The first version appends each turn to history, and within few turns the history outgrows the context window while cost and latency climb. So, the team adds truncation, then summarization, then retrieval of earlier turns, then per-user and per-tenant scoping, then expiry and deletion rules for privacy. An industrial customer's safety compliance assistant, with conversations stretching across days, followed exactly this path and ended up with a bespoke thread store and summarization pipeline nobody had budgeted for. Its first serious incident came when a summary silently dropped a compliance-relevant instruction. With the Responses protocol in hosted agents in Foundry, conversation history is a durable, platform-managed record keyed by a conversation ID and reachable from any channel, so the thread store is no longer yours to build, although deciding what to summarize or retrieve remains a design choice for your agent. The fourth is identity. On a cluster, the path of least resistance is a shared service account, and in one review a security architect asked which actions had been taken on behalf of which user, only to learn that the logs could not say. Hosted agents create a dedicated Microsoft Entra agent identity for each agent at deploy time, use on-behalf-of flows to act with the user's delegated permissions in interactive scenarios and the agent's own identity in autonomous ones, and keep the agent identifiable for audit in both cases. The fifth is per-user session isolation, which is the difference between an agent that serves many people and an agent that mixes them up. Agents read files, run code, and hold working data, and on a shared pod the default is that many users share a process, a file system, and often a cache. Giving every user session its own sandboxed environment and storage, so that one person's documents and intermediate results can never surface in another's, means engineering hard isolation boundaries and proving them to your security team. Hosted agents make a VM-isolated sandbox per session the default, and their durable state store can partition items per end user, so one store is safe to share across the users of a multitenant agent. And lastly, Evaluation and optimization are where the gap widens. The largest difference between teams that scale and those that stall is evaluation. Because agents are probabilistic and multi-step, staging tests often miss failures such as a wrong tool choice or a policy violation deep in a task. One customer’s agent passed every offline check but degraded unnoticed for weeks after a model update because evaluation stopped at release. Mature teams continuously evaluate production traces, combine automated judges with sampled human review, and red-team regularly.Once quality is measurable, teams can deliberately balance prompts, models, tools, latency, and cost. One team cut per-task cost by routing simple steps to smaller models after evaluation confirmed quality held. Self-built stacks require teams to assemble and maintain tracing, datasets, judges, and release gates. Hosted agents instead combines default OpenTelemetry traces with continuous evaluation, adversarial testing, and datasets generated from agent instructions. Staged closed-loop optimization uses those traces to improve instructions, tool descriptions, and model selection without extra plumbing. The real cost is the velocity gap Leaders usually expect me to quantify the initial build, and that is the smaller number. A team of four building the first agent often becomes ten or twelve within a year, and a growing share of them are maintaining a runtime for agents rather than building agents that serve the business. The enterprise has quietly created an internal agent infrastructure company in a field where the patterns for memory, tools, evaluation, and safety are rewritten every few months, while hyperscalers put hundreds of engineers on exactly this problem and ship at a cadence no single platform group can match. Foundry Agent Service, for instance, bundle content safety guardrails into the runtime and route outbound traffic through a customer virtual network, capabilities that platform teams otherwise assemble one integration at a time. This plumbing does not differentiate your organization, so the question is whether your scarcest engineers should spend years on it or on the workflows, data, and judgment only your company has. This is also why the technology companies held up as examples are a poor template. Many built their own runtimes because managed options did not yet exist and had large platform organizations to carry the load. Even they tend to invest in a custom runtime for the first handful of use cases and then migrate as managed services mature, because the maintenance burden compounds while the strategic value of owning the plumbing does not. What I would do as the leader I am not arguing against Kubernetes or for moving everything tomorrow. Comparable managed runtimes exist across the hyperscalers, and I use hosted agents as the running example only because it is the one I know best from the inside. Managed agent services are still maturing, some workloads have real data residency or customization needs, and abstraction always constrains something. What I am arguing for is a deliberate choice for each use case, guided by three questions: whether the agent must outlive a single request by running long, waiting on humans, or remembering across sessions whether it must act with its own identity, auditable delegation, and policy enforcement whether your team would be building anything a managed service already provides, and who will still maintain it in two years. Key takeaways Match the runtime to the workload. Containers on your existing cluster suit stateless, short-lived agents, while long-running, human-in-the-loop, and memory-dependent agents need capabilities your platform team was never hired to build. Count the hidden team. The real cost of self-hosting is the growing group of engineers maintaining state, identity, memory, guardrails, and tracing instead of solving business problems. Make evaluation continuous and connected to production traces. Pre-release testing alone will miss the drift and trajectory failures that hurt you, and optimization of quality, cost, and latency depends on that evaluation data. Follow the pattern of the leaders, not their early architecture. Companies that built custom runtimes did so before managed options matured, and most of them move toward managed services as those options improve. A practical place to begin is your roadmap for the next twelve months. Sort each use case into stateless and short-lived or long-running and human-dependent, and for every agent in the second group put a price on the engineers who would maintain the runtime rather than the business logic. I would like to hear how you have drawn this line, and where a managed service was not yet ready for something you needed.511Views2likes0CommentsIntroducing GPT-6.1 Sol in Microsoft Foundry: Advanced intelligence, optimized for production agents
Today, OpenAI's GPT-6.1 Sol is generally available in Microsoft Foundry. GPT-6.1 Sol is an upgrade to GPT-6 Sol, delivering substantial improvements in agentic coding, computer use, and professional work, with performance approaching GPT-6 Astra across these evaluations. It offers a new balance of capability and cost for important work at higher frequency, making it more affordable for developers to build and run very capable agents at scale. Just one week after GPT-6 Sol and Luna joined our generally available lineup, this release continues the momentum of the GPT-6 series in Foundry: models that produce less noise and are more capable of completing full tasks with agents. GPT-6.1 Sol carries that progress forward for teams whose production workloads run all day, every day. What's new in GPT-6.1 Sol GPT-6.1 Sol advances the three capabilities that matter most for production agents: Agentic coding. GPT-6.1 Sol plans, edits, tests, and iterates across a codebase with improved performance on complex tasks and extended workflows involving multiple tool calls. More capable computer use. Improved reliability navigating real interfaces help agents operate the workflows that span multiple application steps, with permissions and human oversight suited to the task. Deeper Professional work. Stronger performance on the analysis, drafting, and multi-step knowledge tasks that make up daily enterprise work, with improvements in factual accuracy those workflows demand. GPT-6.1 Sol accepts text and image inputs and produces text, with a total context window of up to 1M tokens. This provides room to bring large codebases and document sets, within the model’s context limits. Flexible reasoning lets teams tailor the model’s depth of analysis to the needs of each task. This can help teams use tokens more efficiently by reserving deeper reasoning for the work that needs it. As in last Tuesday's announcement, the starting point is quality alongside cost per task, not model capability in isolation. Use that lens to evaluate GPT-6.1 Sol against the needs of your own production workloads. Where to put GPT-6.1 Sol to work Because these gains compound in agentic loops, valuable use cases include agent workloads that run frequently: Software engineering agents that triage issues, implement changes across a repository, respond to code review, and keep CI green, with costs that support running them on every pull request, not just the hard ones. Computer-use agents that complete back-office processes end to end: updating records across line-of-business systems, reconciling data between applications, and handling workflows in browsers. Professional work agents for research synthesis, contract and document review, financial analysis, and report generation, where work recurs weekly or daily and rewards consistent quality per task. High-frequency customer and employee workflows, where GPT-6.1 Sol's capability-cost balance lets teams upgrade the intelligence behind every interaction without upgrading the budget. The right intelligence behind every agent The right model for a job should be determined through evaluations. GPT-6.1 Sol joins GPT-6 Astra, GPT-6 Sol, and GPT-6 Luna in the Foundry model catalog: start with GPT-6 Astra for the most demanding reasoning, use GPT-6.1 Sol as the new default for production agents and complex workflows, and scale high-volume data and preparatory tasks with Luna. As with the rest of the GPT-6 series, look beyond price per token to cost per task, alongside quality and reliability. Foundry brings evaluation, tracing, and monitoring together so teams can make that call with evidence, then switch models without re-platforming. Deploy it your way With GPT-6.1 Sol in Microsoft Foundry, teams can choose how they scale and where processing takes place. Standard deployment offers flexible capacity billed by usage across Global regions and US, EU, and APAC Data Zones. Provisioned Throughput is available at launch through Global and US Data Zone deployments, providing reserved capacity for critical production workloads. Additional regions and deployment options will follow soon. That is the Foundry advantage: the flexibility to balance capacity, performance, and data residency requirements within one enterprise platform. Teams can match each workload to a supported combination of serving option and processing location, rather than apply the same deployment approach to every application. GPT-6.1 Sol Pricing* Model Deployment Context Length Pricing (USD $/million tokens) Input Cached Input Cached Writes Output GPT-6.1 Sol Global Standard Short context $2.00 $0.10 $2.50 $10.00 Long context $4.00 $0.20 $5.00 $15.00 Data Zone Standard (US) Short context $2.20 $0.11 $2.75 $11.00 Long context $4.40 $0.22 $5.50 $16.50 Data Zone Standard (EU) Short context $2.40 $0.12 $3.00 $12.00 Long context $4.80 $0.24 $6.00 $18.00 Data Zone Standard (APAC) Short context $2.40 $0.12 $3.00 $12.00 Long context $4.80 $0.24 $6.00 $18.00 *Prices shown are for Standard deployments. Provisioned Throughput pricing varies by deployment type. For each offer, the US Data Zone is priced at a 10% premium to Global, and the EU and APAC Data Zones are priced at a 20% premium to Global. For current rates and terms, see the Azure OpenAI pricing page., see the Azure OpenAI pricing page. Build safer agents on Foundry GPT-6.1 Sol runs with the same layered protections as the GPT-6 series in Foundry: alignment training in the model, content filters and guardrails on prompts and outputs, prompt injection mitigations on tool calls and responses, and enterprise identity and access controls governing what agents can reach. Microsoft Purview applies data policies and human checkpoints at every phase. Start building Your next agent needs more than a powerful model. Foundry pairs GPT-6.1 Sol with the deployment flexibility, observability, and enterprise controls to take it from first workload to production at scale. Explore GPT-6.1 Sol in the Microsoft Foundry model catalog and evaluate where it fits in your next agent.4.7KViews1like0Comments
From Prompt to Production: Building Azure Architecture Diagrams with AI
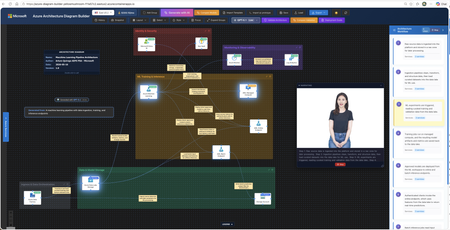
Author: Arturo Quiroga, Senior Partner Solutions Architect — Microsoft Cloud architects spend significant time translating ideas into architecture diagrams. They toggle between Visio, draw.io, pricing calculators, and documentation. According to the 2024 Stack Overflow Developer Survey, 61% of developers spend more than 30 minutes a day searching for answers or solutions, time lost to context-switching rather than design. What if you could describe your architecture in plain English and get a diagram, cost estimate, and deployment guide in minutes? The Challenge: Fragmented Architecture Workflows Designing Azure architectures today typically involves multiple disconnected steps: Sketch the architecture in a diagramming tool Look up official Azure icons and drag them into place Research pricing across regions using the Azure Pricing Calculator Validate the design against the Well-Architected Framework (WAF) Write deployment documentation and Infrastructure as Code templates Compare alternative designs manually Each step lives in a different tool, and keeping them in sync as designs evolve is costly. The Azure Architecture Diagram Builder brings these workflows together in a single browser-based experience. How It Works Describe your architecture in natural language, for example "A HIPAA-compliant healthcare platform with FHIR APIs, event-driven processing, and multi-region disaster recovery", and the AI generates a diagram with grouped services, data flow connections, and logical organization. Figure 1. Enter a natural-language prompt describing your architecture. Curated example prompts help you get started, and you can optionally upload an existing diagram for the AI to analyze. The tool uses Azure OpenAI to power generation across multiple models, enabling you to choose the model that best fits your scenario — from fast iterations to deeper reasoning. Key Features AI-Powered Architecture Generation Describe what you need in plain English, and the AI creates an architecture diagram with: 714 official Azure service icons across 29 categories Smart grouping: services are logically organized (Frontend, Backend, Data, Security) Data flow connections: labeled edges showing how data moves through the system 13 curated example prompts: from simple web apps to complex enterprise scenarios like Zero Trust networks, Industrial IoT with 5,000+ sensors, and global multiplayer gaming backends Figure 2. A generated industrial IoT architecture. Top: the clean diagram view as initially produced. Bottom: the same diagram with per-service monthly cost overlays toggled on, plus a running subscription total in the toolbar. Architecture Image Import Already have an architecture on a whiteboard or in a screenshot? Upload the image and let the AI analyze it, mapping services to official Azure icons and recreating the architecture as an editable, interactive diagram. Figure 3. Upload a photo of a whiteboard sketch (top-right reference panel) and the AI recreates it as an editable diagram with official Azure service icons and labeled data flow connections. ARM Template Import Import existing ARM templates to visualize your current infrastructure. The AI parses resource definitions and dependencies, groups related resources into logical layers, and produces a meaningful diagram of what you actually have deployed — a fast way to document an inherited environment or sanity-check a template before deployment. Figure 4. ARM template import in action. Top: the parser status banner while resources and dependencies are being analyzed. Bottom: the resulting diagram, with resources auto-grouped into logical layers (Web Tier, Data Layer, Container Platform, Observability & Logging) and a Generated from: ARM Template badge linking the diagram back to its source file. Well-Architected Framework Validation Validate your architecture against all five WAF pillars — Security, Reliability, Performance Efficiency, Cost Optimization, and Operational Excellence. The validator provides: An overall WAF score with pillar-level breakdowns Specific findings with severity levels Actionable recommendations you can select and apply Select the recommendations you agree with, and the AI regenerates an improved architecture incorporating those changes. Figure 5. WAF validation results showing the overall score, per-pillar breakdowns, and individual findings with severity badges. Tick the recommendations you want and the AI rebuilds the diagram with those changes applied. Multi-Model Comparison Run the same architecture prompt through multiple AI models side-by-side and compare: Architecture Comparison: service counts, connection counts, groups, token usage, and latency Validation Comparison: WAF scores across models, severity breakdowns, and finding counts Apply Winner: pick the best result and apply it to the canvas with one click Present Critique: a talking avatar narrates the AI-generated ranking with live closed captions Figure 6. Multi-model comparison. Top: select the models and reasoning effort, then enter the prompt. Bottom: side-by-side results across all selected models with service counts, latency, token usage, and Fastest / Cheapest / Most Thorough badges. Multi-Region Cost Estimation Get cost estimates from the Azure Retail Prices API across 8 Azure regions: East US 2, Australia East, Canada Central, Brazil South, Mexico Central, West Europe, Sweden Central, and Southeast Asia. Features include: Color-coded cost legend (green / yellow / red thresholds) SKU and tier information for each service Export options: CSV, JSON, plain-text summary, and an analysis report with top cost drivers, Reserved Instance flags, and a ranked multi-region comparison table Figure 7. The cost legend overlay shows per-service pricing with color-coded thresholds. The region selector in the toolbar lets you re-price the entire architecture in any of eight Azure regions. Deployment Guide Generation with Bicep Generate step-by-step deployment documentation including: Prerequisites and Azure resource requirements Step-by-step deployment instructions Bicep templates for each service (Infrastructure as Code) Post-deployment verification steps Security configuration recommendations Figure 8. Each generated Deployment Guide opens with the architecture name, an estimated deployment time, and a prerequisites checklist covering subscription roles, CLI versions, Microsoft Entra ID permissions, and region requirements, followed by numbered, copy-ready deployment steps. Figure 9. The Infrastructure as Code section produces a main.bicep orchestrator plus a per-service module (Log Analytics, Key Vault, Cosmos DB, SQL Database, Event Hubs, Azure Functions, and more). The Download All Templates button packages everything into a ready-to-deploy folder. Workflow Animation & Avatar Presenter Visualize how data flows through your architecture with step-by-step animations that highlight services on the canvas as each step plays. When the Azure Speech Service is configured, a photorealistic talking avatar can narrate the workflow or present model comparison results, with live word-by-word closed captions in a draggable, resizable panel. Figure 10. A workflow step is highlighted on the canvas as the Avatar Presenter narrates that step. Live word-by-word closed captions appear in a draggable, resizable panel, useful for accessibility and stakeholder demos. Export Options Figure 11. A single-slide PowerPoint export, available in dark or light theme, ready to drop straight into a stakeholder deck. Format Use Case PNG Documentation, presentations SVG Scalable vector graphics PPTX Single PowerPoint slide (dark or light theme) Draw.io Edit in diagrams.net JSON Backup, version control CSV / ZIP Cost analysis with multi-region comparison Highlights The Azure Architecture Diagram Builder unifies the architecture design lifecycle in a single tool: End-to-end workflow: from natural-language description to deployable Bicep templates without tool switching Official Azure icons: 714 icons across 29 categories, mapped directly from the Azure service catalog Live pricing: queries the Azure Retail Prices API at design time rather than relying on static estimates WAF-integrated validation: architectural best practices built into the design loop rather than applied after the fact Multi-model flexibility: choose the AI model that best suits each task, with fast models for iteration and reasoning models for complex designs Open source: the source code is available for customization and contribution One-Command Deploy with Azure Developer CLI The fastest way to get your own instance running is with azd : # Install azd (once) brew tap azure/azd && brew install azd # macOS winget install microsoft.azd # Windows # Clone, configure, and deploy git clone https://github.com/Arturo-Quiroga-MSFT/azure-architecture-diagram-builder cd azure-architecture-diagram-builder azd auth login azd env set AZURE_OPENAI_ENDPOINT "https://your-resource.openai.azure.com/" azd env set AZURE_OPENAI_API_KEY "your-key" azd up # Provisions infrastructure + builds + deploys (~8 min) azd up provisions the following via Bicep: Resource Purpose Azure Container Registry Stores the Docker image Azure Container Apps Runs the app (nginx + token server) Log Analytics + Application Insights Monitoring and telemetry Azure Speech (S0) Avatar Presenter (optional, keyless auth via managed identity) Try It Today The Azure Architecture Diagram Builder is available now: Live demo: https://aka.ms/diagram-builder Source code: GitHub repository Documentation: See the Getting Started Guide for detailed setup instructions We welcome feedback and contributions. Use the GitHub Issues page to report bugs, suggest features, or share your experience. Tags: artificial intelligence · application · apps & devops · well architected · infrastructure5.5KViews3likes4CommentsFrom Features to Flow: How Real-World Adoption Reshaped the Azure Architecture Diagram Builder
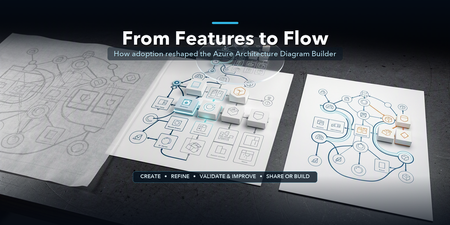
In May, I introduced the open-source Azure Architecture Diagram Builder as a way to move from a natural-language prompt to an Azure architecture diagram, cost estimate, Well-Architected assessment, and deployment guidance. In July, I shared how the project had become agent-ready through Model Context Protocol (MCP). Those posts described what the tool could do. The more interesting story came next: what happened when people actually used it. As adoption grew, the central product question changed. It was no longer simply, Can AI generate an Azure architecture? It became: How do we help an architect choose how to begin, improve a result without losing their work, validate it responsibly, and turn it into something another person can use? That question reshaped the Azure Architecture Diagram Builder from a collection of capabilities into a guided workflow: Create → Refine → Validate & Improve → Share or Build This post explains what we learned, what changed in the product, and why the hardest part of AI-assisted architecture is not the first diagram. It is everything that comes after it. TL;DR. Growing adoption created a feedback loop. Aggregate usage showed that people moved beyond generation into validation, recommendations, exports, and deployment guidance. Privacy-safe feedback revealed recurring problems with diagram integrity, preservation of human edits, cost credibility, export quality, and validation continuity. Those signals led to a four-stage architecture journey that keeps human judgment and professional review at the center. The same lesson now shapes agent access and the next product boundary: distinguish logical proposals from evidence-backed physical architecture. Adoption created a product feedback loop As of August 5, 2026, the first two Azure Architecture Blog articles had accumulated approximately 12,100 combined views. A refreshed view of deduplicated application telemetry through August 13 recorded: Activity Aggregate count Architecture generation and refinement events 5,023 Well-Architected validations 960 Recommendations applied 175 Diagram exports 2,020 Deployment guides generated 212 As of August 13, the public repository had reached 45 stars and 14 forks. In GitHub’s current rolling 14-day window, the repository recorded 277 unique visitors and 67 unique cloners. These numbers measure different things and should not be added together. Article views are not unique readers. Application activity uses anonymous telemetry identifiers, not verified people. GitHub traffic is a rolling aggregate window. The signals are useful because of the pattern they reveal, not because they can be combined into one headline user count. Activity also accelerated during the period following the second article. Compared with the May 19–July 9 baseline, daily activity from July 10 through August 13 was approximately 7.0 times higher for architecture generation and refinement, 5.6 times higher for Well-Architected validation, and 5.9 times higher for recommendation application. The timing coincided with publication; it does not prove that the article alone caused the growth. The important product lesson was simpler: people were not stopping after the first diagram. They were testing alternatives, validating designs, applying recommendations, exporting artifacts, and asking how to move toward implementation. Generation was the entry point, not the complete job. The first guided-journey signals reinforce the need for more than one starting path. Through August 13, the new journey instrumentation recorded 880 interactions from 174 anonymous identifiers across 241 sessions. At first start, structured brief/image generation and Guided Chat were selected at almost the same frequency (158 and 156 events), while template and live-Azure import added another 68 selections. These are interaction counts, not unique people or conversion rates, and the window is still too early to claim that the journey improves completion. They are enough to show that architecture work does not begin in one uniform way. In-product Start Here panel showing the four-stage Azure Architecture Diagram Builder journey: Create, Refine, Validate and Improve, and Share or Build. Figure 1. The in-product Start Here panel explains one complete architecture loop. The stages are recommendations, not gates, and direct access to every tool remains available. Stage 1: Create — make the starting choice explicit As capabilities accumulated, the first screen became harder to interpret. Architecture Chat and structured generation were both useful, but they competed for attention. Importing an existing architecture was available, yet easy to miss. The new starting experience makes three paths explicit: Starting path Best suited for Guided Chat Exploring requirements conversationally and refining them over multiple turns Generate Diagram Providing a structured brief or image and producing a first architecture quickly Import Existing Opening an existing architecture or infrastructure artifact for analysis and editing This is not a marketing landing page placed in front of the tool. It is a small decision point inside the authoring experience. Once a path is selected, the user lands on the real canvas. The distinction matters because different architecture tasks begin with different levels of certainty. Sometimes the architect knows the target services. Sometimes the problem needs discovery. Sometimes the architecture already exists and the work is to understand or improve it. The product should acknowledge those differences instead of pretending every design starts with a perfect prompt. Start chooser presenting Guided Chat, Generate Diagram, and Import Existing as three equal entry paths. Figure 2. Three starting paths reflect three different architecture situations: discovery, structured generation, and analysis of an existing design. Stage 2: Refine — preserve human work One of the clearest feedback themes was not about adding another AI capability. It was about preventing AI from casually undoing human effort. An architect might spend time arranging a one-page diagram for a review, resizing groups, moving labels, or emphasizing a specific boundary. A subsequent AI refinement could improve the service selection while disrupting that carefully prepared layout. The design principle that emerged was straightforward: AI acceleration should preserve deliberate human work by default. Refinement now retains existing node positions, group geometry, sizes, and viewport context whenever possible. The model can change the architecture without treating every turn as permission to redraw the entire document. The same principle applies beyond geometry: Preserve the prior validation result when recommendations change the architecture. Preserve the active light or dark theme in exported artifacts. Preserve the distinction between the authoring canvas and the presentation deliverable. Preserve user-configured pricing assumptions rather than replacing them with one fixed estimate. This is a broader lesson for AI-assisted tools. A generated result is not the only source of value. The edits, judgments, and communication choices a person adds afterward are part of the artifact too. Before-and-after AADB canvases showing an AI refinement that adds Azure Front Door and WAF while retaining the positions of eight existing services and the anchors of four existing groups. Figure 3. In this controlled synthetic refinement, all eight existing service positions and four group anchors remained unchanged. The containing Application group expanded to accommodate the new edge tier, so preservation does not imply that every group dimension stays fixed. Quality is structural, not only visual A diagram can look polished while still being architecturally confusing. Early feedback exposed cases where a generated service appeared disconnected because a model referenced a display name instead of the service identifier used by the canvas. The correction was not another prompt instruction alone. The application now resolves connection endpoints across identifiers, normalized service names, and service-type aliases. It repairs valid edges, drops invalid or self-referential edges, detects remaining orphan nodes, and records aggregate integrity signals. That creates a more useful definition of diagram quality: Are the services connected as intended? Were any generated edges repaired or dropped? Are there orphaned nodes? Did refinement preserve the existing layout? Did an architecture change receive a fresh validation? Visual polish still matters, especially when an artifact leaves the editor. But structural integrity gives the product something deterministic to test and monitor. Stage 3: Validate & Improve — treat validation as a lifecycle The Azure Well-Architected Framework is most useful when validation becomes iterative rather than ceremonial. The Diagram Builder can assess a proposed design across the five Well-Architected pillars, surface findings, and apply selected recommendations. But that workflow exposed an important state-management problem: when the architecture changed, the prior validation result disappeared along with the obvious route back to revalidation. The updated experience keeps the previous report, marks it Revalidate Needed, and makes clear that the score describes an earlier state of the architecture. A new validation replaces it only after the updated design has been assessed. This distinction prevents a stale score from looking current. It also clarifies what an architecture-level assessment can and cannot prove. A diagram may show that a WAF, cache, backup service, or secondary region exists. It usually cannot prove that purge protection, diagnostic routing, encryption settings, role assignments, health probes, or failover policies are configured correctly. That is why validation findings need to distinguish between: Pattern-level gaps — missing or misplaced architectural components Configuration-level gaps — required settings that must be verified in Infrastructure as Code or the deployed environment Generated scores and recommendations help architects review a design; they do not replace an Azure Well-Architected Review, security review, deployment validation, or professional judgment. Validation result retained after architecture recommendations are applied, with a Revalidate Needed status and action. Figure 4. Architecture changes make a previous validation historical, not useless. The result remains available while the interface clearly asks for a fresh validation. Stage 4: Share or Build — design for the artifact’s destination The editing canvas and the final deliverable serve different purposes. Canvas dots, handles, navigation controls, and selection states help during authoring. They can make an exported diagram feel unfinished. The Diagram Builder now separates those concerns with Plain, Dots, and Grid export backgrounds while preserving the active light or dark theme. The same AADB architecture shown first on the editing canvas with the export menu open and then as the resulting Plain PNG without authoring controls. Figure 5. Authoring and delivery are different contexts. The upper view shows the editable canvas and its real export controls; the lower view is the Plain PNG produced from that same canvas, without editing chrome. Cost language is deliberately qualified. Azure services often combine fixed, usage-based, and configuration-dependent charges. A baseline that includes six numerically priced services but excludes 20 usage-based items is not the total cost of the architecture. The output identifies those exclusions rather than treating missing values as zero. The final stage also includes deployment guides and Infrastructure as Code. Here, honesty about artifact coverage is essential. A generated Bicep file may be a useful starter while still omitting private endpoints, diagnostic settings, failover configuration, or service-specific resources. The artifact should state what it implements, what remains conceptual, and whether Azure Resource Manager validation passed. AI-generated diagrams, costs, validation results, deployment guides, and Infrastructure as Code should all be reviewed and validated before production use. The same journey now extends to agents The MCP server introduced in the previous article makes the Diagram Builder available to agent experiences such as Microsoft Scout. The four-stage journey provides a useful way to think about agent orchestration too: Import or create one canonical architecture. Refine it without silently changing the intended topology. Validate it, apply supported improvements, and revalidate. Render or generate artifacts with explicit coverage and limitations. The current MCP surface exposes 12 tools, three resources, and three reusable prompts. It can normalize an existing architecture, validate and harden it deterministically, estimate regional costs from a dated pricing snapshot, render presentation/technical/cost views, and generate Bicep, Terraform, and deployment guidance. The calling agent still owns orchestration and reasoning; the MCP server is intended to remain a deterministic architecture capability, not a second hidden agent. The native MCP renderer can project one canonical architecture into three communication profiles: Presentation emphasizes the primary request path, reduces supporting labels, and removes pricing. Technical preserves complete connection detail for engineering inspection. Cost retains the focused composition while adding service-level pricing assumptions, a fixed-priced baseline, and explicit exclusions. These are MCP-generated SVG views, not Blueprint diagrams or screenshots of the editable web canvas. The services, connections, and groups remain the same; only the information treatment changes. The AADB MCP renderer projecting the same canonical architecture into presentation, technical, and cost SVG profiles. Figure 6. Native AADB MCP output from one 8-service, 9-connection, 4-group architecture. Presentation prioritizes the story, Technical exposes connection detail, and Cost foregrounds pricing assumptions and exclusions. Recent work on the MCP renderer added purpose-built presentation, technical, and cost profiles. More importantly, testing agent-generated artifacts reinforced an accountability principle: a polished diagram and a compiled Bicep file do not prove deployability. An agent workflow should report whether topology changed, whether validation improved, which services are represented only conceptually, and whether the generated IaC passed Azure preflight. That is more useful than an unsupported claim that a design is production-ready. Trust also includes the tool boundary itself. The hosted MCP endpoints now require a bearer token for real session operations; missing or incorrect credentials are rejected. A shared token is appropriate for the current controlled integration, but it is not the end state for enterprise multi-user access. Entra ID/OAuth, per-client authorization, rotation, and revocation remain future hardening work. Microsoft Scout response after an authenticated Azure Architecture Diagram Builder MCP workflow, showing the tools used, initial and final validation scores, cost scope, Bicep classification, rendered architecture, artifact links, coverage gaps, and no-deployment warning. Figure 7. The guided lifecycle extends beyond the web application. In this synthetic Scout run with GPT-5.6 Sol, the agent used authenticated AADB MCP tools to validate, harden, cost, render, and generate starter artifacts while explicitly reporting coverage gaps and that nothing was deployed. Learning from adoption without identifying people Product learning does not require reconstructing individual identities. The findings behind this article use aggregate, deduplicated application telemetry, public article counters, public repository totals, and paraphrased feedback themes. They do not correlate Application Insights identifiers, feedback records, GitHub accounts, or email addresses. Written feedback remains submittable without contact information. When someone explicitly opts into follow-up, the email address is stored with the feedback record in Cosmos DB and is not sent to normal product telemetry. The current 180-day expiry field is a retention marker; automated deletion must be implemented and verified before describing that retention period as enforced. Those boundaries matter for both product design and public writing: Aggregate activity rather than profiling individuals. Paraphrase themes rather than publishing comments without permission. Keep optional contact consent separate from telemetry. Avoid presenting anonymous identifiers as confirmed people. Avoid claiming that publication timing proves acquisition causality. This is not a claim of legal compliance. It is a product discipline: collect less, preserve user agency, and make only the claims the evidence supports. What changed The guided journey is the visible result, but the deeper change is how the project now evaluates progress. Earlier question Better question Did the model generate a diagram? Did it generate a connected and understandable architecture? Did the user click Validate? Was the current architecture validated, and was it revalidated after changes? Did export start? Did a professional artifact finish generating successfully? Does the IaC compile? What does it actually implement, and does Azure preflight pass? How many features exist? Can an architect understand the next useful step? The model portfolio continued to evolve as well. The production selector now contains 15 configured entries, including MAI-Thinking-1 (Public Preview). But the more consequential changes in this article are deliberately model-independent: preserve human work, keep state and provenance explicit, qualify generated artifacts, and authenticate the tools agents can call. The goal is not to remove flexibility. Architects can still open any tool directly, rearrange the canvas, reject recommendations, change pricing assumptions, or export at any point. The goal is to make the workflow coherent without pretending architecture itself is linear. The next boundary: logical versus physical architecture Recent feedback points to a harder problem than adding another model or export format. Architects working with private Azure AI landing zones need to distinguish shared platform resources from project-owned resources, preserve VNet and subnet boundaries, and reason about CIDRs, NSGs, route tables, private endpoints, DNS, and managed identities. The current Topology mode can show services and relationships, but it should not imply exact physical fidelity when those facts are absent. A useful logical diagram answers what exists and how it interacts. A physical or low-level design must answer where it is deployed, how it is isolated, and which values came from evidence. That is the next technical direction I am exploring: an evidence-aware Physical Architecture view backed by deterministic reconstruction from Terraform plan/state, ARM, or a live Azure inventory. Exact fields would be labeled as observed or resolved; AI suggestions would remain explicitly proposed; unsupported or missing inputs would be reported instead of silently invented. This capability is not shipped today, and it will require its own schema, validation rules, layout, security review, and evaluation set. That distinction matters. The lesson from adoption is not to put every architecture concern into one crowded canvas. It is to make each artifact’s purpose and evidence boundary clear. Try it, challenge it, help shape what comes next The Azure Architecture Diagram Builder remains open source, and the live experience is available today: Live app: https://aka.ms/diagram-builder Source code: github.com/Arturo-Quiroga-MSFT/azure-architecture-diagram-builder Getting started: Documentation and deployment guidance The next phase is to measure whether the guided journey helps people complete the full loop, especially recommendation-to-revalidation and artifact-generation success. In parallel, I am beginning the narrower physical-architecture investigation described above. Both efforts will use aggregate signals, reviewed fixtures, and sufficiently large cohorts rather than individual journey reconstruction. Try the workflow with a real architecture problem. Tell me where the handoffs are unclear, where the diagram loses intent, or where an artifact claims more than it implements. Those are the gaps worth fixing next. Measurement note: Article views are rounded public counters observed August 5, 2026. Application figures use deduplicated retained telemetry through August 13 and anonymous identifiers. GitHub totals and rolling 14-day traffic were observed August 13. The comparison windows are May 19–July 9 and July 10–August 13. These signals have different populations and must not be added together. Timing comparisons show concurrent activity, not causal attribution.1KViews1like2CommentsMicrosoft Industrial AI Partner Guide: Choosing the Right Data Expertise for Every Stage
As organizations scale Industrial AI, the challenge shifts from technology selection to deciding who should lead which part of the journey -- and when. Which partners should establish secure connectivity? Who enables production grade, AI ready industrial data? When do systems integrators step in to scale globally? This Partner Guide helps customers navigate these decisions with clarity and confidence: Identify which partners align to their current digital transformation and Industrial AI scenarios leveraging Azure IoT and Azure IoT Operations Confidently combine partners over time as they evolve from connectivity to intelligence to autonomous operations This guide focuses on the Industrial AI data plane – the partners and capabilities that extract, contextualize, and operationalize industrial data so it can reliably power AI at scale. It does not attempt to catalog or prescribe end‑to‑end Industrial AI applications or cloud‑hosted AI solutions. Instead, it helps customers understand how industrial partners create the trusted, contextualized data foundation upon which AI solutions can be built. Common Customer Journey Steps 1. Modernize Connectivity & Edge Foundations The industrial transformation journey starts with securely accessing operational data without touching deterministic control loops. Customers connect automation systems to a scalable, standards-based data foundation that modernizes operations while preserving safety, uptime and control. Outcomes customers realize Standardized OT data access across plants and sites Faster onboarding of legacy and new assets Clear OT–IT boundaries that protect safety and uptime Partner strengths at this stage Industrial hardware and edge infrastructure providers Protocol translation and OT connectivity Automation and edge platforms aligned with Azure IoT Operations 2. Accelerate Insights with Industrial AI With a consistent edge-to-cloud data plane in place, customers move beyond dashboards to repeatable, production-grade Industrial AI use cases. Customers rely on expert partners to turn standardized operational data into AI‑ready signals that can be consumed by analytics and AI solutions at scale across assets, lines, and sites. Outcomes customers realize Improved Operational efficiency and performance Adaptive facilities and production quality intelligence Energy, safety, and defect detection at scale Partner strengths at this stage Industrial data services that contextualize and standardize OT signals for AI consumption Domain-specific acceleration for common Industrial AI scenarios Data pipelines integrated with Azure IoT Operations and Microsoft Fabric 3. Prepare for Autonomous Operations As organizations advance toward closed‑loop optimization, the focus shifts to safe, scalable autonomy. Customers depend on partners to align data, infrastructure, and operational interfaces, while ensuring ongoing monitoring, governance, and lifecycle management across the full operational estate. Outcomes customers realize Proven reference architectures deployed across plants AI‑ready data foundations that adapt as operations scale Coordinated interaction between OT systems, AI models, and cloud intelligence Partner strengths at this stage Industrial automation leadership and control system expertise Edge infrastructure optimized and ready for Industrial AI scale Systems integrators enabling end‑to‑end implementation and repeatability Data Intelligence Plane of Industrial AI - Partner Matrix This matrix highlights which partners have the deepest expertise in accessing, contextualizing, and operationalizing industrial data so it can reliably power AI at scale. The matrix is not a catalog of end‑to‑end Industrial AI applications; it shows how specialized partners contribute data, infrastructure, and integration capabilities on a shared Azure foundation as organizations progress from connectivity to insight to autonomous operations. How to use this matrix: Start with your scenario → identify primary partner types → layer complementary partners as you scale. Partner Type Adaptive Cloud Primary Solution Example Scenarios Geography Advantech Industrial Hardware, Industrial Connectivity LoRaWAN gateway integration + Azure IoT Operations Industrial edge platforms with built in connectivity, industrial compute, LoRaWAN, sensor networks Global Accenture GSI Industrial AI, Digital Transformation, Modernization OEE, predictive maintenance, real-time defect detection, optimize supply chains, intelligent automation and robotics, energy efficiency Global Avanade GSI Factory Agents and Analytics based on Manufacturing Data Solutions Yield / Quality optimization, OEE, Agentic Root Cause Analysis and process optimization; Unified ISA-95 Manufacturing Data estate on MS Fabric Global Belden Industrial Connectivity, Networking, Security Belden Horizon Data Operations (BHDO) + LioN-X with Azure IoT Operations OT-IT convergence, network orchestration and monitoring, ruggedized ethernet and switching, industrial WiFi, multi-vendor protocol connectivity, OT security, OPC UA Global Capgemini GSI The new AI imperative in manufacturing OEE, maintenance, defect detection, energy, robotics Global DXC GSI Intelligent Boost AI and IoT Analytics Platform 5G Industrial Connectivity, Defect detection, OEE, safety, energy monitoring Global Innominds SI Intelligent Connected Edge Platform Predictive maintenance, AI on edge, asset tracking North America, EMEA Litmus Automation Industrial Connectivity, Industrial Data Ops Litmus Edge + Azure IoT Operations Edge Data, Smart manufacturing, IIoT deployments at scale Global, North America Mesh Systems GSI & ISV Azure IoT & Azure IoT Operations implementation services and solutions (including Azure IoT Operations-aligned connector patterns) Device connectivity and management, data platforms, visualization, AI agents, and security North America, EMEA Nortal GSI Data-driven Industry Solutions IT/OT Connectivity, Unified Namespace, Digital Twins, Optimization, Edge, Industrial Data, Real‑Time Analytics & AI EMEA, North America & LATAM NVIDIA Technology Partner Accelerated AI Infrastructure; Open libraries, models, frameworks, and blueprints for AI development and deployment. Cross industry digitalization and AI development and deployment: Generative AI, Agentic AI, Physical AI, Robotics Global Oracle ISV Oracle Fusion Cloud SCM + Azure IoT Operations Real-time manufacturing Intelligence, AI powered insights, and automated production workflows Global Rockwell Automation Industrial Automation FactoryTalk Optix + Azure IoT Operations Factory modernization, visualization, edge orchestration, DataOps with connectivity context at scale, AI ops and services, physical equipment, MES Global Schneider Electric Industrial Automation Industrial Edge Physical equipment, Device modernization, energy, grid Global Siemens Industrial Automation & Software Industrial Edge + Azure IoT Operations reference architecture Industrial edge infrastructure at scale, OT/IT convergence, DataOps, Industrial AI suite, virtualized automation. Global Sight Machine ISV Integrated Industrial AI Stack Industrial AI, bottling, process optimization Global Softing Industrial Industrial Connectivity edgeConnector + Azure IoT Operations OT connectivity, multi-vendor PLC- and machine data integration, OPC UA information model deployment EMEA, Global TCS GSI Sensor to cloud intelligence Operations optimization, healthcare digital twin experiences, supply chain monitoring Global This Ecosystem Model enables Industrial AI solutions to scale through clear roles, respected boundaries and composable systems: Control systems continue to be driven by automation leaders Safety‑critical, deterministic control stays with industrial automation partners who manage real‑time operations and plant safety. Customers modernize analytics and AI while preserving uptime, reliability, and operational integrity. Data, AI, and analytics scale independently A consistent edge to cloud data plane supports cloud scale analytics and AI, accelerating insight delivery without entangling control systems or slowing operational change. This separation allows customers and software providers to build AI solutions on top of a stable, industrial‑grade data foundation without redefining control system responsibilities. Specialized partners align solutions across the estate Partners contribute focused expertise across connectivity, analytics, security, and operations, assembling solutions that reduce integration risk, shorten deployment cycles, and speed time to value across the operational estate. From vision to production Industrial AI at scale depends on turning operational data into trusted, contextualized intelligence safely, repeatably, and across the enterprise. This guide shows how industrial partners, aligned on a shared Azure foundation, create the data plane that enables AI solutions to succeed in production. When data is ready, intelligence scales. Call to action: Use this guide to identify the partners and capabilities that best align to your current Industrial AI needs and take the next step toward production‑ready outcomes on Azure.2.1KViews4likes0CommentsAgent experience with data in Onelake using Fabric IQ
Business Scenario A retail organization runs multiple promotional sales events across its store network in different cities, featuring various product categories. Data is captured from: Third-party systems (products, stores, sales events) ERP system i.e. Finance and Operations (customer data) Customers are linked to stores based on city in the ERP system, and each store hosts specific sales events. However, while significant investments are made in marketing campaigns, inventory allocation, and event planning, the organization needs to identify Which stores generate the highest revenue during events Which locations are having majority of customer footprint Solution: Rather than creating custom reports on raw data, an agent can leverage the data in Onelake and use Fabric semantic models and Fabric IQ to provide conversational analytics. The agent can intelligently normalize user inputs and return accurate results even when values such as city names are entered with spelling errors or variations. Advantage: Because the data comes from two disconnected worlds (third-party systems for products/stores/events, ERP for customers), the "join" between them — customer → city → store → event → product — is business logic, not a database key. Fabric Ontology captures exactly that: entity types, relationships, rules and source mappings, so agents don't have to rediscover it from raw tables each time. A. Prerequisite: Data Sources & Relationships Overview Product, store, and sales event data are sourced from third-party systems. Customer data is sourced from the ERP (Dynamics 365 Finance & Operations) system through Fabric lakehouse. How the data is connected: Customers are linked to stores based on city alignment (customer city = store location). Sales events are associated with: The products being sold, and The stores where the events are conducted. Licenses and access requirement: Component License / Requirement Microsoft Fabric Fabric Capacity F2 or higher OR Power BI Premium Capacity P1 or higher with Fabric enabled Fabric IQ Ontology Ontology (Preview) enabled and an active Ontology item in Fabric Copilot Studio A Copilot Studio environment where MCP tools are allowed D365 F&O Valid Dynamics 365 Finance and/or Supply Chain Management licenses for the source users and data access Data movement Fabric ingestion pattern (Lakehouse, OneLake, Dataflow, Link to Fabric, etc.) as applicable B. Step by step configuration: Push the data to OneLake : Connect D365 F&O customer data to Fabric Lakehouse through PowerPlatform Ref: Link your Dataverse environment to Microsoft Fabric and unlock deep insights - Power Apps | Microsoft Learn A Lake house will be created in Fabric with the data Ingest the Data for Store , Sales event and Product from third party system to Fabric using any of the methods as outlined in the documentation below (as relevant) Ref: https://learn.microsoft.com/en-us/fabric/data-engineering/load-data-lakehouse Create a semantic model and relationship between them Ref: https://learn.microsoft.com/en-us/fabric/data-engineering/tutorial-lakehouse-build-report Create Ontology using the semantic model Ref: https://learn.microsoft.com/en-us/fabric/iq/ontology/concepts-generate Ref: Create an Ontology with Fabric IQ - Training | Microsoft Learn Click on View entity type details > click on manage relationship > click on the relation Configure the source and target entity names and connected fields. Repeat similar setup for others as relevant Login to https://copilotstudio.preview.microsoft.com/ and Create Copilot studio agent with following instruction: When processing a user query: Determine whether the user input contains a city name, location name, region, state, or geographical reference. If a location reference is detected: o Identify potential spelling mistakes, abbreviations, alternate spellings, phonetic variations, or non-standard user input using the <<custom prompt>>. o Normalize the value to the most likely official city name used in the enterprise data model. o Examples: "Bombay" → "Mumbai" "NYC" → "New York" Use only the normalized location value when querying Fabric IQ. If confidence in the normalization is high, proceed automatically without asking the user for confirmation. If multiple cities are equally likely matches, ask a clarifying question before querying Fabric IQ. When invoking Fabric IQ MCP: o Replace the original user-entered city value with the normalized city value. o Use the normalized value consistently across all ontology searches and filters. Never expose the internal normalization process unless the user explicitly asks how the result was determined. Return the business result based on data retrieved from Fabric IQ, not based on assumptions. Example: User: "Show sales for Bangaluru last quarter" Normalized City: "Bengaluru" Fabric IQ Query: "Show sales for Bengaluru last quarter" Add Fabric IQ MCP tool Click on Fabric IQ MCP and provide workspace ID and Ontology ID as retrieved from the Ontology URL in Fabric To find the URL, follow these steps: Open your ontology item in Fabric. View the URL in the browser, in the format https://app.fabric.microsoft.com/groups/<workspace-ID>/ontologies/<ontology-item-ID>. Copy the values of <workspace-ID> and <ontology-item-ID> from the URL. Form the MCP server URL by entering the copied values into this string: https://api.fabric.microsoft.com/v1/mcp/dataPlane/workspaces/<workspace-ID>/items/<ontology-item-ID>/ontologyEndpoint.You use this MCP server URL in the next section Following figures explains the details once the process Ref: https://learn.microsoft.com/en-us/fabric/iq/ontology/how-to-create-agent-copilot-studio Add a tool Prompt to ensure normalised search for any user input (e.g. City) Put the following instruction in a custom prompt : You are a location normalization expert. Your task is to identify the most likely city name from the user's input, even when: - The city name contains spelling mistakes. - The city name is partially entered. - The city is entered using an old or alternate name. - The city contains abbreviations or phonetic spellings. Rules: Determine the most likely official city name. Correct spelling mistakes using geographic knowledge. Expand abbreviations where appropriate. Return only the normalized city name. If confidence is below 80%, return "AMBIGUOUS". Never invent a city when multiple equally likely matches exist. Examples: Input: Banglore Output: Bengaluru Input: Mumbi Output: Mumbai Input: BNG Output: Bengaluru Input: Londn Output: London City input: {{CityName}} Output format: { "normalizedCity": "Bengaluru", "confidence": 0.95 } Test the agent Open the Test pane using the Test button in the top right corner of the screen. Enter NL query Allow the MCP tool when prompted Test case 1: What is the top product revenue across all stores? Test case 2: Intelligent Location Normalization with Fabric IQ When a user submits a query such as "Compare the customer footfall between city Blr and Hyd", the agent first applies an AI-powered normalization layer before querying enterprise data. The normalization prompt analyses abbreviations, alternate spellings, phonetic variations, and non-standard location references, mapping them to their canonical business values. In this example: Blr → Bengaluru (Bangalore) Hyd → Hyderabad The normalized city names are then passed to Fabric IQ for semantic retrieval against the ontology and underlying data sources. This approach improves query accuracy, reduces dependency on exact user input, and enables a more natural conversational experience while ensuring consistent reporting and analytics results. Process Flow : User Query → AI Prompt Normalization → Canonical City Resolution (Bengaluru, Hyderabad) → Fabric IQ Semantic Search → Data Retrieval & Comparison Results298Views1like0Comments
Building 3IQ Retail Assistant Demo – Part 1
Introduction Recently I received a request from one of our GSI partners to demonstrate them 4IQs on a retail industry scenario. Unfortunately, Web IQ is still not in public preview. Hence, I promised them to come back with an example later with Web IQ. But even with the remaining Fabric IQ, Foundry IQ and Work IQ, the issue is finding the right set of data and then build a story around it to demonstrate an agentic solution addressing some practical real-life scenario. After doing some research with available data, I formulated a plan to prepare an assistant for customer reps to address incoming questions and requests from customers. This article describes how to build such an environment to demonstrate the capability of 3IQs together. First, we need an Azure subscription with option to provision Fabric capacity, need Foundry, M365, and Copilot Studio access. Once you have those, let’s move to set up our environment. Environment Set Up I have limited time in hand. So, I went ahead with existing templates to implement Foundry and surrounding services on Azure. I used this Bicep template: foundry-samples/infrastructure/infrastructure-setup-bicep/16-private-network-standard-agent-apim-setup at main · microsoft-foundry/foundry-samples. There are several other templates available on that page. You can choose any one of those based on your preference. This template puts all resources including Foundry behind private endpoints with no public internet access. You can add a jumpbox as a Bastion host to connect to all these services. Or time to time you can make those services public to complete your work. Setting up Fabric We will start with data layer which is Fabric. It is not provisioned yet. I provisioned a Fabric capacity with minimum size/SKU (F2) within the Resource Group generated by the Bicep template earlier. Fabric is an expensive service, especially the higher SKUs are. So, we need to be careful not spend too much and surpass our monthly Azure quota. Once provisioned, go to https://app.fabric.microsoft.com/ and create a Workspace using the same Fabric Capacity we provisioned earlier. Here “Fabric3IQ” is the name of my Fabric capacity. As the workspace is created now, let’s create a Lakehouse inside the Workspace and start loading data into the Lakehouse. But prior to that, let’s go to the Fabric capacity on Azure Portal and increase the size to a bigger SKU such as F64. We will load AdventureWorks sales data into the Lakehouse. There is a detail description here showing how to do it: Quickstart: Create Your First Graph in Microsoft Fabric - Microsoft Fabric | Microsoft Learn. Only follow the “Load Sample Data” section. One done, it should look like this: Now is the time to create our Ontology. People who are not familiar can find a guide in this tutorial: Tutorial Part 1: Create an Ontology - Microsoft Fabric | Microsoft Learn. We added each table from Lakehouse as entities and build relationship within those entities. Here is how it looks like now: Next is adding a Data Agent to the Fabric Workspace. Once added, now add a data source and select the Ontology you created earlier. Now, as your Data Agent is ready ask few complex questions like: “What are the top 5 categories sold?”, “Give me the seller's name who handled most orders in numbers and not in total sale amount?”, “List those customers who didn't purchase anything” and see the result. Once, satisfied, let’s pause the Fabric Capacity from Azure Portal and reduce the size of the capacity to F2. We will resume and rescale it once everything is ready.422Views0likes0Comments