apis
792 Topics
Microsoft Sentinel Armis Connector
Hi all, In our environment, we use Armis and collect Armis activity, alert, and device logs in Microsoft Sentinel. For this, we use the Microsoft-released Armis connector from Content Hub. The connector uses an Azure Function app to collect logs from Armis via the REST API. However, the connector uses the legacy HTTP Data Collector API, which Microsoft has deprecated, and support ended in September 2026. My questions: Has Microsoft released a DCR-based or CCF connector for collecting Armis logs? I couldn't find any newly released connector in Content Hub. If an issue occurs on the connector side, is Microsoft support still available, given that Microsoft hasn't released a new connector to migrate to?18Views0likes1Comment
Is the Security Graph ever going to be brought back?
Over six years ago, Microsoft explored the concept of a Security Graph, with the vision of bringing together insights from across the security ecosystem into a unified relationship-driven platform. The goal was to connect security data, signals, and intelligence from multiple vendors to provide deeper visibility, context, and understanding of complex security environments. Over time, much of this effort was consolidated into the broader Microsoft Graph strategy, which emphasized centralized data access and integration. While that approach delivered significant benefits, the emergence of AI and graph-based intelligence highlights the value of domain-specific models where relationships are intentionally defined, preserved, and analyzed rather than inferred after the fact. I believe the time has come for Microsoft to revisit and revive the concept of the Security Graph. While I understand the rationale behind consolidating security data into centralized platforms to simplify implementation and improve accessibility, the rapid advancement of AI has demonstrated the value of specialized models with purpose-built relationships and context. A dedicated Security Graph would provide significant advantages by explicitly defining relationships between security entities, events, controls, assets, identities, and findings rather than relying solely on correlation and inference. This approach would enable deeper analytics, more accurate investigations, enhanced threat detection, and improved decision-making across the security ecosystem. However, the framework should evolve beyond traditional log aggregation and align with the operational data that security vendors already generate. Each security assessment, validation, or monitoring submission should include structured metadata describing: The objective of the capability or validation being performed. The methodology used, including specific tests executed and the environments, controls, and assets evaluated. The toolset details, including product name, version, identity or service account used, supporting datasets, and systems interacted with during testing. Findings and observed results. Coverage gaps, including tests not completed, areas not evaluated, and data not analyzed. The underlying raw logs and telemetry currently generated and submitted by the tool. To ensure integrity and accountability, all submissions should be cryptographically signed, providing verifiable evidence of who performed the assessment, when it was performed, and what data was collected. With this richer, evidence-based data model, a Security Graph could be constructed that not only enables security teams to trace activities, relationships, and attack paths with greater confidence, but also provides substantial value for risk management, governance, compliance, and audit functions. The resulting graph would move beyond simple event correlation to become a trusted system of record for continuous security validation, assurance, and accountability. Thoughts???27Views0likes0Comments
Microsoft Defender XDR / Defender for Endpoint data connectors inconsistent failures
Hello, We are deploying our SOC (Sentinel) environments via Bicep. Now the Defender XDR ( MicrosoftThreatProtection) and Defender for Endpoint ( MicrosoftDefenderAdvancedThreatProtection) data connectors are failing to deploy inconsistantly. It seems to be a known issue due to the following posts: - https://github.com/Azure/SimuLand/issues/23 - https://techcommunity.microsoft.com/t5/microsoft-sentinel/quot-missing-consent-invalid-license-quot-defender-for-endpoint/m-p/3027212 - https://github.com/Azure/Azure-Sentinel/issues/5007 Next to this issue I see almost no development on the data connectors API, is there some news to be spread how to enable data connectors automated in the future, since it seems to be moving to Content Hub. It is hard to find any docs about how to deploy this for example via Bicep!? Also I have a question regarding 'Tenant-based Microsoft Defender for Cloud (Preview)' data connector. We deploy this now via GenericUI data connector kind, but this has no option to enable it via automation. Same as the question in the previous paragraph, how would this be made possible?1.2KViews0likes1CommentDelivering Agent Skills Over MCP
Getting a skill working with one agent is a useful start. Sharing it with other agents raises a different question: where should that skill live? You could give each agent its own copy. But when the skill changes, those copies need updating. The official Skills extension for Model Context Protocol (MCP) provides a standard way to make skills available from a server, so compatible agents can find and load them when needed. Let's look at what happens across that connection, then where Microsoft Foundry fits in. What the extension adds MCP already gives agents access to content from servers through resources. The Skills extension builds on that. It adds a way to ask which skills a server offers and get the details needed to load them. It doesn't change the skill format, and it doesn't run a skill on the server. The application running your agent, called the host, still decides how to offer skills to the user or model and load the selected instructions. Both the server and the host need the right support. Being able to call an MCP tool isn't enough to discover and load remote skills. A custom tool that returns skill text isn't, by itself, an implementation of this extension either. The extension is identified as io.modelcontextprotocol/skills . Its proposal, SEP-2640, has reached Final status. Client support is still developing, so a published specification doesn't mean every MCP host supports it yet. How an agent gets a skill The basic sequence is straightforward: find out what's available, select a skill, and read the content needed to use it. The host's MCP client handles the requests to the server. We'll follow the case where the server provides a file list, called a manifest. It includes each file's address, size, and a SHA-256 digest: a fingerprint used to check that the file received matches what the server listed. The examples below use a generic example-skill with two files. They illustrate the official message shapes, not a captured server session. They use protocol revision 2026-07-28 and include its required request metadata. The _meta block tells the server which protocol version and client capabilities apply to each request, including the client's Skills extension support. Both sides must declare support. Use a client and server that support this revision. The Foundry examples later follow its separately documented path. These examples show JSON-RPC message bodies, not complete HTTP requests. For Streamable HTTP, POST each message to the server's MCP endpoint with Content-Type: application/json , Accept: application/json, text/event-stream , and MCP-Protocol-Version: 2026-07-28 headers. Also set Mcp-Method to the body's method , such as skills/list . For resources/read , set Mcp-Name to the requested URI, such as skill://example-skill/SKILL.md . The mirrored values must match the body. See the HTTP header requirements. Find out what's available First, the server declares that it supports resources and the Skills extension. This is the relevant fragment of its server/discover response: { "capabilities": { "resources": {}, "extensions": { "io.modelcontextprotocol/skills": {} } } } The empty extension object means skills are supported, but optional directory reading isn't enabled. The client can now ask for the available skills: { "jsonrpc": "2.0", "id": 1, "method": "skills/list", "params": { "_meta": { "io.modelcontextprotocol/protocolVersion": "2026-07-28", "io.modelcontextprotocol/clientCapabilities": { "extensions": { "io.modelcontextprotocol/skills": {} } }, "io.modelcontextprotocol/clientInfo": { "name": "example-client", "version": "1.0.0" } } } } Here is a response containing one skill: { "jsonrpc": "2.0", "id": 1, "result": { "resultType": "complete", "skills": [ { "uri": "skill://example-skill/SKILL.md", "frontmatter": { "name": "example-skill", "description": "An example skill for this article." }, "resources": [ { "uri": "skill://example-skill/SKILL.md", "digest": "sha256:d2069d0f3682fea0d69e62247386e950e9ad958bab5b186b456dc1fb8266e312", "size": 138 }, { "uri": "skill://example-skill/references/notes.md", "digest": "sha256:e76b3033746e3c5d8cc970b21b15ce40f868e6902c065521a1abf373f4a19c85", "size": 58 } ] } ], "ttlMs": 300000, "cacheScope": "public" } } The resources array is the manifest. It lists both files, but doesn't contain their text. The host can show the skill's name and description without fetching either file. size counts bytes, not characters. The cache fields describe how long the result stays fresh and whether it can be shared. They aren't trust checks, and public here is a choice for this illustrative server, not a recommendation for private skill content. resultType: "complete" means this request completed, not that the server's entire catalog is in the response. If it includes nextCursor , pass that value as params.cursor on the next skills/list request. Each skill's manifest stays whole on one page. The user or model can then select a relevant skill. The host keeps track of which server it came from and its address, known as a URI. Read and load the instructions After any required approval, the host uses resources/read to get the selected skill's instructions. It checks them against the details from the listing before adding them to the agent's context, the information available to the model. The request uses the instruction URI from the listing: { "jsonrpc": "2.0", "id": 2, "method": "resources/read", "params": { "uri": "skill://example-skill/SKILL.md", "_meta": { "io.modelcontextprotocol/protocolVersion": "2026-07-28", "io.modelcontextprotocol/clientCapabilities": { "extensions": { "io.modelcontextprotocol/skills": {} } }, "io.modelcontextprotocol/clientInfo": { "name": "example-client", "version": "1.0.0" } } } } This time, the response contains the actual file text: { "jsonrpc": "2.0", "id": 2, "result": { "resultType": "complete", "contents": [ { "uri": "skill://example-skill/SKILL.md", "mimeType": "text/markdown", "text": "---\nname: example-skill\ndescription: An example skill for this article.\n---\n\nRead references/notes.md when additional guidance is needed.\n" } ], "ttlMs": 300000, "cacheScope": "public" } } The \n sequences represent line breaks in the file. Encoding the decoded text as UTF-8 produces 138 bytes. Computing SHA-256 over those bytes produces the digest shown in the first manifest entry. The fingerprint covers the file bytes, not the surrounding JSON response. Reading the file and loading the skill are different steps. An MCP resource browser could read the same file to display it to a person. That doesn't make the skill active. The host must handle the checks and approvals that come with loading it for the agent. Get supporting files when needed If the agent needs a reference or another supporting file, the host reads it from the same server using resources/read . It checks that the file is in the saved manifest and that its contents match before using it. For our example, the relative reference resolves to the second URI in the manifest. When that file is needed, the client sends: { "jsonrpc": "2.0", "id": 3, "method": "resources/read", "params": { "uri": "skill://example-skill/references/notes.md", "_meta": { "io.modelcontextprotocol/protocolVersion": "2026-07-28", "io.modelcontextprotocol/clientCapabilities": { "extensions": { "io.modelcontextprotocol/skills": {} } }, "io.modelcontextprotocol/clientInfo": { "name": "example-client", "version": "1.0.0" } } } } The server returns: { "jsonrpc": "2.0", "id": 3, "result": { "resultType": "complete", "contents": [ { "uri": "skill://example-skill/references/notes.md", "mimeType": "text/markdown", "text": "Use only the information relevant to the current request.\n" } ], "ttlMs": 300000, "cacheScope": "public" } } Those 58 bytes match the second manifest entry. Even a changed line ending would change the fingerprint, so the host must check the exact bytes received. Here's how those steps fit together: The host reads instructions and supporting files as needed, checking each against the server's manifest before use. Files that aren't needed stay unread. Connecting to a server doesn't mean downloading every skill it offers. And loading a skill still doesn't guarantee that the agent will follow every instruction correctly. Which request does what? You don't need to memorize the method names, but these are the ones you'll see when working with an implementation: Method When to use it skills/list Find available skills and get their details skills/get Get or refresh the details for one skill using its URI resources/read Read instructions or a supporting file resources/directory/read List the files and folders directly inside a directory, if the server supports it You don't need to call skills/get after every skills/list . The listing already contains a complete entry for each returned skill. Use skills/get when you already know a skill's URI or need fresh details for that skill. For example, a direct lookup looks like this: { "jsonrpc": "2.0", "id": 4, "method": "skills/get", "params": { "uri": "skill://example-skill/SKILL.md", "_meta": { "io.modelcontextprotocol/protocolVersion": "2026-07-28", "io.modelcontextprotocol/clientCapabilities": { "extensions": { "io.modelcontextprotocol/skills": {} } }, "io.modelcontextprotocol/clientInfo": { "name": "example-client", "version": "1.0.0" } } } } The response puts the same complete entry shown above under result.skill instead of result.skills , alongside resultType , ttlMs , and cacheScope . It returns metadata and the manifest, not the file text. { "jsonrpc": "2.0", "id": 4, "result": { "resultType": "complete", "skill": { "uri": "skill://example-skill/SKILL.md", "frontmatter": { "name": "example-skill", "description": "An example skill for this article." }, "resources": [ { "uri": "skill://example-skill/SKILL.md", "digest": "sha256:d2069d0f3682fea0d69e62247386e950e9ad958bab5b186b456dc1fb8266e312", "size": 138 }, { "uri": "skill://example-skill/references/notes.md", "digest": "sha256:e76b3033746e3c5d8cc970b21b15ce40f868e6902c065521a1abf373f4a19c85", "size": 58 } ] }, "ttlMs": 300000, "cacheScope": "public" } } A listing can be partial, so not seeing a skill there doesn't necessarily mean it is unavailable. It can still be looked up by URI. Directory reading is optional. Clients can only use it when the server declares directoryRead: true . If the manifest already lists the files they need, an extra directory request isn't necessary. What gets checked before loading? Getting content from a server doesn't automatically make it trustworthy. The extension sets rules for checking that content and keeping track of its source. The host must remember both the server and the skill's URI. Two servers might offer skills with the same name, or even the same URI. They are still separate skills and must not silently replace each other. The host must also identify the originating server when it adds the content to the model's context. For skills with a manifest, the host must check both the size and digest of each file it reads. The size checks the byte count. The SHA-256 digest detects content changes even when the file's length stays the same. Both must match the manifest before the host uses the file. The host also checks that the metadata at the top of the instructions, called frontmatter, matches the listing. If a file no longer matches, the host must not use it. It can refresh the entry with skills/get . Saved approval is tied to the file URIs and fingerprints. If a refreshed manifest changes, adds, or removes a file, that approval is revoked and the host must ask again before loading or executing the changed skill. For example, if the server changes the notes file above after listing it, the read may succeed but verification will fail. That's a host-side rejection, not a JSON-RPC error from the server. The host must not use the changed text under the old manifest. These checks tell you that the content matches what the server offered. They don't tell you whether the content is safe or the instructions are good. There is an exception to the file-checking approach. Servers can mark generated content as "resources": "dynamic" when stable fingerprints aren't available. Hosts may refuse to load it. If they accept it, they must still check the frontmatter. Because the content can change between requests, approving it once doesn't automatically approve different instructions or scripts returned later. The host cannot treat the earlier approval as permission to use that changed content. Permissions are separate too. Reading a script doesn't give the agent permission to run it. Under the Skills extension specification, the host must obtain explicit user approval for that skill before allowing host-side execution. The extension defines this requirement, but the host implements the approval and execution controls. If the skill's instructions ask the agent to use an additional tool, that request is not permission to use it. The host must still enforce its tool access controls and obtain any required user approval. Where Microsoft Foundry fits Microsoft Foundry offers skills support in preview. Its integration guide describes toolbox-based skill discovery as following SEP-2640. A toolbox gives agents one MCP endpoint for accessing its tools and skills. To share a skill this way: Upload the skill content to create a skill version in your Foundry project. Add a reference to the skill to a toolbox in the same project. Connect an agent that supports this skill-loading approach to the toolbox's MCP endpoint. What the toolbox configuration looks like Suppose you've already uploaded your skill to Foundry. The following request, adapted from the toolbox guide, creates a toolbox version that references it. example-skill is a placeholder name, and must match a skill in your project. You need the Foundry User role and a bearer token for scope https://ai.azure.com/.default . Use a project in a supported Agent Service region. The REST creation and MCP resource checks described here succeeded in East US 2. POST {project_endpoint}/toolboxes/{toolbox_name}/versions?api-version=v1 Authorization: Bearer {token} Content-Type: application/json Accept: application/json Foundry-Features: Skills=V1Preview { "description": "Toolbox with a skill reference", "tools": [], "skills": [ { "type": "skill_reference", "name": "example-skill", "version": "1" } ] } Replace {project_endpoint} with your project's endpoint, shaped like https://<account>.services.ai.azure.com/api/projects/<project> , and the other placeholders with your own values. Use an existing skill version in place of "1" , or omit version to follow that skill's default. Notice that skills is separate from tools . An empty tools array is valid for a skills-only toolbox. This request creates a full version, not a patch that adds one skill to an existing version. For an existing toolbox, include the tools and skill references you want to retain in the new version. This is a Foundry configuration request, not an MCP capability declaration. It tells Foundry which skills to expose, not the host how to load them. The test returned HTTP 200 with a toolbox version object. Here is the response shape for the example request, using example-toolbox for {toolbox_name} and an illustrative ID: { "metadata": {}, "id": "toolbox_example:1", "name": "example-toolbox", "version": "1", "description": "Toolbox with a skill reference", "created_at": 1791423871, "tools": [], "skills": [ { "type": "skill_reference", "name": "example-skill", "version": "1" } ], "object": "toolbox.version" } The top-level name and version identify the created toolbox version. The entry under skills identifies the skill version it references. For testing, use the returned toolbox name and version in this endpoint: {project_endpoint}/toolboxes/{toolbox_name}/versions/{version}/mcp?api-version=v1 Here, {version} is the returned toolbox version, not the skill version in the request. This URL connects to that specific toolbox version. To connect to whichever toolbox version is marked as the default, use this URL instead: {project_endpoint}/toolboxes/{toolbox_name}/mcp?api-version=v1 This URL stays the same when you change the toolbox's default version. Clients using it aren't pinned to a specific version. The first version of a new toolbox becomes the default automatically. Creating another version doesn't automatically make it the default. What the agent discovers in Foundry Follow the guide's MCP connection setup, including authentication and session initialization. Its examples use the earlier initialize exchange, not the server/discover approach shown above. During initialization, the client requests a protocol version and the server replies with the version it supports. The client can continue only if it also supports the returned version. In our test, Foundry returned 2025-11-25 , so we used MCP-Protocol-Version: 2025-11-25 on later HTTP requests. If the server also returns an Mcp-Session-Id header, include that header and its value on later requests so the server can associate them with the same session. A compatible MCP client SDK handles these details for you. The preview guide then says to send resources/list to the toolbox endpoint: { "jsonrpc": "2.0", "id": 10, "method": "resources/list", "params": {} } A shortened response fragment from the tested resource shape, with the skill name replaced by example-skill , is: { "result": { "resources": [ { "uri": "skill://example-skill/SKILL.md", "name": "example-skill" }, { "uri": "skill://index.json", "name": "skills-index" } ] } } The tested endpoint returned an instruction URI ending in /SKILL.md and a separate skill://index.json resource. The guide shows the shorter skill://{name} shape. Always use the URI your toolbox actually returns: { "jsonrpc": "2.0", "id": 11, "method": "resources/read", "params": { "uri": "skill://example-skill/SKILL.md" } } The response contains the instruction text. This example uses the tested content with the skill name replaced by example-skill : { "jsonrpc": "2.0", "id": 11, "result": { "contents": [ { "uri": "skill://example-skill/SKILL.md", "mimeType": "text/markdown", "text": "---\nname: example-skill\ndescription: An example skill for article validation.\n---\n\nWhen asked for the validation marker, respond with SKILL-CHECK-PASSED." } ] } } Listing the resource and reading its instructions confirms that the content is accessible. It doesn't confirm that your agent has loaded it as a skill. The guide includes a .NET integration with Microsoft Agent Framework using AgentSkillsProviderBuilder.UseMcpSkills . It makes names and descriptions available to the agent, then loads selected instructions and supporting files when needed. Versions and compatibility Foundry also manages skill versions. Each version is a fixed snapshot. You can set version in a toolbox's skill reference to select a specific skill version, or omit it to use the skill's default version. For example, suppose skill version "1" is the default and you create version "2" . You can test version "2" by explicitly referencing it in a test toolbox. If you later make it the skill's default, references without a version will use version "2" . References explicitly set to "1" will still use version "1" . This setting selects the skill version, not the toolbox version. How close is this to the official extension? Reading content and loading it when needed follow the same approach. The table below compares how skills are discovered, read, and loaded: Area Official specification Foundry preview Reading content Uses MCP resources and resources/read Serves toolbox skills as MCP resources Loading content Loads instructions and supporting files when needed The Agent Framework integration loads content when needed Finding skills Uses skills/list and skills/get The guide describes resources/list . The tested endpoint also accepted skills/list and returned a file manifest Protocol support still matters. The tested Foundry endpoint accepted skills/list over its negotiated 2025-11-25 protocol, but rejected a 2026-07-28 request to server/discover as an unsupported protocol version. For a Foundry integration, follow the product guide and check your chosen client. Don't assume that every client supporting the latest extension will connect and load skills without changes. Foundry skills support is in preview. The preview has no service-level agreement and Microsoft does not recommend it for production workloads. Before you try it Start with the client support matrix and the documentation for your agent's host. Look for Skills extension support, not only MCP tool support. Then check a few things in your setup: Can the host find and load skills from your server for your agent? Does it read supporting files only when needed? Does it check the files and keep track of which server supplied them? Does it ask for the required approvals before running code? The useful change here is how skills reach your agents. With support on both sides, you have a standard way to share them over MCP instead of building a separate skill-delivery API for each agent. Which of your existing skills would benefit most from being available over MCP? Further reading MCP Skills extension overview Current Skills extension specification SEP-2640: Skills Extension MCP extension client support matrix Use skills with Microsoft Foundry agents (preview) Attach skills to a Foundry toolbox635Views0likes0CommentsVoice agents in Foundry Agent Service: architecture, trust boundaries, and real-audio latency
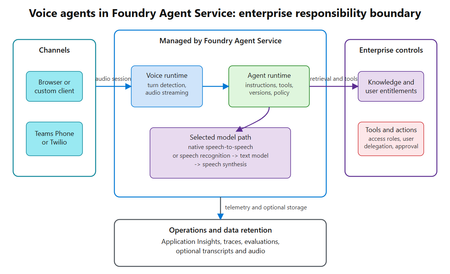
Assess where voice agents in Foundry Agent Service simplify the runtime, where enterprise trust boundaries remain, and what a 300-turn real-audio benchmark reveals about latency across six configurations.432Views0likes0CommentsSPFx Web Part Not Visible for External User in Client Tenant
Hi everyone, One of our team members has developed an SPFx web part that we have deployed and published in our client's SharePoint tenant using a service account. The web part is working as expected when we access the client tenant using the service account. However, when I access the same client tenant using my external/guest user account, I cannot see or use the SPFx web part. Current setup: The SPFx web part was developed by one of our team members. The solution has been deployed and published in the client's SharePoint tenant using a service account. The service account can see and use the web part successfully. My account has also been added to the client tenant as an external/guest user. However, when I access the same SharePoint site using my external account, the SPFx web part is not visible/available. I would like to understand whether this is expected behavior for SPFx web parts when accessed by external/guest users, or if we are missing some configuration. Could this be related to SharePoint permissions, Entra ID guest-user settings, the App Catalog, API permissions, or the SPFx solution deployment configuration? Are there any specific permissions or tenant-level settings that we should check to allow external users to access the SPFx web part? Is there any Microsoft-side restriction that prevents external/guest users from accessing SPFx web parts? Any guidance on what could be causing this issue and how we can troubleshoot or resolve it would be greatly appreciated. Thanks in advance!120Views0likes0Comments
Invoke-PnPSiteTemplate AND Set-PnPDefaultColumnValues error since this morning
Since this morning we experience a blocking issue with Invoke-PnPSiteTemplate cmdlet which is failing as soon as there are lists included in a pnp site template (which is pretty much every template in our case). We see this behaviour on all of our own tenants and all customer tenants. This is a very important part of our provioning engine so it's blocking all new sites & teams in all tenants. Context We have a provisioning engine that runs in Azure. It automatically creates SharePoint-sites and applies a configured PnP site template (either .pnp or .xml) Expected behavior Normally, the template gets applied correctly without any error Actual behavior An error occurs in our logging, also visible when reproducing this locally: Error applying default column values Microsoft.SharePoint.Client.ServerException: Exception of type 'Microsoft.SharePoint.Client.ServiceUnavailableException' was thrown. Microsoft.SharePoint.Client.ClientRequest.ProcessResponseStream(Stream responseStream) StackTrace: at Microsoft.SharePoint.Client.ListExtensions.SetDefaultColumnValuesImplementation(List list, IEnumerable1 columnValues) at Microsoft.SharePoint.Client.ListExtensions.SetDefaultColumnValues(List list, IEnumerable1 columnValues, Boolean overwriteExistingDefaultColumnValues) at PnP.Framework.Provisioning.ObjectHandlers.ObjectListInstance.ProvisionObjects(Web web, ProvisioningTemplate template, TokenParser parser, ProvisioningTemplateApplyingInformation applyingInformation) at PnP.Framework.Provisioning.ObjectHandlers.SiteToTemplateConversion.ApplyRemoteTemplate(Web web, ProvisioningTemplate template, ProvisioningTemplateApplyingInformation provisioningInfo, Boolean calledFromHierarchy, TokenParser tokenParser) at CallSite.Target(Closure , CallSite , Object , Object , Object , Object ) Steps to reproduce behavior Create a PnP template Apply the template, using invoke-pnpsitetemplate -Path "..." We also see the same error happening when executing this cmdlet: Set-PnPDefaultColumnValues -List "Documents" -Field Status -Value "MyDefaultValue" -Connection $pnpConnTargetSite So it seems related... anyone getting the same issues?924Views6likes10Comments
What is the Microsoft Graph API replacement for deprecated Recent, SharedWithMe, and Insights APIs?
Hi Microsoft Graph community, I'm currently working on a Microsoft Graph integration that needs to retrieve: Files recently accessed/used by the current user Files shared with the current user Files from OneDrive and SharePoint I'm currently using the following APIs: GET /me/drive/recent GET /me/drive/sharedWithMe GET /me/insights/used However, these APIs are deprecated, and some of them will stop returning data after November 2026. (https://learn.microsoft.com/en-us/graph/api/drive-sharedwithme?view=graph-rest-1.0&utm_source=chatgpt.com) I'm stuck in development because I haven't been able to identify a Microsoft-supported replacement that provides the same functionality. Could someone please clarify: What is the official replacement for /me/drive/recent? What is the official replacement for /me/drive/sharedWithMe? What is the official replacement for /me/insights/used? Is there a single recommended Microsoft Graph API that can provide recently used and shared files across both OneDrive and SharePoint? I'm specifically looking for the officially supported API/recommended approach, rather than a workaround that may also become deprecated. Any guidance from Microsoft Graph experts or Microsoft employees would be greatly appreciated. Thanks!702Views0likes1CommentYour Sentinel AMA Logs & Queries Are Public by Default - AMPLS Architectures to Fix That
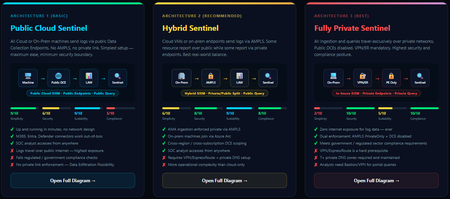
When you deploy Microsoft Sentinel, security log ingestion travels over public Azure Data Collection Endpoints by default. The connection is encrypted, and the data arrives correctly — but the endpoint is publicly reachable, and so is the workspace itself, queryable from any browser on any network. For many organisations, that trade-off is fine. For others — regulated industries, healthcare, financial services, critical infrastructure — it is the exact problem they need to solve. Azure Monitor Private Link Scope (AMPLS) is how you solve it. What AMPLS Actually Does AMPLS is a single Azure resource that wraps your monitoring pipeline and controls two settings: Where logs are allowed to go (ingestion mode: Open or PrivateOnly) Where analysts are allowed to query from (query mode: Open or PrivateOnly) Change those two settings and you fundamentally change the security posture — not as a policy recommendation, but as a hard platform enforcement. Set ingestion to PrivateOnly and the public endpoint stops working. It does not fall back gracefully. It returns an error. That is the point. It is not a firewall rule someone can bypass or a policy someone can override. Control is baked in at the infrastructure level. Three Patterns — One Spectrum There is no universally correct answer. The right architecture depends on your organisation's risk appetite, existing network infrastructure, and how much operational complexity your team can realistically manage. These three patterns cover the full range: Architecture 1 — Open / Public (Basic) No AMPLS. Logs travel to public Data Collection Endpoints over the internet. The workspace is open to queries from anywhere. This is the default — operational in minutes with zero network setup. Cloud service connectors (Microsoft 365, Defender, third-party) work immediately because they are server-side/API/Graph pulls and are unaffected by AMPLS. Azure Monitor Agents and Azure Arc agents handle ingestion from cloud or on-prem machines via public network. Simplicity: 9/10 | Security: 6/10 Good for: Dev environments, teams getting started, low-sensitivity workloads Architecture 2 — Hybrid: Private Ingestion, Open Queries (Recommended for most) AMPLS is in place. Ingestion is locked to PrivateOnly — logs from virtual machines travel through a Private Endpoint inside your own network, never touching a public route. On-premises or hybrid machines connect through Azure Arc over VPN or a dedicated circuit and feed into the same private pipeline. Query access stays open, so analysts can work from anywhere without needing a VPN/Jumpbox to reach the Sentinel portal — the investigation workflow stays flexible, but the log ingestion path is fully ring-fenced. You can also split ingestion mode per DCE if you need some sources public and some private. This is the architecture most organisations land on as their steady state. Simplicity: 6/10 | Security: 8/10 Good for: Organisations with mixed cloud and on-premises estates that need private ingestion without restricting analyst access Architecture 3 — Fully Private (Maximum Control) Infrastructure is essentially identical to Architecture 2 — AMPLS, Private Endpoints, Private DNS zones, VPN or dedicated circuit, Azure Arc for on-premises machines. The single difference: query mode is also set to PrivateOnly. Analysts can only reach Sentinel from inside the private network. VPN or Jumpbox required to access the portal. Both the pipe that carries logs in and the channel analysts use to read them are fully contained within the defined boundary. This is the right choice when your organisation needs to demonstrate — not just claim — that security data never moves outside a defined network perimeter. Simplicity: 2/10 | Security: 10/10 Good for: Organisations with strict data boundary requirements (regulated industries, audit, compliance mandates) Quick Reference — Which Pattern Fits? Scenario Architecture Getting started / low-sensitivity workloads Arch 1 — No network setup, public endpoints accepted Private log ingestion, analysts work anywhere Arch 2 — AMPLS PrivateOnly ingestion, query mode open Both ingestion and queries must be fully private Arch 3 — Same as Arch 2 + query mode set to PrivateOnly One thing all three share: Microsoft 365, Entra ID, and Defender connectors work in every pattern — they are server-side pulls by Sentinel and are not affected by your network posture. Please feel free to reach out if you have any questions regarding the information provided.1KViews3likes2Comments