ai
376 TopicsModernize Any Integration Platform to Azure Logic Apps Standard with the Logic Apps Migration Agent
Explore the open-source Logic Apps Migration Agent Enterprise integration is entering a new era Enterprise integration platforms have powered business-critical processes for decades. They connect applications, data, partners, devices, and industries, often carrying transactions that an organization cannot afford to interrupt. Expectations have changed. Organizations want cloud-native architectures, AI-assisted automation, stronger governance, improved developer productivity, and faster response to business change. Yet many integration estates contain years of accumulated dependencies, custom code, transformations, operational procedures, and platform-specific knowledge. The challenge is not simply moving an orchestration or flow from one runtime to another. This is not lift and shift. It is a refactoring exercise that preserves business intent and expected behavior while translating source-platform constructs into cloud-ready workflows, connectors, code, operational patterns, and deployment practices for Azure Logic Apps Standard. That is why we created the Logic Apps Migration Agent. Introducing the Logic Apps Migration Agent: An Open-source project to provide an AI End-to-End Modernization Experience The Logic Apps Migration Agent is an open-source Visual Studio Code extension that provides an AI-assisted, end-to-end modernization experience. It uses GitHub Copilot and the Visual Studio Code Language Model API to guide teams through a structured five-stage workflow, while keeping people in control at every stage. Rather than treating modernization as a single conversion step, the agent helps teams discover what they have, understand dependencies, design an appropriate target, generate baseline implementation artifacts, validate expected behavior, and prepare the solution for deployment to Azure Logic Apps Standard. Refactor the implementation, preserve the business intent Lift and shift attempts to reproduce the source platform as closely as possible in a new environment. That approach can carry forward legacy topology, operational assumptions, platform-specific patterns, and technical debt. The Migration Agent supports a different outcome. It uses the source implementation as evidence of the required business behavior, then helps teams design and generate an appropriate Logic Apps Standard implementation. Some components may map directly, while others require restructuring, consolidation, decomposition, replacement, or custom implementation. The objective is functional and semantic continuity, not structural duplication. A successful migration should preserve contracts, transformations, routing rules, ordering requirements, error behavior, and essential business outcomes while allowing the target solution to adopt Azure-native identity, connectivity, observability, resiliency, deployment, and operating practices. Preserve what the integration must do. Refactor how it does it. Start by understanding what you have For many organizations, discovery is one of the most difficult parts of modernization. Documentation may be incomplete, original developers may no longer be available, and relationships between applications, endpoints, schemas, maps, pipelines, and custom components may be difficult to reconstruct. The Migration Agent scans the source project, catalogs supported artifacts, organizes related components into flow groups, and identifies dependencies and migration gaps. It can also generate architecture and message-flow visualizations for review before conversion begins. This discovery output becomes the foundation for migration sequencing, refactoring decisions, effort discussions, and risk management. Use AI to accelerate the work, not remove accountability The Migration Agent uses specialized GitHub Copilot agents for analysis, planning, and conversion. AI helps interpret source artifacts, propose mappings, create task plans, and generate baseline Logic Apps artifacts. Enterprise integration, however, requires more than plausible code generation. Human-in-the-loop checkpoints let teams review discovered flows, resolve missing dependencies, reshape the proposed architecture, approve conversion plans, and validate generated behavior before progressing. This combines the speed of AI assistance with the governance and technical review required for mission-critical integration. Modernize incrementally and reduce migration risk Large integration estates do not need a single big-bang program. The Migration Agent organizes work into logical flow groups so teams can refactor one business capability or integration path at a time. Prioritize workloads by business value, risk, complexity, or platform urgency. Validate target architecture and operating patterns with a representative first migration. Run phased cutovers and coexistence strategies when required. Apply reusable refactoring patterns, templates, and engineering standards to subsequent waves. A phased approach helps teams build experience with Azure Logic Apps while reducing migration risk and preserving delivery momentum. Bring your own tests and validate continuously Migration confidence depends on behavior, not structural similarity. The agent supports validation using source specifications, sample files, test cases, and customer-provided black-box tests. This helps compare expected inputs and outputs and identify semantic differences earlier. Generated artifacts are a baseline. Domain-specific transformations, error-handling behavior, performance characteristics, security controls, and edge cases still require customer and partner expertise. Built for BizTalk today and extensible for other platforms BizTalk Server 2016 and BizTalk Server 2020 are the first fully implemented source platforms. MuleSoft Anypoint support is represented as an in-progress built-in parser. The architecture is open and extensible so contributors can add parsers and platform-specific migration capabilities for other integration technologies. That extensibility is central to the vision. A common modernization workflow can help teams apply consistent governance, target patterns, refactoring practices, and validation across mixed integration estates. Why Azure Logic Apps Standard? Azure Logic Apps Standard provides a modern destination with a local project structure, Visual Studio Code development experience, source-control alignment, CI/CD support, stateful and stateless workflows, enterprise connectivity, and Azure and hybrid deployment options. Modernization is not about reproducing a legacy topology component by component. The target design should be optimized for Logic Apps Standard rather than constrained by the source architecture. The migration preserves valuable business logic while refactoring the implementation around modern practices for identity, networking, observability, reliability, deployment, and operations. What your team should still own The Migration Agent accelerates repeatable work, but it does not replace the decisions that define a production-ready integration platform. Responsibility Refactoring focus Target architecture Refactor application and workflow boundaries for Logic Apps Standard. Select reliability, networking, deployment, and supporting Azure patterns rather than copying the source topology. Semantic equivalence Validate contracts, mappings, transformations, business rules, error behavior, ordering, retries, and edge cases. Capability gaps Redesign source capabilities without direct equivalents using connectors, custom code, local functions, API Management, Service Bus, or other appropriate Azure patterns. Production hardening Implement identity, secrets management, security policies, monitoring, cost controls, performance testing, resiliency, and operational ownership. Cutover and coexistence Plan backlog reconciliation, dual-run periods, data consistency, partner coordination, rollback, and decommissioning. More mission critical features for Logic Apps Standard and Hybrid We are weeks away from shipping the following features, aimed at any customers in the Enterprise Application Integration space: HL7 In-App operations in general availability. MLLP Receive/Send In-App connector in Public Preview. Rules Engine In-App operation for XML facts in Public Preview. MSMQ In-App connector in Public Preview. Oracle DB In-App connector in Public Preview. Flat File generation In-App operations in Public Preview. Integration accounts support (Hybrid On premises). NMS In-App connector in Public Preview. Improvements to our EDI capabilities. BizTalk Mapper to Data Mapper Migration path What about other integration platforms? Yes—the Logic Apps Migration Agent is designed to be customizable so you can migrate from any integration platform to Logic Apps (not just BizTalk). The open architecture lets you plug in new discovery, analysis, and conversion skills for the source product you’re modernizing, while keeping the same stage-gated workflow and human-in-the-loop checkpoints. We provide guidance and examples to help you extend the agent for other platforms than BizTalk —so you can tailor mappings, transformation rules, and validation to your customer’s standards and target patterns in Logic Apps. Benefits Faster time to value with a guided process: A structured discovery→planning→conversion workflow reduces uncertainty and helps teams move from assessment to execution with clear checkpoints. Higher confidence migrations: Human-in-the-loop validation, artifacts generation, and black-box testing support mission‑critical correctness and governance. Customizable for your source platform and standards: Extend the agent with product-specific discovery and conversion steps, tailor mappings and transformation rules, and align outputs with your target Logic Apps patterns and engineering conventions. Open-source transparency and control: Review how the tool works end-to-end, validate what it produces, and adopt changes at your pace without waiting for a closed release cycle. Community-driven innovation: Benefit from contributions across Microsoft, partners, and customers—new adapters, mapping packs, and best practices can be shared and reused. Lower total migration cost: Automating repeatable tasks reduces manual effort while preserving the ability to invest partner expertise where it matters most (architecture, governance, reliability, and operations). Reusable accelerators for partners: Partners can create differentiated offerings by packaging templates, validation suites, CI/CD pipelines, and domain-specific patterns on top of the agent. An accelerator for customers and partners For customers, the Migration Agent provides a practical starting point and a consistent process for moving from assessment to a refactored implementation. For professional services organizations and system integrators, the agent augments delivery rather than replacing it. Automating inventory, analysis, baseline generation, and validation scaffolding allows experts to focus on architecture, governance, security, reliability, domain-specific transformation, DevOps, performance, cutover, and operating-model change. Because the project is open source, partners can contribute parsers or package reusable templates, mapping packs, test suites, CI/CD assets, and industry-specific modernization patterns. Review our public documentation here: https://learn.microsoft.com/en-us/azure/logic-apps/migration/migration-agent-overview How to get started Download VSCode and install the Logic Apps Migration Agent extension. Organize source projects and dependencies in a clear directory structure. Include project files, bindings, schemas, maps, pipelines, orchestrations, custom code, configuration, certificates or certificate references, and available documentation. Once you have all your artifacts ready, point the Migration Agent to the directory with all the artifacts. Review every migration stage. Confirm the discovered architecture, resolve missing dependencies, and refine the target design before authorizing conversion. Prepare a representative test environment. The workstation running Visual Studio Code must be able to reach the systems needed for local or end-to-end validation. Bring known inputs, expected outputs, specifications, and existing test cases whenever possible. These materials improve validation and reduce ambiguity. Treat the first migration as a reusable foundation. Capture architecture patterns, naming standards, deployment templates, observability practices, and lessons that can accelerate subsequent waves. Use Claude Opus 4.8 or higher. Make sure you increase the Maximum number of requests for the Copilot Chat as follows (we recommend changing the value from 60 to 1000) Check the following video for a demonstration on how the Agent works and let us know if you have any questions in the comments.2.4KViews2likes1CommentSecure Sensitive AI on Azure Confidential Computing with NVIDIA and Protopia
Your most valuable AI use cases often involve your most sensitive information: customer records, claims, clinical notes, and transaction histories. Dedicated infrastructure can offer control, but it can also limit access to flexible cloud capacity. The opportunity is to expand where that work can run without treating data protection as an afterthought. For a team exploring claims review or clinical-note analysis, the question is not simply whether a model can run in the cloud. It is where sensitive information could be exposed along the journey from application to model and back. Enterprises want to run their highest-value inference on the same scalable cloud they already run everything else on. The catch is that the highest-value inference is usually the most sensitive: customer records, claims and underwriting packets, clinical notes, transaction histories. Data policy keeps that work off shared, multi-tenant capacity and pins it to dedicated, single-tenant deployments. That is the isolation tax: the most valuable, most token-heavy workloads are exactly the ones kept off the infrastructure built to run them, so dedicated capacity sits underused and costs more than it should. Microsoft Foundry already gives this work an enterprise platform: a model catalog that now includes NVIDIA Nemotron, managed and serverless endpoints, and the governance regulated industries require. What has been missing is a way to run sensitive agentic workflows on that shared capacity while reducing the risk of data exposure. The trust dilemma on public cloud Azure Confidential Computing (ACC) addresses a fundamental trust challenge for AI workloads in multi-tenant cloud environments: the model, infrastructure, and data may each be owned or controlled by different parties. Model owners need to protect proprietary weights and intellectual property, and data owners need safeguards for sensitive information throughout processing. ACC provides the trusted foundation for addressing these requirements by helping protect models and their execution from unauthorized host access while enabling additional safeguards across the inference data path. The reference architecture brings together Azure Confidential Computing with NVIDIA H100 GPU capabilities and Protopia AI’s Stained Glass Transform to provide layered protection for sensitive AI workloads running at Azure scale. Confidential Computing: securing the model with NVIDIA Confidential Computing is designed to protect data and AI models while they are in use inside the enclave. The NVIDIA Hopper architecture introduced GPU-based confidential computing, extending the hardware trusted execution environment from the CPU to the GPU so that model weights, activations, and execution state remain within an attested boundary and are designed to be inaccessible to the host operating system, hypervisor, and infrastructure operator. NVIDIA device attestation provides cryptographic evidence about the GPU’s identity and security state before keys are released. For a model owner, these controls are designed to restrict access to model IP while the model runs. Enterprises should not have to choose between protecting their models and running them where compute is available and most convenient. NVIDIA has designed Confidential Computing to keep a model’s weights and execution within the GPU’s trusted execution environment, helping proprietary models run on shared infrastructure while limiting access to their IP. Combined with Protopia’s inference data protection on Azure, customers have a path designed to support sensitive AI workloads in the cloud they already trust. Bring confidential inference to Azure Azure brings confidential inference to production scale, surrounding the confidential GPU with the platform an enterprise needs to operate AI. The Azure NCCads H100 v5 series combines 4th-generation AMD EPYC confidential VMs with NVIDIA H100 Tensor Core GPUs to support confidential AI workloads. The trusted execution environment spans the AMD SEV-SNP CPU and the attached H100 in confidential mode, isolating GPU memory and the channel between CPU and GPU. When enabled and properly configured, Confidential Computing is designed to help limit access to unencrypted customer data within that boundary, including the cloud operator. Azure provides tools to help verify and operate the boundary: Microsoft Azure Attestation (MAA) can assess the confidential VM, while Azure Key Vault Managed HSM can be configured to release decryption keys after successful attestation. "Azure was the first cloud to bring Confidential Computing to NVIDIA H100 GPUs, so customers can protect their data in use, even from the cloud operator, while getting the performance they need for AI. Paired with Protopia’s Stained Glass Transform, this reference architecture protects data across the full inference path, helping regulated organizations bring their most sensitive agentic workloads to Azure.“ - Vikas Bhatia, Head of Product, Azure Confidential Computing, Microsoft Protecting the inference data path Confidential execution does not, by itself, cover every component of a managed inference service. Gateways, logs, traces, caches, and scheduler metadata can sit outside the trusted execution environment. Protopia AI’s Stained Glass Transform (SGT) converts sensitive inputs into protected representations inside the data owner’s trust boundary. The architecture is designed for downstream components to receive those representations, not the original inputs. An SGT-enabled model reasons over them directly, without a host-side decoder. Security teams should inspect the serving layer to verify that this pattern is implemented as intended. This distinction matters when reviewing a service: an attested GPU does not establish how a gateway or cache handles requests. Start with a map of the data flow, then check the controls at each boundary. “Sensitive AI should not automatically mean having to operate every part of the infrastructure yourself. Applying Stained Glass Transform inside the data owner's trust boundary, or within confidential execution on Azure, offers a way to securely deploy to the cloud without exposing sensitive data to the model hosting environment (other tenants or operator), and retaining the data owner's control over their sensitive enterprise data.” - Eiman Ebrahimi, Co-Founder and CEO, Protopia AI From customer boundary to confidential inference At the data owner’s trust boundary, the Stained Glass Proxy, an OpenAI-compatible sidecar, applies the Stained Glass Transform to the prompt and its context, with no changes to the upstream stack. In transit to Azure, the architecture sends the protected representation beyond the customer’s trust boundary rather than the original plaintext input, reducing the likelihood that sensitive plaintext is captured in downstream logs, caches, or interception points. In-transit encryption is used as standard. On Azure NCCads H100 v5 confidential VMs, the request reaches an SGT-enabled model endpoint. Configure and verify confidential execution, attestation, and key-release policies for the chosen serving stack. Across the serving path, verify that components outside the execution boundary handle protected representations rather than original sensitive inputs, including logs, caches, and traces. On return, the client receives a result intended to be interpretable within the data owner’s environment. Expand your options for sensitive AI For enterprises, the value comes down to expanding where sensitive AI workloads can run while maintaining strong protections for models and data. Azure Confidential Computing provides a trusted foundation for running sensitive AI workloads on Azure, helping protect models and data while in use and enabling organizations to take advantage of Azure’s scalable GPU infrastructure. Depending on the workload and deployment configuration, this approach may provide greater infrastructure flexibility and utilization while helping organizations manage performance, model quality, and cost. Learn more Azure Confidential GPU Options💲Announcing Free Grant and Pricing for Logic Apps Automation
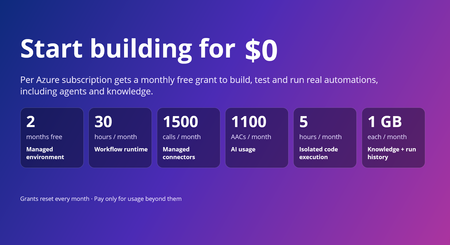
Today, we're announcing pricing for Azure Logic Apps Automation, now in public preview, along with monthly free grants that make it easier to start building, experimenting, and bringing automations to life. Logic Apps Automation is Azure's fully managed platform for business process automation and orchestration, including AI-powered automation. It's built for every builder with an automation problem, not just developers, and the free grants make it easy to go from idea to a working automation without a purchase decision up front. The free grant covers one managed environment per subscription and includes usage across key Logic Apps Automation capabilities, so you can start with your first use case, experiment with AI-powered automation, and run workloads in production within the included limits; then move to paid usage as your needs grow. Start today @ https://auto.azure.com/ Start free with monthly grants Every Azure subscription gets a monthly free grant across the platform. The only exception is Managed Environment which is a one-time free grant for first 60 days. When the usage stays within these limits you pay nothing. When it goes beyond these limits, you pay only for the additional usage. Usage Component Monthly free grant (per subscription) Core Platform Managed environment One environment, free for the first 60 days (2 months) Core Platform Workflow runtime 108,000 execution-seconds (about 30 hours) Core Platform Data retention 1 GB Optional Capabilities Managed connector calls 1,000 Standard + 500 Enterprise Optional Capabilities Knowledge storage 1 GB Optional Capabilities AI usage 1,100 AACs Optional Capabilities Isolated code execution 18,000 seconds (about 5 hours) What this means in practice Explore the platform, not a trimmed-down experience. The grants include workflow runtime, AI usage, knowledge, connectors, and sandboxed code, so you can explore every capability from day one. Build and iterate without watching the meter. With approximately 30 hours of execution time included each month, you can author, test, and run workflows as you build out your automation. Scale into paid usage as your needs grow. Grants reset every month, and you pay only for usage beyond them. Simple, usage-based pricing Beyond the included grants, Logic Apps Automation uses a pay-as-you-go pricing model across the capabilities your automations use. Billing has two parts: Core Platform: the managed environment, workflow runtime, and run-history retention that provide the foundation for your automations. Optional Capabilities: AI usage, knowledge storage, isolated code execution via sandbox and managed connectors, billed only when your workflows use them. For rates, regional pricing, and a worked monthly cost example, see Azure Logic Apps Automation pricing. How does the free grant works The free grant applies to the first environment you create in a subscription. Look for the Free tag next to an environment's name to see which is the free one Free environment period: The managed environment is free for 60 days, starting from the time you create it. Existing customers: If you already use Logic Apps Automation, create a new environment to use the free grant. The first new environment you create in your subscription receives it. Track your usage: In your environment, go to Settings and select the Free Grants tab to see your monthly limits and how much you've used. Important: Free grants are tied to the free environment. If you delete your free environment, you lose the ability to use the free grants, and you can't get them back by creating a new environment. Availability Logic Apps Automation is in public preview in Australia East, East Asia, North Central US, Southeast Asia, Sweden Central, UK South, and West US. Preview pricing and availability may change before general availability. Get started If you already have an Azure subscription, your included grants are available to help you start building today. Create your first Automation project, start from a template or with the AI workflow assistant, and explore what you can build with Logic Apps Automation. Get started with Logic Apps Automation Quickstart: build your first workflow Read the full pricing details MS Learn documentation Watch the Logic Apps Automation video series Share feedback or request a feature, or just let us know what you build with Automation!534Views0likes0Comments
Web IQ: Web Search and Grounding APIs for AI Agents
Web IQ gives AI agents current, citable evidence from across the web. We explain what it is, how its four layers (Bing's web substrate, Harrier embeddings, DiskANN, and structured evidence) work together, and how it pairs with Microsoft IQ to ground agents in web and enterprise context.SQL developer tools at SQL Modernization Day
SQL developers can now do most of their database work without leaving VS Code. The MSSQL extension ships updates every month, GitHub Copilot understands your schema, and the Microsoft SQL drivers keep pace with SQL Server 2025. And new Microsoft SQL skills, now in public preview, let your coding agent assess and migrate SQL Server to Azure SQL. Here's what's new across the toolchain, and where to see it in action at SQL Modernization Day on October 20. What's new in the MSSQL extension for VS Code The MSSQL extension connects to SQL Server, Azure SQL and SQL database in Fabric from the editor you already use. It now covers far more than connecting and running queries. Versions 1.40 and 1.41 added the following. Generally available Database management. Backup and restore, plus dialogs to create, rename and drop databases. View and edit data directly in the table view. DACPAC and BACPAC extract, deploy, import and export for moving databases between environments. Fabric integration to browse workspaces and provision SQL databases in Fabric. SQL database projects with a publish dialog and code analysis. Azure Data Studio migration toolkit that brings over your connections, settings and key bindings. Public preview Query Profiler for real-time activity monitoring with Extended Events. Flat file import to turn a CSV or TXT file into a new table. Database object search across tables, views, stored procedures and more, with scripting options. SQL Notebooks that mix SQL and Python kernels in one notebook. Schema Designer and data API design with GitHub Copilot, plus an application quickstart. Need a local database? The extension can spin up a SQL Server 2025 container in a few clicks. It checks prerequisites, sets up the container and adds the connection to Object Explorer for you. Build with GitHub Copilot and your schema GitHub Copilot is built into the MSSQL extension. In agent mode it reads your actual tables, columns and relationships, along with your workspace and open files. It uses the same connection and permissions as the extension, and it asks you to approve tool actions before they run. Here's some of what you can hand off: Chat with the mssql participant for SQL guidance, or let agent mode connect, list servers and run queries. Generate tables and relationships, then review them as a diff before anything reaches the database. Write T-SQL or ORM queries from plain language, and get explanations of stored procedures, views and complex joins. Generate realistic test data from your current schema. Configure Data API builder in natural language to expose tables as REST, GraphQL or MCP endpoints. Try it: from idea to an AI-ready app The library app sample walks through a full build in three steps: Spin it up. Create a local SQL Server 2025 container from the extension and seed the database. Wire it up. Have Copilot turn hardcoded app data into new tables and relationships, generate test data, and stand up a read-only REST API with Data API builder. Light it up. Add a native VECTOR column, generate embeddings, and use VECTOR_DISTANCE for semantic search behind a RAG chatbot. The repo includes a PRD and GitHub Copilot custom instructions, so Copilot follows your naming conventions and targets SQL Server without repeating yourself in every prompt. Coming next: Azure SQL Developer runs the Azure SQL Database engine locally for development, so you can build in your inner loop and deploy to Azure with no code changes. It's in gated preview, and you can sign up at aka.ms/azuresql-developer. Assess and migrate with Microsoft SQL skills Microsoft SQL skills, now in public preview, bring SQL Server migration expertise to the coding agent you already use. Skills are packaged instructions and scripts that an agent loads when a task calls for them. You ask for an assessment or a migration in plain language, and the agent picks the right skill for each step. The skills live in one central library, so they work the same way in GitHub Copilot, VS Code, Claude and Cursor. They cover the whole journey: Assess readiness, blockers and dependencies. Recommend a target, SKU and cost. Plan prerequisites and remediation. Migrate with BACPAC, or with Log Replay Service (LRS) and managed identity. Validate with post-move checks and guided fixes. You stay in control the whole way. The agent asks before it runs commands, and you approve its recommendation before anything moves. An assessment you can act on The assessment skills look at your estate through four lenses and turn discovery data into an Azure SQL recommendation you can defend. Lens Question What it checks Compatibility Can the workload move? Feature support, breaking changes, blockers and the remediation path Assessability Is there enough evidence? Inventory coverage, assessment status, data freshness and confidence gaps Sizing What capacity does it need? CPU, memory, I/O and storage demand, mapped to a compute tier with headroom Pricing What will it cost? SKU and service tier, region, licensing including Azure Hybrid Benefit, and a monthly estimate Here's how that plays out. Ask GitHub Copilot in VS Code to assess a SQL Server 2016 instance for Azure SQL Database Hyperscale. The agent checks that the Azure CLI and its data migration extension are installed, runs the assessment and reports readiness database by database. A database that uses Service Broker gets flagged, since Azure SQL Database doesn't support it, along with the fix. You also get an HTML report that compares Hyperscale, Azure SQL Managed Instance and SQL Server on Azure VMs, with a monthly cost estimate and a SKU recommendation for each database. A migration that picks up where it left off Next, ask the agent to migrate one of those databases. It confirms SqlPackage is installed, checks that the source is online and builds a migration plan. The plan names the source and target servers and the method, an offline BACPAC export and import. It creates a new database and never overwrites an existing one, and the source isn't modified. If the export fails, the agent saves a checkpoint and diagnostics. Once you fix the source, it retries only the failed step instead of starting over, then validates the result. Explore the skills at aka.ms/microsoftsql-skills. For the full set of migration tools, including Azure Migrate, Azure Database Migration Service and migration through Azure Arc, see the database migration guide. Microsoft SQL skills are in public preview. Preview features are provided without a service level agreement and aren't recommended for production workloads. Put your database under source control with SQL projects SDK-style SQL projects (Microsoft.Build.Sql) treat your database like any other codebase. A build produces a .dacpac you can deploy to new or existing databases across SQL Server, Azure SQL and SQL database in Fabric. You can work with SQL projects in VS Code, SSMS and Visual Studio. Cross-platform builds with plain dotnet build. Every .sql file in the folder is included by default. Code analysis on build with 14 default rules. Add custom rule sets as package references, and promote any rule to a build error. Package references for shared objects and cross-database references, so objects that rarely change don't slow down every build. Extract an existing database into a SQL project with SqlPackage, installed as a dotnet tool. Schema compare across databases, SQL projects and .dacpac files. A typical pipeline looks like this: A developer proposes a change in a pull request. CI builds the project and runs code analysis. The team approves and merges to main. The pipeline calculates a deployment plan against staging or production. Someone reviews the plan as a script or deploy report and approves the release. GitHub environments and Azure DevOps approvals handle that last gate. SQL projects also help as AI agents write more of your code. Every database change lands as a reviewable diff, and changes from several agents or teammates merge like any other code. Get started at aka.ms/sqlprojects or work through the SQL DevOps workshop. What's new in the Microsoft SQL drivers The Microsoft SQL drivers all shipped new releases, including several of the fixes the community asked for most. Driver Release Highlights Microsoft.Data.SqlClient (.NET) 7.0 The core package drops its Azure dependencies. Entra auth moves to Microsoft.Data.SqlClient.Extensions.Azure with no code changes. New pluggable SSPI auth, .NET 10 support, and ActiveDirectoryPassword marked obsolete. JDBC 13.4 FLOAT16 vector support for embeddings, a new performance logger, Java 25 LTS and SQL Server 2025 support. mssql-python 1.4 A public bulk copy API with a Rust-powered core, spatial types, and type hints for mypy and Pyright. mssql-django 1.7 Django 6.0 and Python 3.14, composite primary keys, SQL Server 2025, and ODBC Driver 18 as the default. PHP (sqlsrv, pdo_sqlsrv) 5.13 PHP 8.4 and 8.5, SQL Server 2025, newer Linux and macOS platforms, and a fix for a Fabric connectivity crash. New to the Python driver? Start with the mssql-python quickstart. See it live at SQL Modernization Day Amit Khandelwal's session, Migrate to Azure SQL. Then Build Something New., puts these tools together at 10:00 AM PT on Tuesday, October 20. He covers the path off on-premises SQL Server, then builds on Azure SQL Database with VS Code, GitHub Copilot, the latest drivers and the SQL MCP Server. Expect demos of the developer workflow, not only the migration. SQL Modernization Day is a free livestream on Microsoft Reactor with eight sessions from the Microsoft SQL team. Register at aka.ms/SQLModernizationDay2026.From Chat to Decisions: Bringing SLMs into Application Logic with Microsoft Olive and ONNX
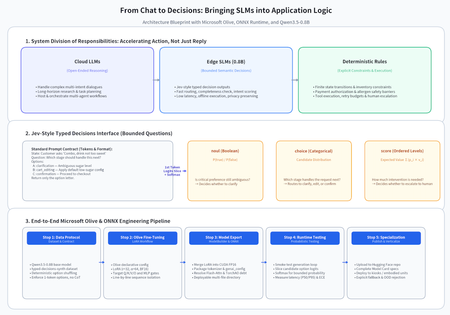
1. Why Jev Matters: Accelerating the Next Action, Not Just the Next Reply Let us return to the automated ordering scenario we have been exploring. A customer says, “I’ll have a combo, but make the drink not too sweet.” A conversational model can produce a friendly response. For the ordering application, however, the real work is just beginning. Has the customer selected a particular combo? Does “not too sweet” map to a supported customization? Should the application ask a question, update the cart, or move to confirmation? The application does not need another paragraph. It needs a decision that advances the workflow. Traditional rules are excellent at explicit constraints: unavailable items cannot be ordered, checkout requires confirmation, and payment requires authorization. Models should not replace these rules. But as inputs become ambiguous and context-dependent, rule trees accumulate branches. At the other extreme, sending every small routing decision through a large model’s reasoning and generation loop can add unnecessary waiting. This is how I think about the value of Jev: turn semantic understanding into structured behavioral decisions, shortening the distance between understanding and action. An ordering application might decompose the conversation into a few bounded questions: Decision Output type Effect on the workflow Is a critical preference still ambiguous? noul: probability for a Boolean question Decide whether to clarify Which stage should handle the request next? choice: candidate action and distribution Route to clarification, cart editing, or confirmation How much human intervention is needed? score: expected value over ordered levels Decide whether to escalate These outputs are not permissions. A model can recommend confirmation, but that recommendation must not bypass inventory checks, allergen rules, or payment authorization. The application still needs explicit state transitions, constraints, and tool boundaries. The lesson I take from our ordering exploration is that structure does more than make an answer easier to parse: it can remove unnecessary decision steps from an agent’s workflow. If questions, options, and execution boundaries are defined in advance, the model does not have to reinvent the process on every turn. One distinction matters before we continue. This project does not fine-tune an official Jev model or reproduce its private implementation. It borrows the Jev-style typed-decision interface idea, follows the prompt conventions of the open-source Hmm project, and explores a deployable component built from our own small model. 2. Where Edge SLMs Fit: Put the Decision Close to the Action Beyond basic rules, the opportunity that interests me most is in vertical applications: can a model make a useful semantic decision where the action actually happens? An SLM—a small language model—is not automatically an edge-ready model. Model size, context length, runtime, memory, and hardware all determine whether it fits a target device. Nevertheless, small models suggest a useful division of responsibilities: Use large models for open-ended problems, small models for frequent and bounded semantic decisions, and deterministic code for constraints and execution. From ordering terminals to embodied systems At an ordering terminal, a local model could recognize a modification request, assess whether required information is complete, and select the appropriate business module. Some decisions could continue during network disruption, and sensitive context could avoid unnecessary transmission. Those benefits depend on the application’s complete data flow, not merely on storing model weights locally. In an embodied system, similar questions become task-level intent decisions: “Is the user asking the robot to approach, or only describing a location?” “Should the task continue, or wait for clarification?” There is an essential boundary here. A language model may participate in task-level decisions, but it should not be the sole mechanism for collision avoidance, emergency stopping, or low-level motion control. Millisecond-scale responsiveness is a worthwhile engineering objective—not an automatic consequence of using a small model or exporting to ONNX. We need to measure the complete path on the target device: input processing, inference, policy evaluation, and tool execution. From one assistant to multi-agent orchestration Multi-agent systems offer another opportunity. A complex request may involve research, planning, execution, and verification, but not every handoff requires an open-ended discussion. A local decision component might determine: Which agent should receive the request? Is the information required for execution complete? Does a tool result need independent review? Should the workflow continue, retry, or ask a human? I am exploring how hosted agents can handle longer orchestration flows while constrained autonomous execution moves work forward. Small models could serve as frequent, local decision points within that design. “Autonomous” does not mean unrestricted: tool permissions, timeouts, retry budgets, and human approval remain application responsibilities. This is a compelling role for ONNX: package a learned decision capability into an artifact that an inference runtime can load, without requiring every deployment target to carry the full training stack. However, ONNX is a deployment path, not a guarantee of portability or performance across all hardware. This workflow exports a CUDA FP16 model. Moving it to a CPU, mobile device, or NPU requires compatible execution providers and operators, and potentially re-export, quantization, and regression evaluation. 3. Fine-Tune a General Decision Component, Then Specialize It Rather than beginning with a complex industry system, I started with a general typed-decision experiment: Qwen3.5-0.8B → Olive LoRA fine-tuning → Olive ModelBuilder export → ONNX probability testing → a Hugging Face publishing workflow. The implementation lives in Qwen3_5_0.8B_FT.ipynb. Its purpose is not to claim that a notebook solves a vertical market. It makes the path from data to a deployable decision capability concrete. Stop one: learn a bounded choice, not a long answer The base model is Qwen/Qwen3.5-0.8B, and the dataset is n4ze3m/typed-decisions-synth. A state can contain several questions. Preprocessing expands each question into a training example while preserving the dataset’s case-level training and validation split. That prevents questions about the same state from leaking across the boundary. Each question becomes a choice among option letters: State (data to evaluate): Help! My payouts have failed for 3 days. I need the money today. Question: Which team should handle this? Options: A: billing — Payments, invoicing, refunds B: technical — Bugs, outages, integrations C: sales — Pricing, upgrades, new accounts Return only the option letter. choice represents categorical options, noul uses false / true, and score uses ordered levels. During preprocessing, choice options are shuffled deterministically using the state and question ID to reduce fixed-position bias. Score levels and Boolean options keep their intended ordering. Several small details protect the contract: use the same chat template, disable thinking, verify that training text begins with the inference prompt, verify that each option letter is one token, and discard examples longer than 768 tokens rather than blindly truncating them. This is not cosmetic data cleanup. It defines the protocol between the model and its application. Stop two: turn experiment settings into an inspectable Olive workflow The notebook builds Microsoft Olive from a fixed source revision. It uses olive finetune --dry_run to generate a version-matched configuration, then adjusts preprocessing and validation. Setting Notebook configuration Fine-tuning method LoRA, rank 32, alpha 64 Target modules q_proj/k_proj/v_proj/o_proj and gate_proj/up_proj/down_proj Learning rate and epochs 1e-4, one epoch Sequence length 768 Per-device batch / gradient accumulation 1 / 16 Training / export precision BF16 / FP16 Preprocessing line-by-line, one sequence per question Replacing the default JOIN strategy avoids concatenating independent questions into continuous text. Before training, RunConfig.model_validate(...) checks the configuration. Execution uses Olive’s Python API so failures remain visible in the notebook rather than being hidden behind a generic CalledProcessError. An important difference must remain explicit: this Olive workflow uses standard full-sequence language-model SFT, not Hmm’s candidate-letter hard-label / teacher soft-label mixture. Teacher probabilities are retained for analysis but do not contribute to this training loss. Consequently, Hmm’s accuracy and calibration results cannot be claimed for this 0.8B model. Stop three: export the runtime contract, not just the graph A LoRA adapter is not the deployment endpoint. The base model, adapter, tokenizer, configuration, and runtime must agree. The notebook uses Olive ModelBuilder to export the base model and adapter into CUDA FP16 ONNX. The result includes more than an .onnx file: external weights, tokenizer resources, and genai_config.json are part of the deployable unit. Consumers should load the complete directory. The most instructive part of the process was navigating version boundaries: Boundary encountered Approach in this workflow An unnecessary old TorchAO package conflicted with Transformers Remove it after dependency installation; standard BF16 LoRA does not require it Qwen3.5 kernels fell back to reference implementations Install and check causal-conv1d and Flash Linear Attention Export requested authentication for a public model Explicitly enable anonymous model access Qwen3.5 stored EOS information in text_config Add the top-level value to the local export configuration Newer CUDA packages did not match the runtime environment Pin the notebook’s ORT GPU 1.26.0 / GenAI CUDA 0.14.0 combination The Olive revision expected newer GenAI Builder APIs Add version-specific compatibility handling for this FP16 export path Text export behaved like a multimodal decoder Set exclude_embeds=False to retain token embeddings These are records of this environment, not universal patches. Compatibility code is technical debt: when upgrading, revisit the interfaces and outputs rather than copying the workaround indefinitely. Pinning an Olive commit also does not make the complete experiment reproducible. A stronger release record should include base-model and dataset revisions, the full dependency set, GPU and driver details, and the final publishing commit. Stop four: ask two different questions in testing The first question is: does the model run? The standalone Python test script loads the export, reads a validation example, generates an answer, and extracts an option letter. This is a smoke test for the model, tokenizer, and generation loop—not the end of quality evaluation. The second question is: can the application use the decision? Following Hmm’s approach, the ONNX probability cell reads logits at the first generated position after the prompt, selects only the valid option-letter logits, and applies softmax: # candidate_logits contains only valid first-token option logits. shifted = candidate_logits - candidate_logits.max() probabilities = np.exp(shifted) probabilities /= probabilities.sum() For options A, B, and C, this is a distribution over those three choices. It does not establish that the candidate set is complete or provide absolute confidence across every possible answer. The application then interprets the result: noul reads P(true), choice selects the highest-probability option, and score computes an expected value over ordered levels. The example’s confidence formula, (n × p_max - 1) / (n - 1), measures how concentrated the distribution is. It is not a calibrated probability of correctness. Evaluation therefore needs several lenses. Accuracy, candidate NLL, and ECE describe decision quality. P50/P95 latency, peak memory, fallback rate, and task completion on the target device describe application value. The notebook’s full validation-metric cell currently uses the PyTorch/PEFT path; the ONNX cell tests example probabilities. The former is not an evaluation report for the latter. Comparing candidate distributions and actual decisions before and after export remains necessary. This article does not claim unrecorded training times, accuracy improvements, or demonstrated millisecond edge latency. Stop five: publication begins the vertical journey The notebook contains a workflow to upload the ONNX directory and a Model Card to lokinfey/Qwen3_5_0.8B_jev. This is the configured publishing destination, not a claim that this article verified the remote upload. The Model Card should explain the base model, dataset, training-objective differences, runtime versions, intended use, and outstanding evaluation. Authentication uses interactive token entry rather than embedding credentials in source files or commit history. Once the general pipeline exists, specialization becomes the important work. In ordering, that means defining real business states and actions: menu version, cart contents, modification history, missing information, mandatory clarification, and operations that always require customer confirmation. Vertical data should reflect those boundaries, with validation splits based on conversations or business entities. Low confidence, out-of-distribution inputs, and rule conflicts need explicit rejection or escalation paths. The objective is not to force a choice for every request. It is to help the system move forward appropriately within known limits. 4. Conclusion: The Opportunity Is a Shorter Decision Path, Not a Smaller Chat Window An ordering clarification, a robot’s task-level intent check, and a local handoff in a multi-agent workflow share the same underlying problem: the system has tools, but it still needs to decide when to use them, who should act, and when to stop. Jev-style structured decisions offer an interface perspective. SLMs offer the possibility of moving some semantic judgments closer to the device. Microsoft Olive organizes fine-tuning and export into a workflow. ONNX Runtime provides an execution path for deployment. Together, they suggest something more useful than a smaller chatbot: a measurable, constrained, replaceable decision component. The direction I want to keep testing combines hosted agents for long-running coordination, edge small models for frequent local decisions, and deterministic code for business and safety boundaries. Success should be measured less by whether the reply sounds intelligent and more by whether the system completes the right action faster and more reliably. That is the next step from conversation to decisions. Implementation and references Fine-tuning notebook Microsoft Olive ONNX Runtime GenAI Qwen3.5-0.8B base model Hmm model card and prompt format typed-decisions-synth dataset204Views2likes0Comments
Update network rules for the API Management service tag
To improve Azure API Management resiliency and scalability, we’re expanding our infrastructure and adding control-plane IP addresses. These addresses are included in the ApiManagement service tag. If you use VNet internal or VNET external with the classic (v1) tiers, check your network security groups (NSGs), user-defined routes (UDRs), and firewalls. Replace hard-coded API Management IP addresses with the service tag wherever supported. Make this change by November 30, 2026, to avoid disruption to management access. If network rules block connectivity to the management endpoint after that date, you may be unable to manage your API Management configuration—such as APIs, operations, and policies—from the Azure portal or CLI. This change affects management-plane traffic only. Runtime traffic, including API calls to your services, is not impacted. Find the ApiManagement tag in Microsoft’s Azure service tags overview or the latest Azure IP Ranges and Service Tags JSON download. If your firewall doesn’t support service tags, use the published list and keep your IP rules synchronized with its latest version. Don’t rely on a fixed, point-in-time IP list. During the transition, the service tag includes both existing and new addresses. For reference: Use API Management in an internal virtual network
Using Jev with Agents in Microsoft Foundry for Model Evaluation
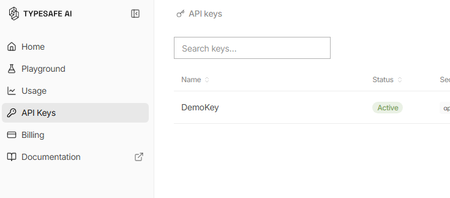
What is Jev? Jev is a new AI model from TypeSafe AI, first released in early access on 15 September 2026. TypeSafe describes Jev as its first “System One” model, designed specifically to make fast, structured decisions rather than generate free-form text. You provide Jev with some state or context and define the judgement you want it to make. It then returns a typed, probabilistic decision, such as: Choice: select from a defined set of options Score: evaluate something against an ordered scale Yes/No probability: determine the probability of a condition being true Unlike a conventional LLM, Jev gives up string generation in favour of type-safe structured values. Their description is essentially unstructured state in, typed probabilistic decisions out Why use Jev? Jev is particularly useful when an application needs to make a judgement rather than generate an answer. For example: Consistent evaluation against explicitly defined criteria Structured outputs that applications can consume directly Classification, assessment, routing and decision-support Agent workflows, where a judgement is required before taking an action Guardrails, such as assessing whether an agent should make a tool call Model routing, where a judgement determines which model or process should handle a request Every decision can also include a confidence or probability, allowing an application to use thresholds to decide when to proceed automatically or when further review is required. Jev and explainability Jev can provide a different approach to explainability for Model-as-a-Service (MaaS) and hosted LLM solutions. Traditional explainability techniques such as SHAP provide feature-attribution explanations for model predictions. Applying these techniques can be more difficult when the model is consumed solely through a hosted API and its internals are not available. Jev does not replace SHAP or provide the same type of feature-attribution explanation. Instead, it can be used as a separate judgement layer, evaluating an LLM's inputs, outputs or proposed actions against explicit criteria and returning structured decisions with confidence scores. For example: LLM generates an answer → Jev evaluates the answer → application decides what to do next This can provide a useful, measurable evaluation layer around otherwise opaque MaaS models. Could you do this with another LLM? Yes you could ask a conventional LLM to classify, score or evaluate an input and request structured JSON output. However, Jev has been purpose-built for this type of workload rather than general-purpose text generation. TypeSafe reports that Jev produces outputs in parallel rather than generating tokens sequentially, and its hosted service currently advertises typical decision latency of approximately 70–500 ms. Pricing As of September 2026, TypeSafe's documentation lists Jev 1.13 (jev-1.13.0) at $0.042 per million input tokens, with output tokens free. It lists rate limits of 250,000 tokens per second and 1,200 requests per minute, although TypeSafe states that these limits can change. As Jev produces decisions rather than generated text, you are effectively paying for the context it evaluates rather than for generated output. Pricing is subject to change and these figures are accurate only as of the date of this article Using Jev with Microsoft Foundry A useful pattern with Microsoft Foundry is to treat Jev as a specialised judgement/evaluation component alongside your generative models: User/Application → Foundry model or agent → Jev judgement → deterministic logic → action/response For example, a Foundry-hosted model could generate a proposed answer and Jev could evaluate that answer against predefined criteria before your application allows the workflow to continue. Here's how to set it up: First, you will need to apply for the preview for Jev from TypeSafe. Once you have an account you will need to create an API key Go to API keys in the menu and create a new key (copy the key for use in Foundry) You may also have received some free credit, which should be more than sufficient for experimenting with Jev given its low per-token cost. Next we go to Foundry and create a new agent for Jev In your agent, add a Tool and select OpenAPI tool as below Fill out the dialogue as follows You will have to create a new connection - The key should be in this format "Bearer apikey_<the rest of your key>" For the schema add this { "openapi": "3.0.3", "info": { "title": "TypeSafe Jev System One", "version": "1.1.0", "description": "Evaluate content using TypeSafe Jev System One." }, "servers": [ { "url": "https://api.typesafe.ai" } ], "paths": { "/v1/systemone": { "post": { "operationId": "evaluate_with_jev", "summary": "Evaluate content using Jev", "description": "Evaluate state against typed questions using TypeSafe Jev.", "security": [ { "bearerAuth": [] } ], "requestBody": { "required": true, "content": { "application/json": { "schema": { "type": "object", "additionalProperties": false, "required": [ "state", "model", "questions" ], "properties": { "state": { "type": "string", "description": "The original text or content for Jev to evaluate." }, "model": { "type": "string", "enum": [ "jev-latest" ], "default": "jev-latest", "description": "The TypeSafe Jev model. Use jev-latest." }, "questions": { "type": "object", "description": "A map of named questions for Jev to answer. Each question must be a Noul, Choice, or Score question.", "additionalProperties": { "oneOf": [ { "$ref": "#/components/schemas/NoulQuestion" }, { "$ref": "#/components/schemas/ChoiceQuestion" }, { "$ref": "#/components/schemas/ScoreQuestion" } ] } } } } } } }, "responses": { "200": { "description": "Successful Jev evaluation", "content": { "application/json": { "schema": { "type": "object", "additionalProperties": true } } } }, "400": { "description": "Invalid request" }, "401": { "description": "Authentication failed" }, "422": { "description": "Request validation failed" } } } } }, "components": { "schemas": { "NoulQuestion": { "type": "object", "additionalProperties": false, "required": [ "type", "instructions" ], "properties": { "type": { "type": "string", "enum": [ "noul" ] }, "instructions": { "type": "string", "description": "The yes/no question for Jev to evaluate." }, "criteria": { "type": "object", "additionalProperties": false, "properties": { "true": { "type": "string", "description": "Description of what a yes or value near 1 means." }, "false": { "type": "string", "description": "Description of what a no or value near 0 means." } } } } }, "ChoiceQuestion": { "type": "object", "additionalProperties": false, "required": [ "type", "instructions", "criteria" ], "properties": { "type": { "type": "string", "enum": [ "choice" ] }, "instructions": { "type": "string", "description": "The question for Jev to decide between the supplied choices." }, "criteria": { "type": "object", "description": "A map where each property name is a possible choice and its value describes that choice.", "minProperties": 2, "additionalProperties": { "type": "string" } } } }, "ScoreQuestion": { "type": "object", "additionalProperties": false, "required": [ "type", "instructions", "criteria" ], "properties": { "type": { "type": "string", "enum": [ "score" ] }, "instructions": { "type": "string", "description": "The attribute or question Jev should score." }, "criteria": { "type": "array", "description": "Ordered scoring levels from lowest to highest.", "minItems": 2, "items": { "type": "string" } } } } }, "securitySchemes": { "bearerAuth": { "type": "apiKey", "name": "Authorization", "in": "header" } } }, "security": [ { "bearerAuth": [] } ] } We are going to use Jev to assess complaints so our instructions for the Agent will be You are a customer-support triage agent. For every customer-support message you MUST call the evaluate_with_jev tool. IMPORTANT: When calling evaluate_with_jev, construct Jev questions using ONLY the following property names: For a Noul question: { "type": "noul", "instructions": "...", "criteria": { "true": "...", "false": "..." } } For a Choice question: { "type": "choice", "instructions": "...", "criteria": { "option1": "...", "option2": "..." } } For a Score question: { "type": "score", "instructions": "...", "criteria": [ "lowest level", "middle level", "highest level" ] } NEVER use these properties: - question - prompt - options - ordered_criteria Always use: - instructions - criteria For customer support tickets, ask Jev these three questions: billing: type = noul instructions = "Does this ticket concern billing, payments, charges, invoices or refunds?" criteria.true = "The issue concerns billing or a financial transaction." criteria.false = "The issue does not concern billing or a financial transaction." tone: type = choice instructions = "What is the customer's tone?" criteria: calm = "Neutral, polite or informational." frustrated = "Dissatisfied, impatient or inconvenienced." angry = "Strongly confrontational or extremely dissatisfied." urgency: type = score instructions = "How urgently does this ticket require attention?" criteria in this exact order: 1. "Can wait" 2. "Handle this week" 3. "Handle today" Always set model to "jev-latest". Pass the customer's original message as state. Do not classify the ticket yourself. Use the values returned by Jev. Always show the Jev output at the end of the response Now we can give a complaint and see what Jev says The room had no water in and one of the towels was dirty Response I’m sorry about the issues you experienced—no running water and a dirty towel are unacceptable. I’ll get this addressed right away. Immediate help I can arrange now: Send maintenance to restore water. Have housekeeping deliver fresh towels and re-service the bathroom. Provide bottled water immediately. If water can’t be restored quickly, arrange a room move. Please share: Your reservation name and room number Best contact number Whether there’s no water at all or only hot/cold is affected Whether you prefer immediate service or a room change If you’ve already left, let me know the date/time this happened so we can investigate and follow up. Jev output: { "model": "jev-1.13.0", "answers": { "billing": { "type": "noul", "noul": 0.02 }, "tone": { "type": "choice", "choice": "frustrated", "confidence": 0.6, "probabilities": { "frustrated": 0.74, "calm": 0.26, "angry": 0.0 } }, "urgency": { "type": "score", "score": 1.81, "confidence": 0.72, "legend": { "0": "Can wait", "1": "Handle this week", "2": "Handle today" }, "probabilities": { "0": 0.03, "1": 0.12, "2": 0.85 } } }, "usage": { "input_tokens": 466, "output_tokens": 75 } } We can now see both Jev's decision and the probabilities behind it. In this example, Jev determines that the complaint is very unlikely to be billing-related, identifies the customer's tone as frustrated, and gives a high probability that the issue should be handled today. This is where Jev becomes particularly useful in an agent workflow. Rather than relying on generated text to drive the next step, our application can use these structured probabilities to make deterministic decisions, such as routing the complaint, escalating it, or requiring human review when confidence falls below a defined threshold.