.net
464 TopicsConnect Azure Functions to more services with managed connectors
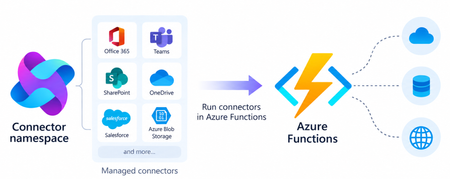
Azure Functions can already connect to many Azure services through triggers and bindings. With managed connectors, your functions can access about 1,700 connectors across services such as Microsoft 365, Microsoft Teams, Dataverse, SharePoint, OneDrive, and third-party systems. Connector triggers deliver events from these services to your function, while typed connector clients let your code take actions against them. You get this broader integration surface without writing the webhook registration code or managing the OAuth tokens required to connect to each service. Focus on your function's business logic and let Azure Connector Namespace handles the connection. Azure Functions integration with Connector Namespace is currently in public preview. It supports .NET isolated, Python, and Node.js. Review the managed connectors overview for current language, hosting plan, and regional availability. To demonstrate how connector triggers and actions work together, this article follows a .NET sample that automates RFP intake across SharePoint, Azure Content Understanding, and Teams. From an uploaded RFP to Teams notification Consider an organization that receives requests for proposals (RFPs) in a shared SharePoint document library. Someone must read each document, identify the requested capabilities, determine which subject-matter experts should respond, and notify the right team. The automated RFP intake sample turns that process into an event-driven workflow: A customer uploads an RFP to a SharePoint document library. A SharePoint connector trigger invokes an Azure Function when the file is created. The function uses a typed SharePoint connector client to retrieve the file contents. Azure Content Understanding extracts the document’s text and layout. The function applies deterministic rules to identify the customer, required capabilities, and recommended subject-matter experts. The function uses a typed Teams connector client to post the results as an Adaptive Card in a channel. Connector Namespace manages the SharePoint and Teams connections. The function controls file processing, document analysis, routing rules, error handling, and notification content How the sample works The .NET sample demonstrates both parts of the connector programming model: a connector trigger receives an event from SharePoint, and typed connector clients provided by the Connector SDKs to perform actions against SharePoint and Teams. The function starts when the SharePoint When a file is created trigger detects a new RFP. It declares the trigger using the ConnectorTrigger attribute and receives a typed payload containing the file’s properties: [Function("OnNewFile")] public async Task OnNewFile( [ConnectorTrigger] SharePointOnlineOnNewFileItemsTriggerPayload payload, CancellationToken cancellationToken) { // Process the newly uploaded file. } Because the trigger provides file properties rather than its contents, the function uses a typed SharePoint client to retrieve the document: byte[] response = await _sharePoint.GetFileContentAsync( Uri.EscapeDataString(siteAddress), fileIdentifier, cancellationToken: cancellationToken); byte[] document = SharePointFileContent.Decode(response); The SharePoint and Teams clients are registered through dependency injection. Each client uses the runtime URL of its Connector Namespace connection and authenticates with DefaultAzureCredential: services.AddSingleton( new SharePointOnlineClient( new Uri(sharePointRuntimeUrl), credential)); services.AddSingleton( new TeamsClient( new Uri(teamsRuntimeUrl), credential)); The function sends the document to Content Understanding’s prebuilt-layout analyzer, which extracts its text and structure. It then applies deterministic C# rules to identify the customer and required capabilities and map those capabilities to predefined subject-matter expert roles. Finally, the function creates an Adaptive Card containing the results and posts it to the configured Teams channel with the typed Teams client: await _teams.PostCardToConversationAsync( postAs, postIn, request, cancellationToken); Connector Namespace handles the SharePoint and Teams connections, while the function controls the document analysis, routing logic, error handling, and notification content. Try the sample The RFP intake sample includes the function code, Bicep infrastructure, Azure Developer CLI configuration, and supporting scripts. Its README explains how to test the workflow locally and deploy it to Azure. Common connector patterns Managed connectors are useful when a function must react to events or perform operations in external systems. Common patterns include: Event to action: React to an event in one service and take an action in another. Event to enrich to action: Retrieve additional information related to an event before acting. Event to document analysis to action: Extract text and structure from a document, apply application rules, and send the result through another connector. Event to AI to action: Analyze event data with an AI service and write the result back through a connector. Extend an existing function app: Add connector-based integrations alongside HTTP, timer, queue, Service Bus, Event Grid, or Durable Functions workloads. The RFP sample combines several of these patterns. A SharePoint event starts the workflow, a SharePoint action retrieves the document, Content Understanding extracts its contents, application code enriches the result, and a Teams action sends the notification. Closing thoughts Managed connectors extend the external systems that can trigger your functions and the services your function code can act on. This brings services such as SharePoint, Teams, Microsoft 365, and many third-party systems into the Azure Functions programming model without requiring you to build the underlying webhook and OAuth infrastructure. Choose Azure Functions with managed connectors when you want this broader integration surface in a code-first application and need custom branching, application libraries and SDKs, other Functions bindings, document or AI processing, or application-specific logic between the trigger and action. If the workload primarily orchestrates connector operations, involves little custom code, and would benefit from a visual designer, Azure Logic Apps is usually the simpler choice. Resources Documentations Overview of managed connectors in Azure Functions Azure Functions connector samples Azure Connector Namespace overview Content Understanding prebuilt-layout analyzer Connector SDK GitHub repos .NET SDK Python SDK Node.js SDK295Views0likes0CommentsIntroducing a Guided Copilot Experience for Building Azure Apps in VS Code
Today we're previewing a new way to build cloud apps with GitHub Copilot in VS Code: a guided Copilot experience that takes you from idea to a deployed Azure app through a structured, predictable workflow instead of a free-form chat session that may or may not land where you need it to. The problem: Copilot is powerful, but unpredictable Ask Copilot to "build me a Node.js API on Azure Functions with a Postgres database" today, and you might get a working project, or you might not. Sometimes Copilot scaffolds the app but skips infrastructure. Sometimes it generates a deployment script that fails halfway through. Sometimes it forgets what you were building three prompts later. The underlying model is capable. The problem is the shape of the experience: an open-ended chat with no checkpoints, no guardrails, and no consistent path from "I have an idea" to "it's running in Azure." How it works The guided Copilot experience adds to that open-ended flow with three clear, explicit stages: 1. Project scaffolding: Describe your app in plain language. Copilot proposes an architecture and asks for anything that is missing (e.g., language, app type, Azure services) through simple forms and pickers, not more back-and-forth chat. You review and approve the plan before any code is written. 2. Local development: Your project is scaffolded then Copilot checks for the runtimes, emulators, and tools you'll need and helps you install what's missing, so the project runs locally from the very first launch. Debug configurations are wired up automatically, so you can test and iterate on your app before it ever touches Azure. 3. Deployment: Copilot shows the tools that will be used for deployment along with a summary of all resources that will be created and a cost estimate so you can be confident in what you're getting. Infrastructure files are created for your app to ensure a consistent and reproducible deployment environment for testing and staging before going to production. Deployment runs through the same reliable tooling used across Azure (az and azd), so if something goes wrong, you get a clear explanation and a concrete next step instead of a wall of CLI output. Once your app is live, the guided experience doesn't disappear, Copilot retains context about your project's architecture, so coming back later to add a service or make a change picks up right where you left off. 🎉 What this means for how you work Determinism over guesswork. The same input reliably produces the same kind of outcome, so no more wondering which "mode" Copilot is going to be in. First try success. Projects are built to run and deploy on the first attempt, not after several rounds of manual repair. Structure over chat walls. Decisions that matter such as architecture choices, missing configuration, and deployment targets are surfaced through real UI, so you're not parsing paragraphs of text to figure out what Copilot needs from you. Stay in VS Code. The entire journey, from planning through deployment, happens without leaving your editor. What's in the initial preview The first version focuses on JavaScript and TypeScript projects, including web apps, Azure Functions, Container Apps, and Static Web Apps, with support for PostgreSQL, Azure Storage, Azure Key Vault, and Azure OpenAI. .NET and Python support are on the roadmap for a future release. Nothing about your existing Copilot workflows changes, the guided experience is an additional, opinionated path alongside the free form chat you already know, for when you want a reliable, structured way to go from zero to deployed. What's next This is an early look at a broader shift in how we think about AI-assisted development on Azure: less "ask and hope," more structured collaboration with clear checkpoints and real UI where it counts. We're continuing to expand language support, refine the deployment experience, and incorporate feedback from developers using it in the wild. Install the Azure Tools extension pack and open an empty folder to try the guided Copilot experience and let us know what you think. File issues or share feedback on the GitHub repo.1.1KViews2likes0CommentsAnnouncing General Availability of Managed Instance on Azure App Service
Today, we are thrilled to announce the General Availability (GA) of Managed Instance on Azure App Service. Following the tremendous response to our Public Preview announcement at Ignite 2025, we've spent the past nine months working closely with customers, partners, and the community to harden the platform, expand capabilities, and validate real-world enterprise migration scenarios. Managed Instance on Azure App Service is now ready for your production workloads, backed by a full enterprise SLA. The journey from Preview to GA Since November 2025, thousands of customers have used the public preview to move workloads that were previously "stuck" on-premises or on aging Windows Server VMs. The feedback has been unmistakable: Managed Instance on Azure App Service dramatically shortens the path to the cloud for legacy and complex .NET Framework applications often removing the need for code changes entirely. Enterprises across various sectors like financial services, healthcare, manufacturing, and the public sector migrated applications that depended on GAC assemblies, COM components, Windows Services, registry configuration, and mapped network drives apps that historically required expensive re-platforming or a full rewrite. With Managed Instance on Azure App Service, these workloads now run on a fully managed PaaS platform, side-by-side with modern cloud-native apps. What's new at GA Building on the preview foundation of configuration scripts, registry adapters, storage mounts, and RDP via Azure Bastion, GA brings several important additions: Production SLA (99.95%) – Full enterprise-grade availability commitment across all supported regions. Expanded regional availability – Available in at least 8 Azure regions worldwide at GA with continued expansion planned through the remainder of 2026. Deeper Premium v4 integration – Managed Instance now takes full advantage of the Premium v4 App Service Plan tier for enhanced performance, memory-optimized SKUs, and improved price-performance. Zone redundancy – Deploy Managed Instance workloads across Availability Zones for higher resiliency without additional configuration effort. Enhanced observability – First-class integration with Azure Monitor, Application Insights, and Log Analytics, including instance-level metrics for CPU, memory and disk. Improved configuration script experience – Faster startup times, richer diagnostics when scripts fail, versioning support for configuration bundles, and streamlined rollback. Managed Identity everywhere – All secrets, storage connections, and Key Vault references at GA use Managed Identity by default, eliminating stored credentials from your deployment pipelines. Azure Policy and Defender for Cloud coverage – Governance, compliance, and threat protection controls now apply to Managed Instance the same way they apply to standard App Service workloads. Bicep, Terraform, and ARM templates – Full IaC support with new resource providers and modules for repeatable, auditable deployments. GitHub Copilot Modernization - Deep Integration with GitHub Copilot modernization for Application assessment targeting Managed Instance on App Service https://learn.microsoft.com/en-us/dotnet/azure/migration/appmod/working-with-assessment Why customers are choosing Managed Instance on Azure App Service The core value proposition remains the same and it's stronger than ever at GA: 1. Lift-and-Improve legacy applications Migrate .NET Framework apps with hardcoded file paths, COM dependencies, GAC entries, or registry access with no major code rewrites. Install custom components directly on the managed instance using configuration scripts. 2. Re-platform hard-to-modernize apps Move applications with lost source code, legacy middleware (MSMQ, SMTP servers, third-party runtimes), or tight infrastructure coupling. Managed Instance removes the blockers that historically forced these apps to stay on VMs. 3. Hybrid and regulated workloads Integrate securely with on-premises resources using VNet integration and private endpoints. Enforce data residency, Bring Your Own Storage, and Managed Identity–backed access controls to meet finance, healthcare, and government compliance requirements. 4. Incremental modernization Start with "lift and Improve" then adopt PaaS features like DevOps automation, autoscaling, deployment slots, and centralized configuration at your own pace. Future-proof your portfolio without a big-bang transformation. What customers are saying During preview, we saw real numbers: Migration timelines cut from months to weeks for apps that would otherwise have required substantial refactoring. Zero code changes for a significant share of preview workloads that previously blocked App Service adoption. Reduced infrastructure footprint as customers consolidated Windows Server VMs onto managed App Service Plans with zone redundancy and autoscaling built in. We are grateful to every preview customer whose feedback shaped this release. Pricing and licensing Managed Instance on Azure App Service is billed as a capability on top of the Premium v4 App Service Plan. There is no separate Managed Instance surcharge at GA you pay for the underlying Premium v4 compute you consume. Existing App Service reservations, savings plans, and any other Azure Benefit all apply, helping you optimize the total cost of ownership as you migrate. Getting started Getting started is straightforward: Assess your workload using Azure Migrate's updated App Service assessment, which now flags candidates ideal for Managed Instance. Create a new Web App using the Managed Instance on Azure App Service option in the Azure Marketplace, or via Bicep, Terraform, or the Azure CLI. Package your dependencies into a configuration bundle (a zip file plus a PowerShell install script) and store it in Azure Storage. Grant access via Managed Identity. Configure registry values, storage mounts, and networking to match your on-premises environment. Deploy your application using the same App Service deployment mechanisms you already know—ZIP deploy, GitHub Actions, Azure DevOps, or Visual Studio publish. Operate with confidence use RDP over Azure Bastion for deep troubleshooting when you need it, and Azure Monitor for everything else. Resources 📘 Managed Instance on Azure App Service documentation 🎥 Technical Deep Dive session recording from Build 2026 🧭 GitHub Repo with sample configuration scripts, webapp and guidance for Managed Instance on App Service workloads Looking ahead GA is a milestone, not a finish line. On our roadmap we're already working on: Deeper integration with Azure Migrate's web app discovery and assessment capabilities to help identify web apps suitable for migration to Managed Instance on App Service Enhanced migration tooling with easier dependency detection and one-click configuration bundle generation. Expanded Rollout to Azure Regions across 2026 and beyond. Continuously Release new features and capabilities to make migrations easier and faster than ever before We can't wait to see what you build and what you migrate. Managed Instance on Azure App Service is here to make your modernization journey faster, simpler, and more secure than ever. Welcome to GA. 🚀 The Azure App Service Team2.9KViews1like0CommentsHow to build long-running MCP tools on Azure Functions
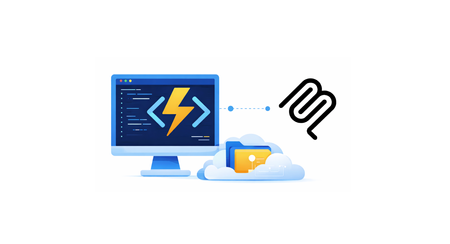
Recently, a customer building servers with the Azure Functions MCP extension reached out and asked: How do I handle tools that take longer than the client is willing to wait? This becomes especially relevant when tool calls move beyond simple request/response into multi-step workflows and long-running operations. At the same time, MCP is evolving to address exactly this. The Tasks extension is introduced in the 2026-07-28 release candidate, defining a standard way to model long-running work. In this post, we’ll walk through how to build long-running MCP tools on Azure Functions using Durable Functions , a framework for authoring stateful, long-running workflows as ordinary code, with checkpointing, scaling, and recovery handled automatically. MCP tools today Today, MCP tools are fundamentally request/response: the client issues a tools/call the server returns a result This works well for fast operations, but breaks down when: workflows take minutes execution depends on multiple steps latency is unpredictable In practice, clients enforce their own tool-call timeouts. These aren't standardized by the MCP spec and vary per client, but they're often in the ~30–60 second range. If a tool exceeds that window: In practice, clients often enforce short timeouts. If a tool exceeds that window: the client times out the agent observes a failed call the underlying work may still be running So the core issue is that you have synchronous tool calls don’t naturally model long-running work. The MCP Tasks extension The Tasks extension to address this. With the extension, a server can respond to a tools/call with an asynchronous task handle instead of a final result, and the client drives the lifecycle from there: tasks/get: poll the task's status tasks/update: submit input back to the server if the task reaches input_required tasks/cancel: cancel an in-flight task A task carries a status ("working", "input_required", "completed", "failed", or "cancelled") and on completion, the final result. Task creation is server-directed: the client advertises support by including the extension in its per-request capabilities, and the server decides per request whether to return a task. A server won't return a task to a client that hasn't advertised support. It's important to note that Tasks rely on ecosystem support. Clients must advertise the extension, and MCP SDKs must implement the task lifecycle, before servers can use it. So while Tasks is now a defined extension, broad client and SDK support is still in progress. Implement long-runng tasks with Durable Functions today Until the Tasks extension is broadly supported across clients, we need a pattern that works with existing request/response clients and supports long-running execution. The following samples show how, using Durable Functions: Python NET The long-running work in this sample mines a short chain of blocks. Each block requires solving a computational puzzle where the system keeps trying different inputs until it finds one that produces a result matching a specific pattern (for example, starting with a certain number of zeros). Because this involves lots of trial and error, it naturally takes time, making it a good example of a long-running workflow. The server in the sample exposes two tools: start_mining Starts a Durable Functions orchestration to mine the blocks Waits briefly (within a configurable budget) Returns result inline if completed within budget OR returns workflow_id if still running get_mining_result Takes the workflow_id Returns the current state, e.g. "completed", "running", "failed", or "not_found" To ensure that the agent calls the tools in the right order, workflow_id is a required parameter of get_mining_result, so the agent can't poll without starting a mining run first. Also, the "running" response carries a poll_after_seconds and a next instruction, ensuring the agent to poll again if work is not done rather than give up or assume completion. Even so, the poll path still relies on the agent correctly remembering, and not hallucinating, the workflow_id it was handed. If it garbles or invents an id, the poll lands on the wrong instance or none at all (which is why get_mining_result returns "not_found" rather than guessing). What changes with the Tasks extension Once the Tasks extension is fully implemented across clients and SDKs, the model becomes simpler and more reliable: the server returns a Task handle, the client manages the polling and lifecyle calls, and the SDK tracks execution state. This removes a key limitation of today’s solution, which requires the agent to remember and correctly pass identifiers like workflow_id. Call to action Try out the sample and let us know whether it addresses your MCP needs around long-running or workflow type tools!711Views0likes0Comments
Performance Tuning Cold Starts, Scaling Delays, and Startup Latency in Azure Container Apps
Introduction There is a particular kind of frustration that comes not when your application fails to start, but when it starts too slowly. The container is running, the health probes pass, your monitoring shows green — and yet every few minutes a user somewhere in the world hits a request that takes 15 seconds to respond. Your support team starts getting tickets. Your SLA dashboard turns amber. This is the cold start problem, and it is one of the most widely discussed pain points with any serverless container platform. Azure Container Apps is no different. But what most engineers do not realize is that the cold start is only one part of the story. Scaling delays, inefficient image layers, wrong resource allocations, and misconfigured KEDA rules all compound to create latency spikes that feel indistinguishable from cold starts but have completely different root causes and fixes. In this part of the series, we break down each cause systematically and show you exactly how to address it. Understanding What "Cold Start" Actually Means in Container Apps Before we fix anything, it helps to understand what is actually happening during a cold start. When a new replica is created, Azure Container Apps needs to do several things in sequence before your application can serve a single request: The platform schedules the new replica on available infrastructure. The container runtime pulls the image layers that are not already cached on that node. The container starts and the process inside it begins executing. Your application framework initializes (the .NET DI container, Django's ORM layer, loaded ML models, etc.). The readiness probe passes, signaling that the replica can accept traffic. Every one of these steps takes time. The total duration is your cold start latency. When you have `minReplicas: 0`, this full cycle happens for every "first request after idle" scenario. With `minReplicas: 1`, steps 1 and 2 are already done, but steps 3–5 still happen whenever a new replica is created due to scaling out. Scenario 1: Requests Spike to 10+ Seconds After a Period of Inactivity What You See Everything looks fine during load testing, but the next morning after a quiet night, the first user to hit the app gets a timeout or a very slow response. You check your Application Insights or Log Analytics and you see exactly one request with a dramatically higher duration than all the others. Why This Happens You have `minReplicas` set to `0` (or it defaults to 0). When there are no replicas running and a new request arrives, the entire cold start sequence kicks off — and the request waits in the ingress queue the entire time. Depending on your image size and application initialization time, this can easily reach 15–30 seconds for a .NET application with a large DI graph, or even longer for a Python application that imports heavy libraries. The Fix Option A (Recommended for most workloads): Set `minReplicas` to 1. This ensures at least one replica is always warm and ready to handle requests. You will pay for that one replica's compute even during idle periods, but you eliminate the cold start for your users: az containerapp update --name my-dotnet-api --resource-group my-rg --min-replicas 1 --max-replicas 10 Or in your Container App YAML: scale: minReplicas: 1 maxReplicas: 10 rules: - name: http-scaling-rule http: metadata: concurrentRequests: "10" Option B: Reduce image size to speed up the pull. Every megabyte in your container image adds time to cold starts. A production .NET API should not be a 2 GB image. Use multi-stage builds to strip away the SDK, test tools, and development dependencies: # Stage 1: Build FROM mcr.microsoft.com/dotnet/sdk:8.0 AS build WORKDIR /src COPY ["MyApp.csproj", "."] RUN dotnet restore COPY . . RUN dotnet publish -c Release -o /app/publish --no-restore # Stage 2: Runtime only - much smaller FROM mcr.microsoft.com/dotnet/aspnet:8.0 AS final WORKDIR /app COPY --from=build /app/publish . # Run as non-root for security USER app EXPOSE 8080 ENTRYPOINT ["dotnet", "MyApp.dll"] For Django, the equivalent pattern is: FROM python:3.11-slim AS base # Install only production dependencies WORKDIR /app COPY requirements.txt . RUN pip install --no-cache-dir -r requirements.txt && find /usr/local -name "*.pyc" -delete && find /usr/local -name "__pycache__" -type d -exec rm -rf {} + 2>/dev/null || true COPY . . RUN SECRET_KEY=placeholder python manage.py collectstatic --noinput USER nobody EXPOSE 8000 CMD ["gunicorn", "myproject.wsgi:application", "--bind", "0.0.0.0:8000", "--workers", "2"] Option C: Use a startup probe to manage the readiness window. If your app genuinely needs 20–30 seconds to initialize (loading configuration, warming caches, establishing connection pools), configure a startup probe separately from your liveness probe. This gives the container time to start without the liveness probe killing it prematurely: probes: - type: Startup httpGet: path: /health port: 8080 initialDelaySeconds: 5 periodSeconds: 5 failureThreshold: 12 # 12 * 5s = 60 seconds total window - type: Liveness httpGet: path: /health port: 8080 periodSeconds: 10 failureThreshold: 3 - type: Readiness httpGet: path: /health/ready port: 8080 periodSeconds: 5 failureThreshold: 3 Scenario 2: New Replicas Lag Behind Traffic Spikes What You See Your application handles steady traffic just fine. Then a sudden burst arrives — a marketing email goes out, a scheduled batch job triggers API calls, or a downstream system fires webhooks — and for 30–60 seconds your error rate jumps and your latency spikes. After that window, everything recovers. The scaling logs show new replicas were created, but they came online too late. Why This Happens KEDA (the scaling engine behind Container Apps) works reactively. By default, HTTP-based scaling triggers new replicas when concurrent requests exceed the configured threshold. But there is an inherent delay between the moment traffic spikes, the moment KEDA detects it, and the moment a new replica is warm and serving traffic. This window is where your users experience the pain. Additionally, if your image pull takes a long time (large image, first pull on a new node), the new replica arrives even later. KEDA cannot compensate for slow image pulls. The Fix Step 1 — Tune your KEDA scaling rules to trigger earlier. Rather than waiting until you are already at capacity, configure scaling to trigger with a lower concurrency threshold. If your app can handle 20 concurrent requests comfortably, set the threshold to 10 so new replicas spin up before you are overwhelmed: scale: minReplicas: 1 maxReplicas: 20 rules: - name: http-rule http: metadata: concurrentRequests: "10" # Scale earlier, not at capacity For Azure Service Bus or Event Hubs-triggered scaling (common in job-style workloads), use a queue length threshold that gives you a buffer: scale: minReplicas: 0 maxReplicas: 30 rules: - name: servicebus-rule custom: type: azure-servicebus metadata: queueName: my-processing-queue namespace: my-servicebus-namespace messageCount: "5" # Scale when queue depth reaches 5, not 100 auth: - secretRef: servicebus-connection triggerParameter: connection Step 2 — Pre-warm your connection pools in .NET. One of the biggest contributors to new replica slowness is the time spent establishing database connections and other external connections. The first request that hits a new replica bears the cost of opening the connection pool. Configure your connection pool to warm up eagerly at startup: // In Program.cs, after building the app if (app.Environment.IsProduction()) { // Warm up the database connection pool before accepting traffic using var scope = app.Services.CreateScope(); var dbContext = scope.ServiceProvider.GetRequiredService<AppDbContext>(); await dbContext.Database.ExecuteSqlRawAsync("SELECT 1"); } await app.RunAsync(); Step 3 — Enable HTTP/2 keep-alive and connection reuse. In .NET applications running behind the Container Apps ingress, configure your HTTP client to use connection pooling properly: builder.Services.AddHttpClient("downstream-api", client => { client.BaseAddress = new Uri("https://my-downstream-service"); client.DefaultRequestVersion = new Version(2, 0); }) .ConfigurePrimaryHttpMessageHandler(() => new SocketsHttpHandler { PooledConnectionLifetime = TimeSpan.FromMinutes(5), PooledConnectionIdleTimeout = TimeSpan.FromMinutes(2), MaxConnectionsPerServer = 20 }); Scenario 3: Django Startup Is Slow Due to Import Time What You See Your Django application takes 8–12 seconds to start even on a warm node. You check the Gunicorn startup logs and see it spending most of that time in Python module imports before it ever processes a request. Why This Happens Python's import system is synchronous and single-threaded. When you import `django`, `rest_framework`, `pandas`, `numpy`, or any large library, Python reads and executes every module file in the dependency chain. A Django project with Django REST Framework, Celery, and a few third-party packages can easily spend 5–8 seconds just on imports. Multiply that by the number of Gunicorn workers (each is a separate process that imports everything independently) and startup time balloons. The Fix Step 1 — Profile import time to find the worst offenders. Add this to your Dockerfile's entrypoint or run it manually: # Run this in a container shell to see which imports take the longest python -X importtime -c "import django; django.setup()" 2>&1 | sort -k2 -rn | head -20 Step 2 — Use lazy imports for heavy dependencies that are not needed at startup. Instead of importing everything at the module level, defer imports to the functions that actually need them: # Instead of this at the top of your file: import pandas as pd import numpy as np # Do this — import only when the function is actually called: def process_data(data): import pandas as pd import numpy as np df = pd.DataFrame(data) return df.describe().to_dict() Step 3 — Reduce Gunicorn worker count for memory-constrained environments. Having too many workers means too many independent Python processes all importing everything at the same time. For Container Apps with 0.5–1 vCPU, 2 workers is usually the right starting point: CMD ["gunicorn", "myproject.wsgi:application", "--bind", "0.0.0.0:8000", "--workers", "2", "--worker-class", "gthread", "--threads", "4", "--timeout", "120", "--keep-alive", "5", "--log-level", "info"] Step 4 — Consider switching from Gunicorn to Uvicorn for async Django. If you are on Django 4.x with ASGI support, Uvicorn with async workers can handle significantly more concurrent requests per worker than synchronous Gunicorn workers: CMD ["uvicorn", "myproject.asgi:application", "--host", "0.0.0.0", "--port", "8000", "--workers", "2", "--log-level", "info"] Scenario 4: Resource Limits Are Causing Throttling and Slow Responses What You See Your application starts fine and handles light traffic well, but under moderate to heavy load — even well below your max replicas — individual requests become slow and CPU metrics show your replicas running near 100% utilization. You may also see the .NET GC (garbage collector) running very frequently, or Django showing slow database queries that are actually fast queries being delayed because the process has no CPU to run. Why This Happens Container Apps defaults to 0.25 vCPU and 0.5 Gi memory if you do not specify resource limits. For a production .NET API or a Django application serving real traffic, this is almost always too little. When a container hits its CPU limit, the container runtime throttles it — the process continues to run but gets less CPU time, making everything slower without any obvious error signal. The Fix Step 1 — Measure actual resource usage before guessing. Query Log Analytics for actual CPU and memory usage to establish a baseline: ContainerAppSystemLogs_CL | where ContainerAppName_s == "my-dotnet-api" | where TimeGenerated > ago(7d) | summarize AvgCpuUsage = avg(todouble(CpuUsageNanoCores_d)) / 1000000, MaxCpuUsage = max(todouble(CpuUsageNanoCores_d)) / 1000000, AvgMemoryMB = avg(todouble(MemoryWorkingSetBytes_d)) / 1048576, MaxMemoryMB = max(todouble(MemoryWorkingSetBytes_d)) / 1048576 by bin(TimeGenerated, 1h) | order by TimeGenerated desc Step 2 — Update resource allocations based on what you observed. az containerapp update --name my-dotnet-api --resource-group my-rg --cpu 0.5 --memory 1.0Gi Container Apps has specific valid CPU/memory combinations. The valid pairs are: `0.25 vCPU / 0.5 Gi`, `0.5 vCPU / 1.0 Gi`, `0.75 vCPU / 1.5 Gi`, `1.0 vCPU / 2.0 Gi`, and up to `4.0 vCPU / 8.0 Gi`. You cannot mix arbitrary values. Step 3 — Configure .NET GC for server workloads. By default, .NET uses the workstation GC mode which is tuned for interactive applications. For server containers, use server GC mode and configure the heap size appropriately: // In runtimeconfig.template.json or via environment variables { "configProperties": { "System.GC.Server": true, "System.GC.HeapHardLimit": 805306368, "System.GC.HighMemoryPercent": 75 } } Or as environment variables in your Container App: az containerapp update --name my-dotnet-api --resource-group my-rg --set-env-vars "DOTNET_GCConserveMemory=5" "DOTNET_GCHeapHardLimit=805306368" Measuring the Impact of Your Changes After making changes, use this Log Analytics query to track your startup times over the past 24 hours and confirm the improvements: ContainerAppConsoleLogs_CL | where ContainerAppName_s == "my-dotnet-api" | where Log_s contains "Application started" or Log_s contains "Now listening on" | project TimeGenerated, Log_s, ContainerName_s | order by TimeGenerated desc And check request duration percentiles in Application Insights: requests | where cloud_RoleName == "my-dotnet-api" | where timestamp > ago(24h) | summarize p50 = percentile(duration, 50), p90 = percentile(duration, 90), p99 = percentile(duration, 99), count = count() by bin(timestamp, 1h) | order by timestamp desc Summary: Your Performance Tuning Quick Reference Here is a quick decision guide based on what you are seeing: Symptom Most Likely Cause First Fix to Try First request after idle is very slow `minReplicas: 0` Set `minReplicas: 1` Spike period has errors, then recovers KEDA scaling too slow Lower concurrentRequests threshold New replicas start slowly Large image size Multi-stage Docker build High CPU at moderate traffic Under-allocated resources Increase CPU/memory allocation Django startup is slow Heavy Python imports Profile and defer imports .NET app slow under load Workstation GC mode Enable server GC References and Sample Resources Use these links to tune startup performance, scaling behavior, and runtime efficiency. Azure Container Apps docs (core) Scale applications in Azure Container Apps Workload profiles overview Health probes in Azure Container Apps Revisions in Azure Container Apps Monitoring and logging in Azure Container Apps Runtime and framework performance references Docker multi-stage builds .NET performance best practices for ASP.NET Core .NET runtime GC configuration Django performance optimization Uvicorn deployment guide Scaling engine references and samples KEDA concepts and documentation KEDA scaler samples Azure Samples: .NET on Azure Container Apps Azure Samples: Python on Azure Container Apps What's Next In Part 3, we go deeper into the most specialized and complex scenario in this series: troubleshooting AI workloads in Azure Container Apps. Loading large ML models, managing GPU and CPU resource constraints, and dealing with memory pressure from inference workloads all require techniques that go beyond standard web application troubleshooting. Part of the series: Troubleshooting Azure Container Apps in Production Next: Part 3 — Troubleshooting ML Model Loading, GPU Issues, and Memory Pressure in Azure Container AppsTroubleshooting Azure Container Apps and Jobs for .NET and Django Workloads
Introduction Deploying to Azure Container Apps feels like a huge step forward — you get serverless containers, automatic scaling, built-in ingress, and managed environments without managing Kubernetes directly. But when something goes wrong and your container refuses to start, or your Container App Job silently fails, it can feel like debugging inside a black box. This first part of our four-part series walks through the most common deployment and startup failures you will hit when running .NET and Django applications on Azure Container Apps and Container App Jobs. We cover what the real error looks like, why it is happening under the hood, and what you need to do to fix it — step by step. The Real-World Problem: "My Container App is stuck in a restart loop and I have no idea why" This is probably the most common thing engineers report when they first move workloads to Azure Container Apps. The deployment finishes successfully, the revision shows as active, but the app never becomes healthy. In the Azure portal it cycles between `Running` and `Degraded`, and in the logs you see cryptic exit codes or — even worse — nothing at all. The root causes almost always fall into one of these buckets: The container exits immediately because the process crashes on startup (misconfiguration, missing secrets, unhandled exceptions). The health probe fails because the app takes too long to start or is listening on the wrong port. A Container App Job never completes because it times out or the job process exits with a non-zero code. Let us walk through each of these in detail. Scenario 1: Your .NET Application Crashes at Startup What You See Your Container App revision goes into a restart loop. You check the Log Analytics workspace and see something like this: ContainerAppConsoleLogs_CL | where ContainerAppName_s == "my-dotnet-api" | where TimeGenerated > ago(30m) | project TimeGenerated, Log_s | order by TimeGenerated desc The output shows: Unhandled exception. System.InvalidOperationException: Unable to resolve service for type 'MyApp.Data.AppDbContext' at Microsoft.Extensions.DependencyInjection.ServiceProviderServiceExtensions.GetRequiredService ... Application is shutting down. Or even more commonly with Entity Framework Core: fail: Microsoft.EntityFrameworkCore.Database.Connection An error occurred using the connection to database 'mydb' on server 'myserver.database.windows.net'. System.Net.Sockets.SocketException: Connection refused Why This Happens When .NET 6+ applications start up, they run the entire `WebApplication.Build()` pipeline before accepting traffic. If any registered service — like a database context — cannot be constructed or if the connection string is missing or wrong, the application throws an unhandled exception and the process exits with a non-zero code. Container Apps detects this exit and restarts the container. This cycle repeats indefinitely. The most frequent trigger is missing or incorrectly named environment variables and secrets. In local development you rely on `appsettings.Development.json` or `user secrets`, but in Container Apps those files are not present unless you explicitly copy them into the image (which you should never do for secrets). Step-by-Step Fix Step 1 — Verify your secrets and environment variables are configured correctly. In the Azure portal, navigate to your Container App → Configuration → Secrets and Environment variables. Make sure every value your app reads from IConfiguration is defined here. From the CLI you can inspect and update them like this: # Add or update a secret reference az containerapp secret set --name my-dotnet-api --resource-group my-rg --secrets "connectionstring=Server=myserver.database.windows.net;..." # Reference that secret as an environment variable az containerapp update --name my-dotnet-api --resource-group my-rg --set-env-vars "ConnectionStrings__DefaultConnection=secretref:connectionstring" Step 2 — Make sure your .NET app reads configuration correctly. The naming convention that trips up almost everyone: Azure Container Apps uses double underscores (`__`) to represent the colon (`:`) separator in .NET configuration keys. So `ConnectionStrings:DefaultConnection` becomes `ConnectionStrings__DefaultConnection` as the environment variable name. // This reads from "ConnectionStrings__DefaultConnection" env var automatically builder.Services.AddDbContext<AppDbContext>(options => options.UseSqlServer(builder.Configuration.GetConnectionString("DefaultConnection"))); Step 3 — Add a startup health check that gives meaningful feedback. Configure a liveness probe with a generous initial delay to avoid a container being killed before it has had time to start: # In your Container App YAML configuration probes: - type: Liveness httpGet: path: /health port: 8080 initialDelaySeconds: 30 periodSeconds: 10 failureThreshold: 5 - type: Readiness httpGet: path: /health/ready port: 8080 initialDelaySeconds: 15 periodSeconds: 5 failureThreshold: 3 Add the corresponding health endpoint in your .NET app: // Program.cs builder.Services.AddHealthChecks() .AddSqlServer( builder.Configuration.GetConnectionString("DefaultConnection")!, name: "database", tags: new[] { "ready" }); app.MapHealthChecks("/health"); app.MapHealthChecks("/health/ready", new HealthCheckOptions { Predicate = check => check.Tags.Contains("ready") }); Step 4 — Pull the raw container logs using the CLI to see exactly what happened before the container exited: az containerapp logs show --name my-dotnet-api --resource-group my-rg --type console --tail 50 Scenario 2: Your Django Application Fails to Start What You See Your Django app deploys, the container starts, but within seconds it exits. In the logs you see one of these common errors: django.core.exceptions.ImproperlyConfigured: Set the SECRET_KEY environment variable Or: django.db.utils.OperationalError: could not connect to server: Connection refused Is the server running on host "localhost" (127.0.0.1) and accepting TCP/IP connections on port 5432? Or the static files problem that catches almost everyone: [Errno 2] No such file or directory: '/app/staticfiles' Why This Happens Django validates its configuration eagerly when the WSGI/ASGI server starts. If `SECRET_KEY` is not set, if `ALLOWED_HOSTS` does not include the container's hostname or the ingress FQDN, or if `DEBUG=True` is set in a configuration branch that requires a proper database, Django refuses to serve any requests. The static files error comes up because many teams forget to run `python manage.py collectstatic` as part of the container image build process. The `STATIC_ROOT` directory simply does not exist at runtime. Step-by-Step Fix Step 1 — Set required Django environment variables in your Container App. az containerapp secret set --name my-django-app --resource-group my-rg --secrets "django-secret-key=your-very-secret-key-here" "db-password=your-db-password" az containerapp update --name my-django-app --resource-group my-rg --set-env-vars "DJANGO_SECRET_KEY=secretref:django-secret-key" "DEBUG=False" "ALLOWED_HOSTS=my-django-app.happyfield-abc123.eastus.azurecontainerapps.io" "DATABASE_URL=secretref:db-password" Step 2 — Run `collectstatic` during Docker image build, not at runtime.* This is a very common mistake. Static files should be baked into the image, not generated when the container starts. Update your `Dockerfile`: FROM python:3.11-slim WORKDIR /app COPY requirements.txt . RUN pip install --no-cache-dir -r requirements.txt COPY . . # Collect static files at build time with a dummy SECRET_KEY RUN SECRET_KEY=build-time-placeholder python manage.py collectstatic --noinput EXPOSE 8000 CMD ["gunicorn", "myproject.wsgi:application", "--bind", "0.0.0.0:8000", "--workers", "2", "--timeout", "120"] Step 3 — Make sure Gunicorn is configured correctly for Container Apps. The most important thing to verify is that Gunicorn is binding to `0.0.0.0` and not `127.0.0.1`. Container Apps expects the application to listen on all interfaces so that the ingress layer can reach it. Also make sure the port matches what you defined in your Container App's ingress target port: # Set ingress to match Gunicorn's bind port az containerapp ingress update --name my-django-app --resource-group my-rg --target-port 8000 --type external Step 4 — Handle database migrations safely. Never run `python manage.py migrate` as part of your container startup command. If you have multiple replicas, all of them will try to run migrations simultaneously, which can corrupt your schema. Instead, use a Container App Job to run migrations as a pre-deployment step: # Create a one-time Container App Job to run migrations az containerapp job create --name django-migrate-job --resource-group my-rg --environment my-aca-env --trigger-type Manual --replica-timeout 300 --image myregistry.azurecr.io/my-django-app:latest --command "python" --args "manage.py" "migrate" --env-vars "DJANGO_SECRET_KEY=secretref:django-secret-key" "DATABASE_URL=secretref:db-password" # Execute the migration job before deploying the new revision az containerapp job start --name django-migrate-job --resource-group my-rg Scenario 3: Your Container App Job Fails Silently or Times Out What You See You trigger a Container App Job — maybe it is a nightly data processing job, a scheduled report generator, or a cleanup task — and in the Azure portal the execution shows as Failed with no helpful error message. Or it shows as Running for an unusually long time and then transitions to Failed with a timeout error. Why This Happens Container App Jobs have a `replicaTimeout` property. If your job process does not complete within that window, Azure Container Apps kills it and marks the execution as failed. This is different from Container Apps (services) where the container keeps running. Jobs are expected to run to completion and exit with code `0`. The silent failure happens when your job process exits with a non-zero exit code but does not write anything to `stdout` or `stderr`. Container Apps records the exit code but has no log content to show you. Step-by-Step Fix Step 1 — Make your job emit logs to stdout explicitly. Every print statement, every log line should go to `stdout` or `stderr`. In Python: import sys import logging logging.basicConfig( level=logging.INFO, format="%(asctime)s %(levelname)s %(message)s", handlers=[logging.StreamHandler(sys.stdout)] ) logger = logging.getLogger(__name__) def main(): logger.info("Job starting") try: # your job logic here process_data() logger.info("Job completed successfully") sys.exit(0) except Exception as e: logger.error(f"Job failed with error: {e}", exc_info=True) sys.exit(1) In .NET: // Use ILogger which writes to stdout by default in containers public class MyJob { private readonly ILogger<MyJob> _logger; public MyJob(ILogger<MyJob> logger) { _logger = logger; } public async Task RunAsync(CancellationToken cancellationToken) { _logger.LogInformation("Job starting at {Time}", DateTimeOffset.UtcNow); try { await ProcessDataAsync(cancellationToken); _logger.LogInformation("Job completed successfully"); } catch (Exception ex) { _logger.LogError(ex, "Job failed"); throw; // Let the process exit with non-zero code } } } Step 2 — Set an appropriate replica timeout and retry count. Be realistic about how long your job takes in production, then add a buffer: az containerapp job update --name my-processing-job --resource-group my-rg --replica-timeout 1800 # 30 minutes --replica-retry-limit 2 # Retry twice before marking as failed Step 3 — Check job execution history and logs. # List recent job executions and their status az containerapp job execution list --name my-processing-job --resource-group my-rg --output table # Get logs for a specific execution az containerapp job execution show --name my-processing-job --resource-group my-rg --job-execution-name my-processing-job-abc123 From Log Analytics: ContainerAppConsoleLogs_CL | where ContainerAppName_s == "my-processing-job" | where TimeGenerated > ago(24h) | project TimeGenerated, Log_s, ContainerName_s | order by TimeGenerated desc Summary: Your Startup Troubleshooting Checklist Before you dig into complex diagnostics, run through this checklist whenever a Container App or Job fails to start: Are all required environment variables and secrets defined and correctly referenced? Is the application listening on `0.0.0.0` and on the port that matches the ingress target port? Does the Dockerfile copy everything needed for the app to run (migrations, static files, etc.)? Are health probes configured with enough initial delay for the app to start? For jobs: is the replica timeout long enough, and does the process exit with code 0 on success? Is the container registry accessible from the Container Apps environment (managed identity or registry credentials configured)? Are the resource allocations (CPU and memory) sufficient for the application to start without OOM-killing? References and Sample Resources Use these resources for deeper implementation details and production-ready patterns. Azure Container Apps docs (core) Azure Container Apps overview Manage secrets in Azure Container Apps Manage environment variables in Azure Container Apps Health probes in Azure Container Apps Ingress in Azure Container Apps View logs in Azure Container Apps Azure Container Apps Jobs overview Azure Container Apps revisions .NET and Django references ASP.NET Core configuration fundamentals ASP.NET Core health checks Django deployment checklist Gunicorn settings Sample repositories Azure Samples: .NET on Azure Container Apps Azure Samples: Python on Azure Container Apps Azure Samples: TypeScript MCP container sample What's Next In Part 2 of this series, we move past startup failures and look at what happens after your app is running — the frustrating world of cold starts, scaling delays, and startup latency spikes that make your application feel slow under real production traffic. Part of the series: Troubleshooting Azure Container Apps in Production Next: Part 2 — From Slow to Snappy: Performance Tuning Cold Starts and Scaling Delays in Azure Container AppsWhat's new in Azure App Service at #MSBuild 2026
At Microsoft Build 2026, Azure App Service introduced a powerful set of updates designed to help organizations accelerate their journey into AI, without increasing complexity or cost. These innovations focus on one clear business outcome: enabling teams to build, deploy, and scale AI-powered applications and agents faster, more securely, and with greater operational efficiency. A key highlight is the new Easy AI experience, which allows existing web apps to become AI-ready with no rearchitecting required. With capabilities like built-in Model Context Protocol (MCP), developers can instantly expose app functionality as agent-ready endpoints, enabling AI agents to interact with business logic securely and seamlessly. This dramatically reduces development time, allowing teams to move from idea to intelligent application in a fraction of the usual effort. Security and compliance are also strengthened with the general availability of Isolated v4 for Azure App Service Environments, delivering improved performance for customers that need single-tenant isolation and strong data residency guarantees. For enterprises operating in regulated industries, this ensures AI applications meet strict governance requirements without sacrificing scalability or speed. For modernization scenarios, Managed Instance on Azure App Service simplifies the migration of legacy applications, including those with OS-level dependencies. Faster restarts, enhanced diagnostics, and AI-assisted migration workflows help organizations modernize existing systems cost-effectively—avoiding expensive rewrites while unlocking AI capabilities. Recent updates include an AI-assisted approach to migrating legacy IIS applications using a multi-agent workflow powered by MCP. Managed Instance is supported on both Premium v4 and Isolated v4, laying the foundation for a modern compute infrastructure across the board. Operational efficiency is further enhanced through platform and CLI improvements designed for the “agent era.” From structured deployment diagnostics to optimized Python pipelines delivering faster deployments, these updates reduce friction and infrastructure overhead, lowering total cost of ownership. Together, these innovations position Azure App Service as a future-ready platform where businesses can rapidly build intelligent, agent-driven applications securely, efficiently, and at scale. 👉 Learn more in the full announcement: Deep dive into Azure App Service Build 2026 updates1.7KViews0likes0CommentsAzure Functions MCP Extension: What's New at Build 2026
The Azure Functions MCP extension has had a breakout year! Since its initial preview, the extension has grown from a single trigger type into a full-featured platform for building remote MCP servers: with tool, resource, and prompt triggers across multiple languages, MCP Apps for interactive UIs, built-in MCP authentication, and feature enhancements. Here's what's new and what it means for developers building MCP servers on Azure Functions. The full MCP primitive set: Tools, resources, and prompts When the MCP extension first shipped, it supported tool triggers. Declare a function as an MCP tool, and any MCP client can discover and call it. That was the starting point. Since then, we've shipped the remaining MCP primitives: Resource triggers: expose a function as an MCP resource. Prompt triggers: expose a function as an MCP prompt, letting clients request structured prompt templates from your server. Like tool triggers, resource and prompt triggers are supported in multiple languages including .NET, Java, Python, TypeScript, and JavaScript. MCP Apps: interactive UI from your MCP server MCP Apps let your tools return interactive user interfaces instead of plain text. Combine tool triggers with resource triggers, and your MCP server can serve rich, rendered experiences to MCP-aware clients. The Azure Functions MCP extension supports MCP Apps natively, meaning the same function app that exposes tools and resources can also serve UI components. The launch blog post on the Azure Apps Blog walked through the pattern in detail. For .NET developers, the new fluent builder API (available in the latest NuGet release) makes it easier to compose MCP Apps by chaining tool and resource definitions in a declarative style. MCP authentication The extension supports built-in MCP authentication, implementing the requirements of the MCP auth spec. All samples in the aka.ms/remote-mcp repo enable built-in MCP auth by default with Microsoft Entra ID as the identity provider. Samples have also been updated to demonstrate how to exchange tokens in the On-Behalf-Of (OBO) flow, so your MCP tools can access downstream APIs using the invoking user's identity. Auth configuration in the Azure portal: Preview at Build is a one-click experience in the Azure portal for configuring built-in MCP auth. No more manual app registration creating, configuration and wiring to the server. Just open your server app on the portal and click to enable MCP auth. Try it out! Feature enhancements Beyond the headline primitives and auth, the extension has shipped a steady stream of capabilities the past few months. The following are the notable additions. Structured content Structured content lets you return machine-readable JSON metadata alongside your tool's response via the `structuredContent` field. Clients that support it can programmatically consume the data (e.g. parse fields, render tables, drive downstream logic) rather than just displaying text. Clients that don't support it still get the regular content blocks as a fallback. Rich content types Tools aren't limited to returning plain text. The extension supports the full set of MCP content block types, e.g. `TextContent`, `ImageContent`, `AudioContent`, `ResourceLink`, and `EmbeddedResource`, so your tools can return images, audio clips, references to resources, and inline file content alongside text. Input and output schemas `WithInputSchema` and `WithOutputSchema` give you explicit control over the JSON schemas advertised for your tools. This is especially useful when the auto-generated schema from function parameters doesn't capture the full contract. For example, when your tool accepts a complex nested object or returns a specific shape that clients depend on. Input and output schemas are currently supported in .NET, with support for other languages coming soon. builder.ConfigureMcpTool("SearchDocs") .WithOutputSchema(""" { "type": "object", "properties": { "results": { "type": "array", "items": { "type": "string" } }, "query": { "type": "string" } }, "required": ["results", "query"] } """); Fluent configuration APIs in .NET A set of fluent builder APIs that let you configure MCP primitives declaratively in `Program.cs`: ConfigureMcpTool: add properties, metadata, input/output schemas, or promote a tool to an MCP App ConfigureMcpResource: attach metadata to resources ConfigureMcpPrompt: define prompt arguments and metadata builder.ConfigureMcpTool("sayhello") .WithProperty("name", McpToolPropertyType.String, "Name of the user", required: true) .WithMetadata("ui", new { resourceUri = "ui://index.html" }); What's next Usage of the MCP extension has grown steadily since its preview launch. Tool execution volume has increased 15x over the past several months as more customers move from experimentation to production. As adoption grows, so do the expectations. Developers building production MCP servers are hitting real friction around auth complexity, client configuration, and observability. We're continuing to invest in the extension to address these gaps and help customers be more successful building and hosting MCP servers on Azure Functions. Here's where we're focusing next. Continued auth simplification Auth remains the biggest barrier to getting an MCP server into production. We'll work on: Smoother client setup: making it easier to connect any MCP client to an authenticated Azure Functions MCP server, not just VS Code. Simplified OBO flow: streamlining the experience of On-Behalf-Of authentication so developers can delegate user identity to downstream services with less configuration. Our goal: the secure path should be the easy path. Deeper integration with Microsoft Foundry We'll build tighter integration between Azure Functions MCP servers and Microsoft Foundry. This includes surfacing MCP servers in Foundry Toolbox, a new feature introduced to help Foundry agents discover and consume tools from a single endpoint. Developers will be able to publish an MCP server from Functions and have it available to Foundry agents through Toolbox without manual endpoint configuration. Continued feature enhancement We prioritize based on feedback from the community raised in our GitHub repo. For example, support for streaming output and pagination are top items in our backlog today based on user demand. We also track the MCP spec's evolution closely and will continue shipping support for strategic features as they land. Examples of proposals we're following: MCP Tasks: the Tasks extension (SEP-2663) defines a standard pattern for async, long-running tool calls with durable task handles. This replaces hand-rolled polling patterns and aligns well with Functions' execute-and-return model. Stateless MCP: SEP-2575 proposes removing the mandatory initialization handshake, which is a natural fit for serverless platforms like Azure Functions where fresh instances can handle any request. Have something you'd like us to prioritize? Let us know by filing a request on GitHub. Get started Samples: Samples showcasing most up-to-date features: aka.ms/remote-mcp Documentation: Model Context Protocol for Azure Functions MCP Extension GitHub repo: Azure Functions MCP Extension771Views1like0CommentsClosing the AI-readiness gap with agentic modernization
Legacy debt is widening the AI-readiness gap Legacy systems and mounting tech debt aren't just slowing your AI agenda — they're quietly stealing its potential. Aging architectures, and complex, decades-old applications, databases, and infrastructure weren't designed for high performance, complex, dynamically scaling agentic workloads. The longer legacy lasts, the wider the gap between AI ambition and AI-readiness. This year at Microsoft Build 2026, we're taking our biggest step yet toward closing it. In a recent Forrester study, 94% of IT leaders ranked modernization as a top priority for their AI strategy, yet only 43% of their portfolios have been modernized on average, and only 32% are AI-ready.¹ Ambition for AI adoption is at a high, yet most are held back by the underlying legacy code, technical debt, and modernization backlog. Forrester’s data underscores it: on average, 35% of modernization projects stall due to legacy constraints, 65% cite security and compliance as the top challenge, 58% are held back by the complexity of monolithic applications, and 59% struggle with finding skilled talent to execute.¹ The result: AI initiatives that stall before they ever reach production. Modernization is a key step to move towards AI production; and it’s typically easier said than done. The growing problem is how to execute at the pace and scale that AI now demands. That’s why IT operators, architects, application owners, and developers are turning to agents to eliminate legacy toil, connect workstreams across teams, and scale their modernization efforts while customizing how they modernize. The first agentic end-to-end modernization solution that unifies IT and developer workflows Azure Copilot migration agent and GitHub Copilot modernization agent create the first agentic, end-to-end modernization solution that unifies IT and developer workflows— helping organizations close the AI-readiness gap by connecting discovery, assessment, planning, code transformation, governance, deployment, and observability into one continuous system. Built into the tools IT teams and developers already use, the solution combines estate-scale planning with GitHub-native execution, application-aware migration, broad workload coverage across apps, infrastructure, and data, and enterprise-grade privacy, security, and flexibility— so modernization becomes a governed, scalable, portfolio-level capability across teams, rather than a series of one-off projects. Building the estate-wide modernization plan Azure Copilot migration agent (public preview) brings AI to every step of estate modernization planning - from discovery and assessment to dependency mapping, ROI analysis, and wave planning - reducing months of manual analysis to minutes. For organizations with a clear picture of their estate, the migration agent accelerates the path from inventory to wave plan. For organizations that don’t, the migration agent helps them build that picture from scratch: what is running, what depends on what, what to move, what to modernize, what to retire, and in what order. By creating business-goal oriented estate plans, generating ROI analysis in minutes, and aligning IT and development teams through connected workflows, it helps enterprises move mission critical applications, databases, and infrastructure onto Azure faster and more confidently, with a continuous, data-driven view of what to modernizing next. Freeing teams from the legacy tax GitHub Copilot modernization agent, now generally available, empowers application owners, architects, and developers to scale modernization across their entire application portfolio. Operated from the CLI, the modernization agent acts as an orchestrator that simultaneously: Assesses readiness across multiple applications at once Plans application-specific modernization journeys and executes the identified migration tasks Surfaces deep code and dependency-level insights and recommendations Automates upgrades for Java and .NET applications Recommends Azure services aligned to organizational standards With its native design into GitHub Copilot, the modernization agent creates issues, pull requests, and shareable assessment reports for each application as it works. Architects and application owners retain visibility and governance from a single view, while developers receive clear, prioritized work they can execute from the agent or finish directly in their preferred editor. Behind the scenes, the modernization agent coordinates with GitHub Copilot's coding agent to complete tasks asynchronously across repositories, with a full monitoring and audit trail in GitHub's Agent HQ. The result is a connected planning-to-execution flow that finally makes modernization at scale possible, without sacrificing oversight or control. In just a few months, the modernization agent has already accelerated modernization up to 4x faster across hundreds of thousands of legacy .NET and Java applications at hundreds of customers. Enterprise level customization Every application is built and operated as uniquely as the business it serves. The path to modernization must be equally unique: tailored to each application's architecture, dependencies, and intent. At Build, we're excited to announce the general availability of custom skills for the modernization agent. Custom skills (GA) let developers teach the modernization agent how their organization works by encoding proprietary patterns, libraries, Azure best practices, and migration approaches once, then reusing them across every run. Each skill is authored as a skill.md file with build instructions, sample usage, reference APIs, and more, and is built on open-standard agent skills so teams aren't locked into a proprietary format. With custom skills, developers can equip the modernization agent with: Business-specific context, knowledge, intent, and migration approaches for application-aware guidance Centralized skills library to reuse and repeat tasks across the portfolio Full traceability for every skill used in generating the modernization plan The result is portfolio-scale execution with application-level specificity, in the same agentic workflow. And because skills live in a shared library, teams can reuse and repeat for faster, more consistent modernization outcomes aligned with the application's goals. Innovating while closing the AI-readiness gap GitHub Copilot is already dramatically reducing technical debt in real world environments, helping to close the AI readiness gap and, more importantly, innovate faster with AI. Organizations that adopt agentic modernization can not only close their AI-readiness gap, they can also make modernization a continuous process, allowing them to more readily integrate AI into existing business applications and services Ready to reimagine your applications? Join us at Microsoft Build this year, online or in person, to see our product teams reimagine applications live with GitHub Copilot modernization, share customer success, and empower you to modernize with confidence in days, not months. Join online or in person for Build session BRK220 on Wednesday 9AM PST Learn more about GitHub Copilot modernization: aka.ms/ghcp-modernization Dive deeper at the virtual .NET Agentic Modernization Day on June 16 th : aka.ms/dotnetday/rsvp ¹ Forrester’s Q1 2026 Cloud and AI Application Modernization Survey [E-66670]1.6KViews1like0Comments