High CPU Troubleshooting with DMV Queries
[View:https://www.youtube.com/watch?v=eDOTzeut4lw]
Scenario:
Recently, a customer called Microsoft Support with a critical performance issue that I worked on. Their SQL Server instance had 100% CPU utilization for a period, but the problem stopped without any action taken
by the customer. By the time I was engaged, the issue was no longer occurring. Very often we use PSSDiag to gather data related to performance issues, but we cannot gather trace data with PSSDiag
after the fact. XEvents will also not reveal anything.
PSSDiag will gather other details like top CPU queries that will be useful after the problem has ceased. In this case, we reviewed the execution plans that consumed the most CPU by using DMVs like sys.dm_exec_query_stats.
Troubleshooting:
In my discussion with the customer, he was made aware of the problem and started to investigate it, but the problem seemed to resolve itself. When I was engaged on the call, the issue had been over for 2 hours. I asked if the server had been restarted and found that it had not. This raised the possibility that the execution plan of the queries and procedures that had driven CPU were still in the cache. In that case, we can run queries against sys.dm_exec_query_stats to review those queries and procedures as well as their execution plans.
Sys.dm_exec_query_stats Query:
Here’s an example (and the attached file has the script as well):
--Run the following query to get the TOP 50 cached plans that consumed the most cumulative CPU All times are in microseconds
SELECT TOP 50 qs.creation_time, qs.execution_count, qs.total_worker_time as total_cpu_time, qs.max_worker_time as max_cpu_time, qs.total_elapsed_time, qs.max_elapsed_time, qs.total_logical_reads, qs.max_logical_reads, qs.total_physical_reads, qs.max_physical_reads,t.[text], qp.query_plan, t.dbid, t.objectid, t.encrypted, qs.plan_handle, qs.plan_generation_num FROM sys.dm_exec_query_stats qs CROSS APPLY sys.dm_exec_sql_text(plan_handle) AS t CROSS APPLY sys.dm_exec_query_plan(plan_handle) AS qp ORDER BY qs.total_worker_time DESC
Many variants of this query can be found which retrieve the stats (reads, CPU, executions) for execution plans from sys.dm_exec_query_stats() and the text of the query from sys.dm_exec_sql_text. To this template, I added sys.dm_exec_query_plan() to also provide the graphical execution plan. This query puts the results in order by total CPU usage.
This is not necessarily an exhaustive list. If a query is recompiled the details for that plan are removed; if there are further executions later, its cumulative stats in sys.dm_exec_query_stats start off at zero. If the procedure cache is flushed or SQL Server is restarted, all plans will be similarly affected.
After running this query with my customer, we saw that there were about five queries that were noticeably higher in total CPU than the rest.
Reviewing Execution Plans:
Once we identified the highest CPU consumers, we started reviewing their execution plan by clicking on the link in our results.** There are a number of items to look for in any execution plan that could indicate where performance can be improved:
- High cost operations
- Index scans
- Multiple executions of scans/seeks
- Bookmark Lookups
- Operations with very high rowcount
- Sort operations
- Implicit conversions
- Estimated rows/executions that do not match actual rows/executions (which could indicated out of date statistics)
In this case, we found the execution plans for each didn’t have obvious red flags, like expensive scans. So, we reviewed the index seeks with higher costs. We reviewed the queries to see what columns were used in the WHERE and JOIN clauses. Using sp_help against the tables, we looked at the existing indexes and found that the indexes seemed to support these queries relatively well.
Statistics:
Since the indexes appeared to support the queries, I decided to take another step and check statistics on these tables using DBCC SHOWSTATISTICS .
For the first several queries from our high CPU output, we checked the statistics on any indexes that seemed relevant. The most important
parts of the statistics output are the “All Density” value, the “Rows” and
“Rows Sampled” values, and the “Updated” value.
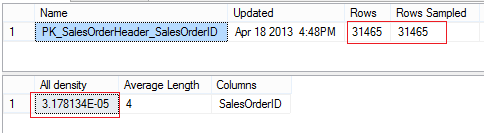
The “Updated” value shows when the statistics were sampled. “Rows” and “Rows Sampled” allows you to determine the sampling rate; a higher sampling rate tends to lead to the statistics being more accurate and providing better performance.
The “All Density” is less direct; inverting this number (dividing 1 by the “All Density”) gives the number of unique values in the column. This is useful in determining how unique an index is, and a more unique index is more likely to be used by the engine to complete a request faster.
What we found in the customer's case was a wide variety of dates for statistics; some were 4 hours old, some were 4 days old, and some were 4 months old. After seeing this repeated on indexes related to several queries, the statistics were updated which resolved the issue.
To Summarize:
Here were the steps we took to analyze and resolve this issue.
- Used query against sys.dm_exec_query_stats and sys.dm_exec_sql_text to identify highest CPU consumers
- Reviewed the execution plans, identified what drives the cost of the plan and operators that are typically problematic
- Reviewed the columns used in JOIN or WHERE clauses in the query, ensured there are indexes built on these columns
- Checked the statistics and updated them when we realized they were out of date.
Additional steps to consider in similar cases:
-
Check the SELECT list and consider if a covering index would further improve performance
- Use the cost of plans to compare old and new plans
Tools to help identify performance issues causes and improve performance:
-
The DatabaseTuning Advisor can use a workload or a specific query to determine if adding or modifying an index can improve the SQL Server’s performance.
- A variant of the high CPU query and a number of other queries I use to gather data quickly are available in the Performance Dashboard . This provides a graphical interface to access these queries as reports.
** If clicking on the link in the query opens a window with raw XML, save this data to an .XML file. Change the file extension to .SQLPLAN, then open the file in SQL Server Management Studio to view the graphical plan.