First published on MSDN on May 02, 2017
The community already uses tools that can make it easier to read and analyze query plans (including SSMS), but these require significant expertise in understanding query processing and plans in order to be able to actually find and fix root causes.
In the latest version of SSMS that released last week, we debut a new scenario-based issue identification feature for Comparison-based and Single Plan Analysis .
Based on common trends in the query performance troubleshooting space, and on years of our own experience troubleshooting query plan issues, we have been working on a functionality that implements some degree of automation in the task of query plan analysis, especially for those large and complex plans. The purpose is to make it easier to find common scenarios where plan choice may be inefficient, and get some recommendations on next steps to take.
In this first release, we added a “ Inaccurate Cardinality Estimation ” scenario. One of the most important inputs for the Query Optimizer to choose an optimal execution plan is the estimated number of rows to be retrieved per operator. These estimations model the amount of data to be processed by the query, and therefore drive cost estimation. The models used by the process of estimating number of rows, called Cardinality Estimation, may have limitations. The accuracy of those models depends on how closely they correspond to the actual data distribution, correlation, chosen parameters, and how closely statistics, the main input for Cardinality Estimation, model all aspects of actual data.
This scenario helps you to find significant inaccuracies in Cardinality Estimation for your actual execution plan, and suggests possible causes for those inaccuracies, as well as possible workarounds to improve the estimates. Note that this automation may not identify all possible root causes and workarounds. So while the information displayed here is a tentative mitigation opportunity to resolve an issue identified by this scenario, it should still help in understanding and improving efficiency of the query plan choice. Please, make sure to test any proposed workarounds before applying on your production system.
Let’s see what this new feature allows us know about our query execution plans using 3 approaches:
1. Single Plan Analysis
EDIT (12/7/2017): In latest SSMS 17.4, we have also enabled single plan analysis directly from actual plan produced. Saving a .sqlplan file is no longer required.
Let’s use a plan I captured (saved as .sqlplan file) and used in a previous blog post , and use this approach in a few simple steps:
2. Plan comparison between two previously saved plans
Now for a scenario where I already have a couple of rather complex query plans to compare. One I know works well, the other has perceived bad performance. Let’s use plan comparison to check the differences and similarities.
3. Using Query Store
Same experience as above.
More scenarios will come in future SSMS releases, and while we have some ideas on what scenarios will follow, we welcome the community feedback on what those scenarios should be. So please share your ideas with us, either opening a Connect item (so others can also vote on it), using the contact form in the right section of this blog, via Twitter or any other means you can reach out – feedback is always welcomed !
Pedro Lopes ( @sqlpto ) – Senior Program Manager
The community already uses tools that can make it easier to read and analyze query plans (including SSMS), but these require significant expertise in understanding query processing and plans in order to be able to actually find and fix root causes.
In the latest version of SSMS that released last week, we debut a new scenario-based issue identification feature for Comparison-based and Single Plan Analysis .
Based on common trends in the query performance troubleshooting space, and on years of our own experience troubleshooting query plan issues, we have been working on a functionality that implements some degree of automation in the task of query plan analysis, especially for those large and complex plans. The purpose is to make it easier to find common scenarios where plan choice may be inefficient, and get some recommendations on next steps to take.
In this first release, we added a “ Inaccurate Cardinality Estimation ” scenario. One of the most important inputs for the Query Optimizer to choose an optimal execution plan is the estimated number of rows to be retrieved per operator. These estimations model the amount of data to be processed by the query, and therefore drive cost estimation. The models used by the process of estimating number of rows, called Cardinality Estimation, may have limitations. The accuracy of those models depends on how closely they correspond to the actual data distribution, correlation, chosen parameters, and how closely statistics, the main input for Cardinality Estimation, model all aspects of actual data.
This scenario helps you to find significant inaccuracies in Cardinality Estimation for your actual execution plan, and suggests possible causes for those inaccuracies, as well as possible workarounds to improve the estimates. Note that this automation may not identify all possible root causes and workarounds. So while the information displayed here is a tentative mitigation opportunity to resolve an issue identified by this scenario, it should still help in understanding and improving efficiency of the query plan choice. Please, make sure to test any proposed workarounds before applying on your production system.
Let’s see what this new feature allows us know about our query execution plans using 3 approaches:
- Single plan analysis
- Plan comparison between two previously saved plans
- Using Query Store
1. Single Plan Analysis
EDIT (12/7/2017): In latest SSMS 17.4, we have also enabled single plan analysis directly from actual plan produced. Saving a .sqlplan file is no longer required.
Let’s use a plan I captured (saved as .sqlplan file) and used in a previous blog post , and use this approach in a few simple steps:
-
This is what we get opening in SSMS:
exec sp_executesql N'exec Sales.SalesFromDate @P1',N'@P1 datetime2(0)','2004-3-28 00:00:00'
-
Now right-click anywhere in a blank area of the plan and you can choose to “Analyze Actual Execution Plan”.
-
Notice a new panel opens. Under the
Scenarios
tab you can see the operators with a significant difference between estimations and actual rows. In this case I’m focusing on the SEEK, and in the
Finding Details
(right-side) I can see a few possible reasons for that difference.
For example, in 1) we see that the “(…) predicate for this operator depends on parameter @StartOrderDate. The compile-time value was unknown or different from the runtime value (…)”. Let’s investigate this one. -
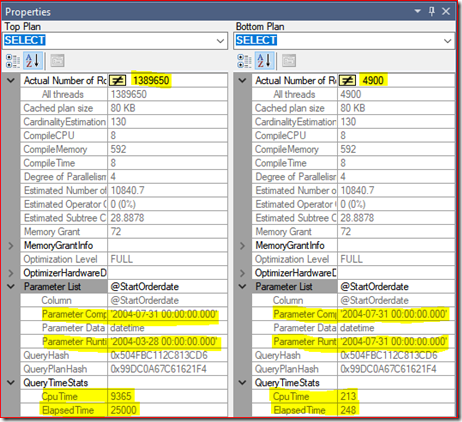
Clicking on the root node (SELECT) I can see it’s properties, namely information about parameters.
There it is, so compiled and runtime values are different indeed. This is a case of parameter sniffing hurting me, where a previously cached plan that was deemed good enough for the compiled parameter may not be good for other parameter values. -
Do they represent that much of a difference in performance? Given that we have both the compiled and runtime parameters, let’s use Plan Comparison to check the differences and similarities.
-
Plans are definitely the same (as expected).
exec sp_executesql N'exec Sales.SalesFromDate @P1',N'@P1 datetime2(0)','2004-7-31 00:00:00'
exec sp_executesql N'exec Sales.SalesFromDate @P1',N'@P1 datetime2(0)','2004-3-28 00:00:00'
-
Plans are definitely the same (as expected).


-
-
Yes, so plan with same compiled/runtime value works great (Bottom Plan), unlike the second execution (Top Plan). See Cpu Time and ElapsedTime below, as well as the different number of Actual Rows:
-
From this point on you would troubleshoot this class of issues using some known strategies. Here’s a few examples on how to deal with “bad” parameter sniffing, changing the stored procedure:
--Fix 1 - RECOMPILE
ALTER PROCEDURE Sales.SalesFromDate (@StartOrderdate datetime) AS
SELECT * FROM Sales.SalesOrderHeaderBulk AS h
INNER JOIN Sales.SalesOrderDetailBulk AS d ON h.SalesOrderID = d.SalesOrderID
WHERE (h.OrderDate >= @StartOrderdate)
OPTION (RECOMPILE)
GO
--Fix 2 - OPTIMIZE FOR
ALTER PROCEDURE Sales.SalesFromDate (@StartOrderdate datetime) AS
SELECT * FROM Sales.SalesOrderHeaderBulk AS h
INNER JOIN Sales.SalesOrderDetailBulk AS d ON h.SalesOrderID = d.SalesOrderID
WHERE (h.OrderDate >= @StartOrderdate)
--OPTION (OPTIMIZE FOR(@StartOrderDate = 'xxxx'))
OPTION (OPTIMIZE FOR UNKNOWN)
GO
--Fix 3 - local variable
ALTER PROCEDURE Sales.SalesFromDate (@StartOrderdate datetime) AS
DECLARE @date datetime
SELECT @date=@StartOrderDate
SELECT * FROM Sales.SalesOrderHeaderBulk AS h
INNER JOIN Sales.SalesOrderDetailBulk AS d ON h.SalesOrderID = d.SalesOrderID
WHERE (h.OrderDate >= @date)
GO
-
Or even turn off parameter sniffing at the database level if most of your workload has this class of issues:
ALTER DATABASE SCOPED CONFIGURATION SET PARAMETER_SNIFFING = OFF;
GO
-
Yes, so plan with same compiled/runtime value works great (Bottom Plan), unlike the second execution (Top Plan). See Cpu Time and ElapsedTime below, as well as the different number of Actual Rows:
2. Plan comparison between two previously saved plans
Now for a scenario where I already have a couple of rather complex query plans to compare. One I know works well, the other has perceived bad performance. Let’s use plan comparison to check the differences and similarities.
-
Plans are definitely the different (zooming out to see the overall plan shape). Notice the position of the highlighted Clustered Index Scan on
PhoneNumberType
table between the slow plan (top) and the fast plan (bottom):
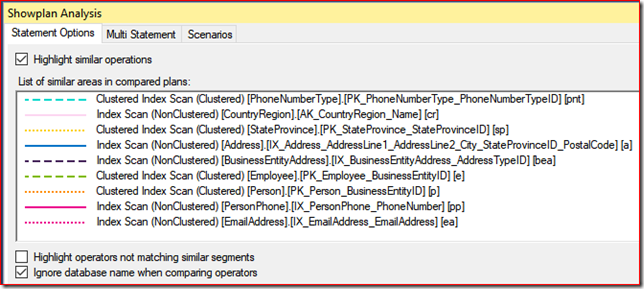
Use the Showplan Analysis panel (below) to navigate through the several matching operators and where they sit in the plan:
Tip : click on the operator line pattern, not the operator name.
There are other differences as we explore both plans, such as the presence of Table Spools in the slow plan, and a series of Nested Loops and Merge joins in the slow plan, whereas the fast plan is using Hash joins. Why the difference? -
Moving to the Scenarios tab, there’s an entry here, with some interesting information in Details:
-
Now we know a few details that allows us to proceed:
1) The difference lies primarily in the two plans using different CE versions.
2) The slow plan uses TF 9481, which sets the CE model to the SQL Server 2012 and earlier versions, irrespective of the compatibility level of the database.
5) Another evidence that estimations are very skewed in the slow plan (top). - In this case, simply stop using the TF and you’re done.


3. Using Query Store
Same experience as above.
-
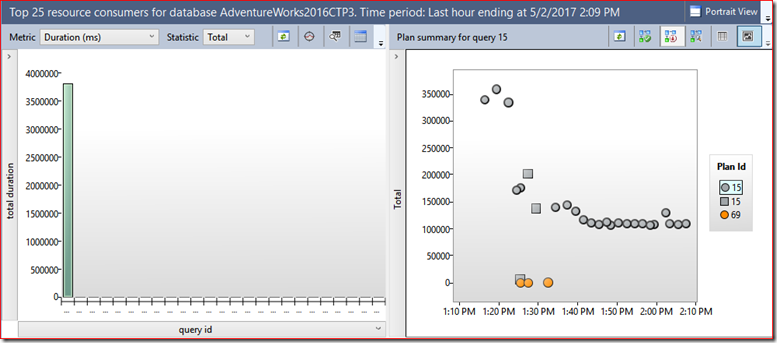
For example, using the
Top Resource Consuming Queries
report, I see a top consumer (query 15) has a couple plans.
-
Plan 15 consistently takes longer time, plan 69 consistently less. So we can select them both (CTRL + click on each plan) and click on the Compare button.
-
Output is same as before. Plan 69 is the good plan (now on top) and Plan 15 is bad plan (bottom). Same exercise where I can see very different query plan shapes.
-
Moving to the Scenarios tab, and same entry here, with same interesting information in Details, as we saw in the previous “saved plans” approach:


More scenarios will come in future SSMS releases, and while we have some ideas on what scenarios will follow, we welcome the community feedback on what those scenarios should be. So please share your ideas with us, either opening a Connect item (so others can also vote on it), using the contact form in the right section of this blog, via Twitter or any other means you can reach out – feedback is always welcomed !
Pedro Lopes ( @sqlpto ) – Senior Program Manager
Updated Mar 23, 2019
Version 2.0Pedro Lopes
Former Employee
Joined September 14, 2018
SQL Server Blog
Follow this blog board to get notified when there's new activity