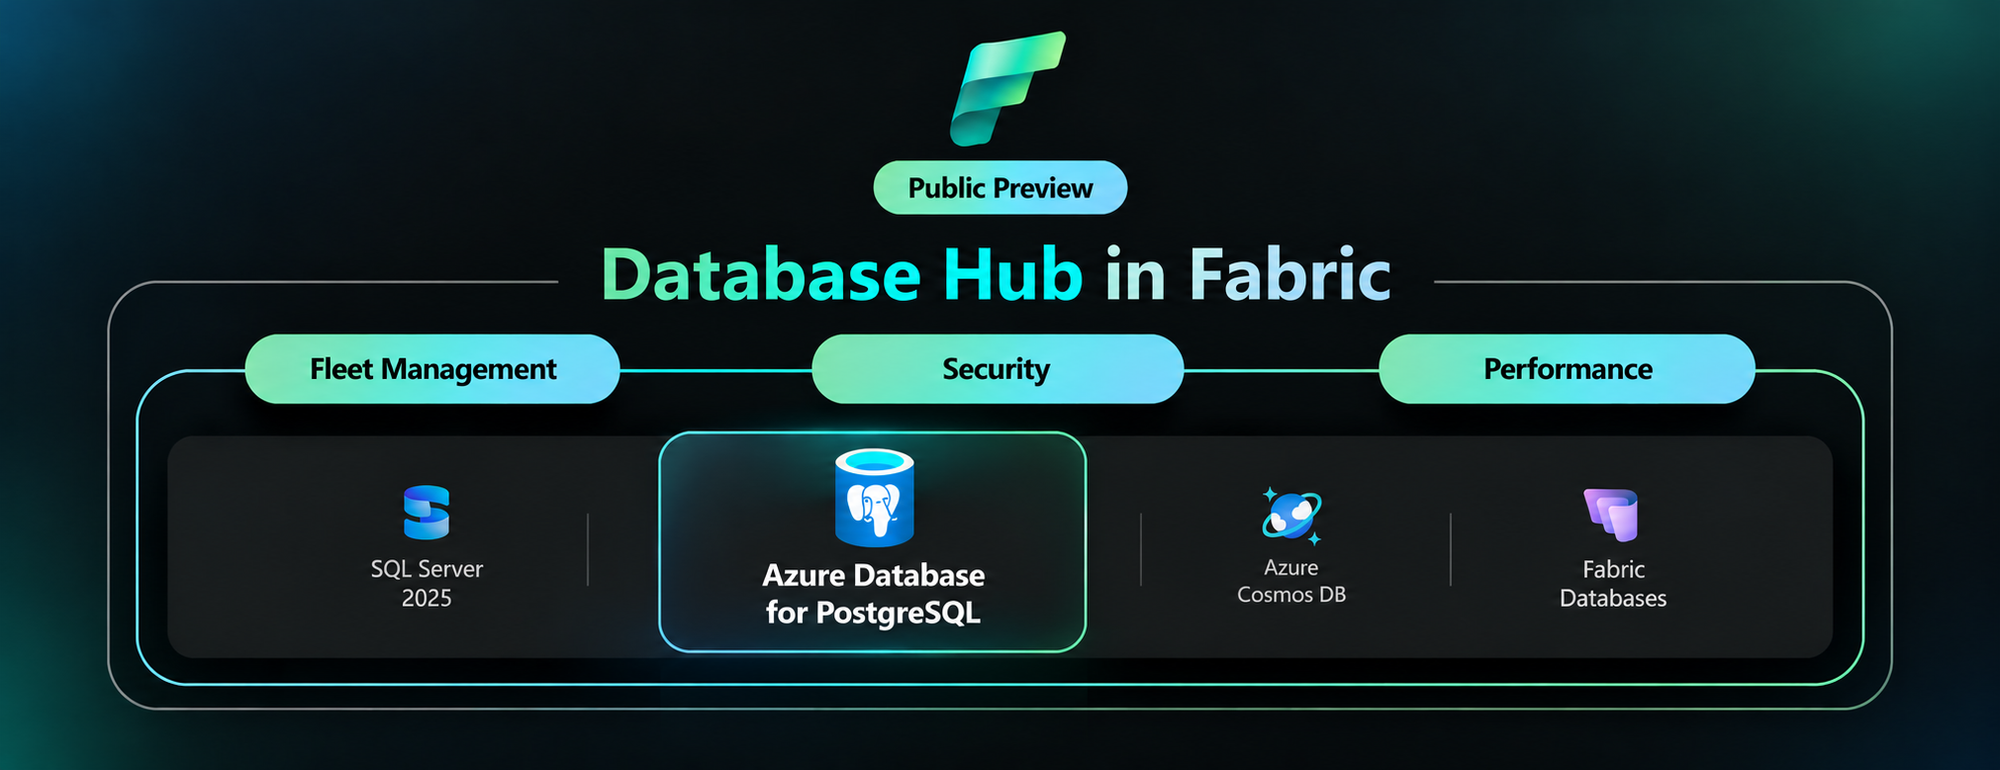
Discover your Azure PostgreSQL servers, review security posture, and investigate performance across your estate.
By Varun Dhawan, Matt McFarland, Erdem Tuna from Microsoft PostgreSQL team
Azure Database for PostgreSQL support in Database Hub is now in public preview, bringing fleet visibility, security posture, and performance monitoring into one place.
This preview is part of the broader vision outlined in our SQLCon Barcelona 2026 announcement: bringing database signals together so teams can see where attention is needed and take a well-informed next step. Here, we focus on the Azure PostgreSQL experience in Database Hub.
Database Hub in Microsoft Fabric lets you monitor existing flexible servers in their Azure subscriptions and regions, without moving or mirroring data or building a new customer-managed telemetry pipeline. Baseline monitoring uses existing Azure Monitor metrics. Available capabilities vary by database service.
Start with a practical question: Which PostgreSQL servers show sustained memory pressure, and which should I investigate first? Follow the three views below to narrow the scope and compare trends. See the PostgreSQL monitoring guide for setup and preview details.
1. Start with an estate-wide Overview
Overview brings cross-engine findings and performance summaries into one starting point. Spot a signal worth investigating, such as elevated PostgreSQL memory usage, then open Estate to focus on the relevant resources.
Figure 1: Overview combines cross-engine findings with performance summaries, including PostgreSQL, to help prioritize investigation. Illustrative mockup with sample data.
2. Focus on your Azure PostgreSQL estate
In Estate, select the PostgreSQL view and filter by subscription or resource group to define the scope for the memory-pressure investigation. Compare the flexible servers you can access before choosing resources to examine:
-
Filter your PostgreSQL estate by subscription or resource group to focus on the servers you manage.
-
Review a flexible server's resource details in one place. The inventory represents server instances, not each database hosted inside them.
-
Save and share a custom view for a scope you revisit regularly. Colleagues see only the resources their existing permissions allow.
Figure 2: Estate filtered to PostgreSQL, bringing flexible server resources, status, findings, and subscription context into one inventory. Illustrative mockup with sample data.
Once you have scoped your estate, switch to Performance and select the PostgreSQL servers you want to investigate.
3. Review security posture and performance
Security posture
In public preview, Database Hub assesses four aspects of your Azure PostgreSQL security configuration:
-
Microsoft Entra authentication: identify servers where it is not enabled.
-
Encryption at rest using customer-managed keys: review key management against your organization's policy. A server using service-managed keys is still encrypted at rest.
-
Microsoft Entra authentication enforced: review whether Microsoft Entra authentication is required, rather than only available as an option.
-
Public Network Access Disabled: review public exposure against your network policy. The private networking guidance explains the virtual network integration option.
Performance monitoring
In Performance, select the PostgreSQL dashboard and use CPU, memory, and storage summaries to identify servers that need a closer look. You can also review disk activity, connections, failed connections, and applicable read-replica lag. For the memory-pressure question, compare server trends over the same interval to distinguish sustained pressure from a brief spike. Use the Azure Monitor metric reference to match units and aggregation. Missing data is not proof of good health.
Figure 3: Performance monitoring with PostgreSQL selected, illustrating utilization summaries and trends for closer investigation. Illustrative mockup with sample data.
When a server needs a deeper look, continue in the Azure portal and PostgreSQL tools using the monitoring and diagnostics guidance.
Preview scope: Monitoring is metric-based; query-level diagnostics remain in native PostgreSQL tools. Security findings are not a complete compliance audit. Database Hub does not automatically tune, resize, or remediate PostgreSQL servers. Check the servers selected in Performance: dashboard scope can differ from the Estate inventory.
Why this matters if you run Postgres at scale
Database Hub doesn't replace your PostgreSQL expertise or native tools. It reduces the work of finding which servers need attention, alongside your other supported database engines including SQL Database and Cosmos DB. The Database Hub FAQ explains the access boundaries and how the experiences fit together.
Get started
Review the Database Hub documentation and PostgreSQL prerequisites, then:
-
Enable the preview: Ask your Fabric administrator to enable Users can access the Database hub (preview) in Tenant settings.
-
Check access: Use a Microsoft Entra identity with Reader or greater permissions on each subscription containing the servers you want to monitor.
-
Start here: open Database Hub in Microsoft Fabric.
-
Scope your estate: In Estate, choose View: PostgreSQL and filter to the subscriptions or resource groups you manage.
-
Compare servers: In Performance, select PostgreSQL, choose the servers to compare, and set the same time range and aggregation.
Access boundary: Resource visibility and shared views do not grant permission to query databases. Existing PostgreSQL authentication and network controls still apply.
As your PostgreSQL estate grows, Database Hub brings the bigger picture into focus, helping you see where attention is needed and take a more informed next step. We're excited to bring Azure PostgreSQL into this shared experience. Explore the public preview in Microsoft Fabric and discover a simpler way to stay on top of your PostgreSQL estate.

 Microsoft

