Almost 4 years ago, I wrote a script called GetTransactionLogStats.ps1 , and originally blogged about it here (where you can also download it). At the original time of writing, the primary purpose of the script was to collect transaction log generation data, and use that to determine the percentage of transaction logs generated per hour in an environment. This could in turn be used to populate the related fields in the Exchange Server Role Requirements Calculator.
Since originally writing this script, I’ve made some significant updates to how the script functions, and also added a handful of new features along the way, which were significant enough that I wanted to have a new post about it. Of note, the script now:
- Uses PowerShell Remoting to collect data from many remote servers in Parallel. This significantly speeds up collection speeds.
- Generates a database heat map, that compares the number of logs generated for each database to the number of logs generated for all databases. This can be used to identify databases that may be overloaded or underloaded.
- Uses only log generation information from active database copies to determine log generation statistics.
- Accepts the target servers via a script parameter instead of via a text file.
Requirements
The script has the following requirements;
- Target Exchange Servers must be running Exchange 2010, 2013, or 2016
- PowerShell Remoting must be enabled on the target Exchange Servers, and configured to allow connections from the machine where the script is being executed.
Parameters
The script has the following parameters:
- Gather: Switch specifying we want to capture current log generations. If this switch is omitted, the -Analyze switch must be used.
- Analyze: Switch specifying we want to analyze already captured data. If this switch is omitted, the -Gather switch must be used.
- ResetStats: Switch indicating that the output file, LogStats.csv, should be cleared and reset. Only works if combined with –Gather.
- WorkingDirectory: The directory containing LogStats.csv. If omitted, the working directory will be the current working directory of PowerShell (not necessarily the directory the script is in).
- LogDirectoryOut: The directory to send the output log files from running in Analyze mode to. If omitted, logs will be sent to WorkingDirectory.
Usage
Runs the script in Gather mode, taking a single snapshot of the current log generation of all databases on servers server1 and server2:
PS C:\> .\GetTransactionLogStats.ps1 -Gather -TargetServers "server1","server2"
Runs the script in Gather mode, specifies an alternate directory to output LogStats.csv to, and resets the stats in LogStats.csv if it exists:
PS C:\> .\GetTransactionLogStats.ps1 -Gather -TargetServers "server1","server2" -WorkingDirectory "C:\GetTransactionLogStats" -ResetStats
Runs the script in Analyze mode:
PS C:\> .\GetTransactionLogStats.ps1 -Analyze
Runs the script in Analyze mode, and specifies an alternate directory to send the output files to:
PS C:\> .\GetTransactionLogStats.ps1 -Analyze -LogDirectoryOut "C:\GetTransactionLogStats\LogsOut"
Output File After Running in Gather Mode
LogStats.csv
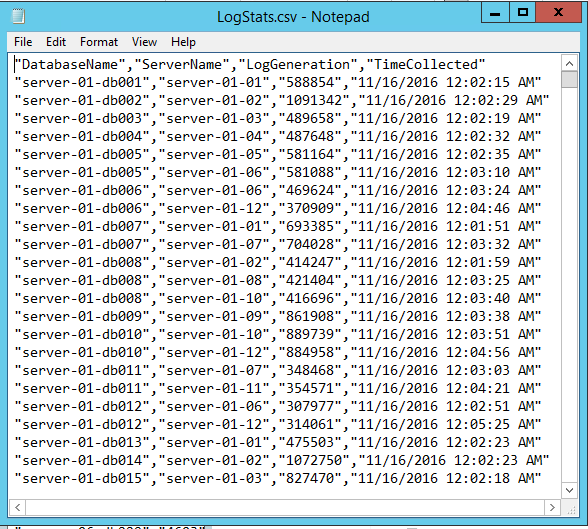
When run in Gather mode, the log generation snapshots that are taken are sent to LogStats.csv. The following shows what this file looks like:
Output Files After Running in Analyze Mode
LogGenByHour.csv
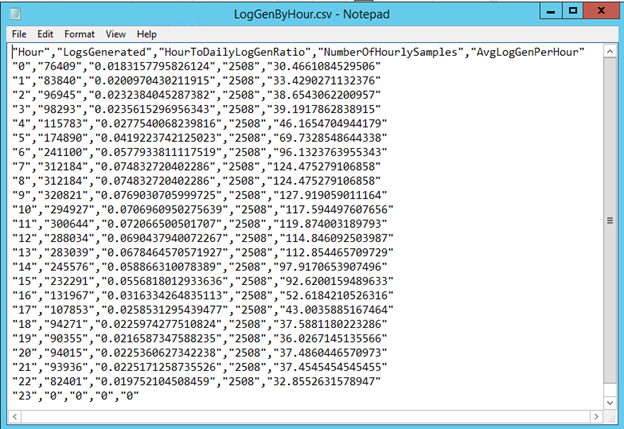
This is the primary output file for the script, and is what is used to populate the hourly generation rates in the Exchange Server Role Requirements Calculator. It consists of the following columns:
- Hour: The hour that log stats are being gathered for. Can be between 0 – 23.
- LogsGenerated: The total number of logs created during that hour for all days present in LogStats.csv.
- HourToDailyLogGenRatio: The ratio of all logs that that particular hour accounts for. The sum of values for this column in all 24 hours in the table should be 1, and can be copied directly into the Exchange Server Role Requirements Calculator.
- NumberOfHourlySamples: The number of hourly samples that were used to calculate each hour value.
- AvgLogGenPerHour: The average number of logs generated per database per hour.
LogGenByDB.csv
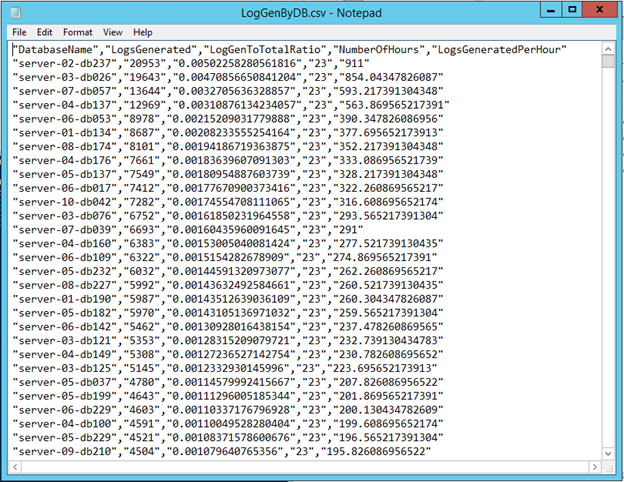
This file contains a heat map showing how many logs were generated for each database during the duration of the collection. This information can be used to figure out if databases, servers, or entire Database Availability Groups, are over or underutilized compared to their peers. It consists of the following columns:
- DatabaseName: The name of the database being measured.
- LogsGenerated: The total number of logs created by primary copies of that database during the duration of the collection.
- LogGenToTotalRatio: The ratio of logs generated for this database compared to logs generated for all databases.
- NumberOfHours: The number of hourly samples that were taken for this database.
- LogsGeneratedPerHour: The average number of logs generated per hour for this database.
LogGenByDBByHour.csv
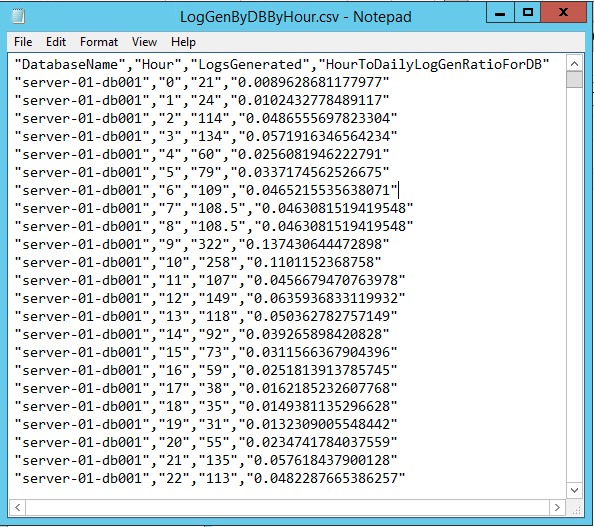
This file is similar to LogGenByDB.csv, but shows the log generation rates per hour for each database. It consists of the following columns:
- DatabaseName: The name of the database being measured.
- Hour: The hour that log stats are being gathered for. Can be between 0 – 23.
- LogsGenerated: The total number of logs created by primary copies of that database during that hour.
- HourToDailyLogGenRatioForDB: The ratio of logs generated for this hour and this database compared to the total logs generated for this database.
Running As a Scheduled Task
Since the script is designed to be run an hourly basis, the easiest way to accomplish that is to run the script via a Scheduled Task. The way I like to do that is to create a batch file which calls Powershell.exe and launches the script, and then create a Scheduled Task which runs the batch file. The following is an example of the command that should go in the batch file:
powershell.exe -noninteractive -noprofile -command “& {C:\LogStats\GetTransactionLogStats.ps1 -Gather -Targe
tServers “server1”,”server2” -WorkingDirectory C:\LogStats}”
In this example, the script is located in C:\LogStats. Note that I specified a WorkingDirectory of C:\LogStats so that if the Scheduled Task runs in an alternate location (by default C:\Windows\System32), the script knows where to find and where to write LogStats.csv. Also note that the command does not load any Exchange snapin, as the script doesn’t use any Exchange specific commands.
Mike Hendrickson


