Update 1/31/2017: Please see the updated version of this post that explains a significant update to this script. To download the script, see the attachment to this blog post.
Overview
When designing a site resilient Exchange Server solution, one of the required planning tasks is to determine how many transaction logs are generated on an hourly basis. This helps figure out how much bandwidth will be required when replicating database copies between sites, and what the effects will be of adding additional database copies to the solution. If designing an Exchange solution using the Exchange Server Role Requirements Calculator, the percent of logs generated per hour is an optional input field. Previously, the most common method of collecting this data involved taking captures of the files in each log directory on a scheduled basis (using dir, Get-ChildItem, or CollectLogs.vbs). Although the log number could be extracted by looking at the names of the log files, there was a lot of manual work involved in figuring out the highest the log generation from each capture, and getting rid of duplicate entries. Once cleaned up, the data still had to be analyzed manually using a spreadsheet or a calculator. Trying to gather data across multiple servers and databases further complicated matters. To improve upon this situation, I decided to write an all-in-one script that could collect transaction log statistics, and analyze them after collection. The script is called GetTransactionLogStats.ps1. It has two modes: Gather and Analyze. Gather mode is designed to be run on an hourly basis, on the top of the hour. When run, it will take a single set of snapshots of the current log generation number for all configured databases. These snapshots will be sent, along with the time the snapshots were taken, to an output file, LogStats.csv. Each subsequent time the script is run in Gather mode, another set of snapshots will be appended to the file. Analyze mode is used to process the snapshots that were taken in Gather mode, and should be run after a sufficient amount of snapshots have been collected (at least 2 weeks of data is recommended). When run, it compares the log generation number in each snapshot to the previous snapshot to determine how many logs were created during that period.
Script Features
Less Data to Collect
Instead of looking at the files within log directories, the script uses Perfmon to get the current log file generation number for a specific database or storage group. This number, along with the time it was obtained, is the only information kept in the output log file, LogStats.csv. The performance counters that are used are as follows:
Exchange 2013/2016
MSExchangeIS HA Active Database\Current Log Generation Number
Exchange 2010
MSExchange Database ==> Instances\Log File Current Generation
Note: The counter used for Exchange 2013/2016 contains the active databases on that server, as well as any now passive databases that had been activated on that server at some point since the last reboot. The counter used for Exchange 2010 contains all databases on that server, including all passive copies. To only get data from active databases, make sure to manually specify the databases for that server in the TargetServers.txt file. Alternately you can use the DontAnalyzeInactiveDatabases parameter when performing the analysis to exclude databases that did not increment their log count.
Multi Server/Database Support
The script takes a simple input file, TargetServers.txt, where each line in the file specifies the server, or server and databases to process. If you want to get statistics for all databases on a server, only the server name is necessary. If you want to only get a subset of databases on a server (for instance if you wanted to omit secondary copies on an Exchange 2010 server), then you can specify the server name, followed by each database you want to process.
Built In Analysis Capability
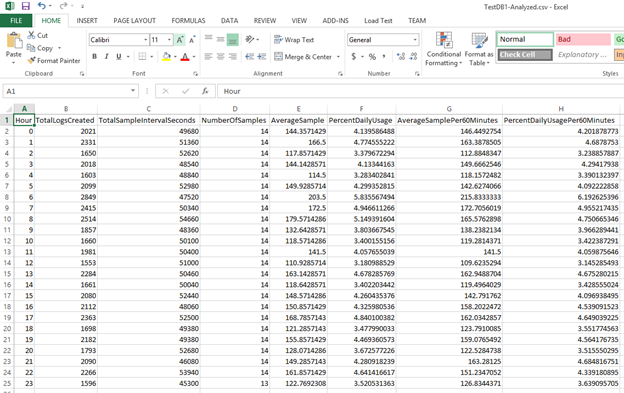
The script has the ability to analyze the output log file, LogStats.csv, that was created when run in Gather mode. It does a number of common calculations for you, but also leaves the original data in case any other calculations need to be done. Output from running in Analyze mode is sent to multiple .CSV files, where one file is created for each database, and one more file is created containing the average statistics for all analyzed databases. The following columns are added to the CSV files:
- Hour: The hour that log stats are being gathered for. Can be between 0 – 23.
- TotalLogsCreated: The total number of logs created during that hour for all days present in LogStats.csv.
- TotalSampleIntervalSeconds: The total number of seconds between each valid pair of samples for that hour. Because the script gathers Perfmon data over the network, the sample interval may not always be exactly one hour.
- NumberOfSamples: The number of times that the log generation was sampled for the given hour.
- AverageSample: The average number of logs generated for that hour, regardless of sample interval size. Formula: TotalLogsCreated / NumberOfSamples.
- PercentDailyUsage: The percent of all logs that that particular hour accounts for. Formula: LogsCreatedForHour / LogsCreatedForAllHours * 100.
- PercentDailyUsageForCalc: The ratio of all logs for this hour compared to all logs for all hours. Formula: LogsCreatedForHour / LogsCreatedForAllHours.
- verageSamplePer60Minutes: Similar to AverageSample, but adjusts the value like each sample was taken exactly 60 minutes apart. Formula: TotalLogsCreated / TotalSampleIntervalSeconds * 3600.
Database Heat Map
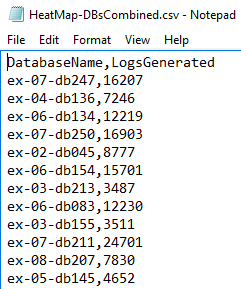
As of version 2.0, this script now also generates a database heat map when run in Analyze mode. The heat map shows how many logs were generated for each database during the duration of the collection. This information can be used to figure out if databases, servers, or entire Database Availability Groups, are over or underutilized compared to their peers. The database heat map consists of two files: HeatMap-AllCopies.csv: A heat map of all tracked databases, including databases that may have failed over during the collection duration, and were tracked on multiple servers. This heat map shows the server specific instance of each database. Example:  HeatMap-DBsCombined.csv: A heat map containing only a single instance of each unique database. In cases where multiple copies of the same database had generated logs, the log count from each will be combined into a single value. Example:
Requirements
The script has the following requirements;
- Target Exchange Servers must be running Exchange 2010, 2013, or 2016
- PowerShell Remoting must be enabled on the target Exchange Servers, and configured to allow connections from the machine where the script is being executed.
Parameters
The script has the following parameters:
- -Gather: Switch specifying we want to capture current log generations. If this switch is omitted, the -Analyze switch must be used.
- -Analyze: Switch specifying we want to analyze already captured data. If this switch is omitted, the -Gather switch must be used.
- -ResetStats: Switch indicating that the output file, LogStats.csv, should be cleared and reset. Only works if combined with –Gather.
- -WorkingDirectory: The directory containing TargetServers.txt and LogStats.csv. If omitted, the working directory will be the current working directory of PowerShell (not necessarily the directory the script is in).
- -LogDirectoryOut: The directory to send the output log files from running in Analyze mode to. If omitted, logs will be sent to WorkingDirectory.
- -MaxSampleIntervalVariance: The maximum number of minutes that the duration between two samples can vary from 60. If we are past this amount, the sample will be discarded. Defaults to a value of 10.
- -MaxMinutesPastTheHour: How many minutes past the top of the hour a sample can be taken. Samples past this amount will be discarded. Defaults to a value of 15.
- -MonitoringExchange2013: Whether there are Exchange 2013/2016 servers configured in TargetServers.txt. Defaults to $true. If there are no 2013/2016 servers being monitored, set this to $false to increase performance.
- -DontAnalyzeInactiveDatabases: When running in Analyze mode, this specifies that any databases that have been found that did not generate any logs during the collection duration will be excluded from the analysis. This is useful in excluding passive databases from the analysis.
Usage
Runs the script in Gather mode, taking a single snapshot of the current log generation of all configured databases:
PS C:\> .\GetTransactionLogStats.ps1 -Gather
Runs the script in Gather mode, and indicates that no Exchange 2013/2016 servers are configured in TargetServers.txt:
PS C:\> .\GetTransactionLogStats.ps1 -Gather -MonitoringExchange2013 $false
Runs the script in Gather mode, and changes the directory where TargetServers.txt is located, and where LogStats.csv will be written to:
PS C:\> .\GetTransactionLogStats.ps1 -Gather -WorkingDirectory "C:\GetTransactionLogStats" -ResetStats
Runs the script in Analyze mode:
PS C:\> .\GetTransactionLogStats.ps1 -Analyze
Runs the script in Analyze mode, and excludes database copies that did not generate any logs during the collection duration:
PS C:\> .\GetTransactionLogStats.ps1 -Analyze -DontAnalyzeInactiveDatabases $true
Runs the script in Analyze mode, sending the output files for the analysis to a different directory. Specifies that only sample durations between 55-65 minutes are valid, and that each sample can be taken a maximum of 10 minutes past the hour before being discarded:
PS C:\> .\GetTransactionLogStats.ps1 -Analyze -LogDirectoryOut "C:\GetTransactionLogStats\LogsOut" -MaxSampleIntervalVariance 5 -MaxMinutesPastTheHour 10
Example TargetServers.txt
The following example shows what the TargetServers.txt input file should look like. For the server1 and server3 lines, no databases are specified, which means that all databases on the server will be sampled. For the server2 and server4 lines, we will only sample the specified databases on those servers. Note that no quotes are necessary for databases with spaces in their names. 
Output File After Running in Gather Mode
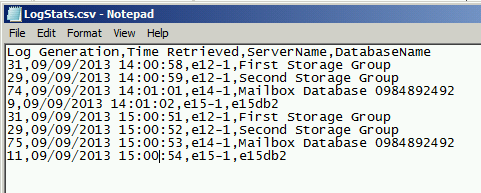
When run in Gather mode, the log generation snapshots that are taken are sent to LogStats.csv. The following shows what this file looks like: 
Output File After Running in Analyze Mode
The following shows the analysis for a single database after running the script in Analyze mode: 
Running As a Scheduled Task
Since the script is designed to be run an hourly basis, the easiest way to accomplish that is to run the script via a Scheduled Task. The way I like to do that is to create a batch file which calls Powershell.exe and launches the script, and then create a Scheduled Task which runs the batch file. The following is an example of the command that should go in the batch file:
powershell.exe -noninteractive -noprofile -command "& {C:\LogStats\GetTransactionLogStats.ps1 -Gather -WorkingDirectory C:\LogStats}"
In this example, the script, as well as TargetServers.txt, are located in C:\LogStats. Note that I specified a WorkingDirectory of C:\LogStats so that if the Scheduled Task runs in an alternate location (by default C:\Windows\System32), the script knows where to find TargetServers.txt and where to write LogStats.csv. Also note that the command does not load any Exchange snapin, as the script doesn’t use any Exchange specific commands.
Notes
The following information only applies to versions of this script older than 2.0:
- By default, the Windows Firewall on an Exchange 2013 server running on Windows Server 2012 does not allow remote Perfmon access. I suspect this is also the case with Exchange 2013 running on Windows Server 2008 R2, but haven’t tested. If either of the below errors are logged, you may need to open the Windows Firewall on these servers to allow access from the computer running the script.
ERROR: Failed to read perfmon counter from server SERVERNAME ERROR: Failed to get perfmon counters from server SERVERNAME
Update: After noticing that multiple people were having issues getting this to work through the Windows Firewall, I tried enabling different combinations of built in firewall rules until I could figure out which ones were required. I only tested on an Exchange 2013 server running on Windows Server 2012, but this should apply to other Windows versions as well. The rules I had to enable were:
File and Printer Sharing (NB-Datagram-In) File and Printer Sharing (NB-Name-In) File and Printer Sharing (NB-Session-In)
Mike Hendrickson
Updates
- 11/5/2013 added a section on firewall rules to try.
- 7/17/2014 added a section on running as a scheduled task.
- 3/28/2016 Version 2.0:
- Instead of running Get-Counter -ComputerName to remotely access Perfmon counters, the script now uses PowerShell Remoting, specifically Invoke-Command -ComputerName, so that all counter collection is done locally on each target server. This significantly speeds up the collection duration.
- The script now supports using the -Verbose switch to provide information during script execution.
- Per Thomas Stensitzki's script variation, added in functionality so that DateTime's can be properly parsed on non-English (US) based computers.
- Added functionality to generate a database heat map based on log usage.
- 6/22/2016 Version 2.1:
- When run in -Gather mode, the script now uses Test-WSMan against each target computer to verify Remote PowerShell connectivity prior to doing the log collection.
- Added new column to log analysis files, PercentDailyUsageForCalc, which allows for direct copy/paste into the Exchange Server Role Requirements Calculator. Additionally, the script will try to ensure that all rows in the column add up to exactly 1 (requires samples from all 24 hours of the day).
- Significantly increased performance of analysis operations.