This exercise evaluates SQL reads, writes, and lock waiting under a file-triggered Hybrid Logic Apps workload in a fully disconnected, single-node, on-premises OpenShift runtime environment. SQL Server 2025, local SMB storage, and the cluster VM share one Windows host and backing disk. The aim is to understand runtime database behavior under integration load.
Key findings for technical decision makers
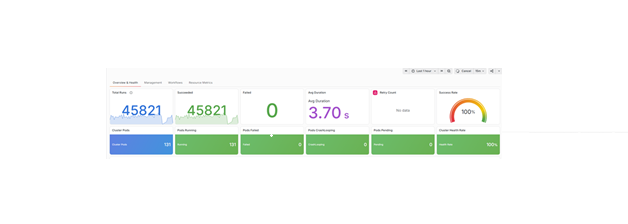
Hybrid Logic Apps ran a high-volume, file-driven integration workload on deliberately modest on-premises hardware: one host shared by the cluster, file storage and SQL Server 2025. Across both 30-minute tests there were no failed runs, and the one-hour dashboard view showed 45,821 successful runs at a 100% success rate.
The database was not a cost driver: SQL Server used an average of 1.83% of host CPU capacity. Most runs finished in about 4 seconds, with a longer tail for the slowest 1%. The factor that most affects scale is storage, not server count, because adding workflow instances does not add disk capacity.
For planning, budget for dedicated storage for the database and files as volumes grow, size capacity on peak and tail response times rather than averages, and validate with your own workloads. These results are a baseline for one workload, not a product-wide capacity guarantee.
A practical look at throughput, latency, reads, writes, and locks
The primary goal of this exercise is to evaluate SQL read and write behavior and the time spent waiting for locks under integration load. Workflow throughput supplies the workload context; it is not a substitute for those database measurements. This is a mixed-workload observation, not an isolated SQL capacity test.
In a 30-minute baseline, files were offered to an Azure Logic Apps workflow at approximately 100 files per second. SQL CPU usage remained low, while a substantial file backlog accumulated.
The lesson is not that one component is necessarily slow. It is that a useful benchmark must connect offered load, completed throughput, latency, and waiting rather than treating any one metric as the answer.
The SQL comparison tells a different story from workflow throughput alone: average workflow-state data-file write I/O latency rose from 12.958 to 38.652 ms, while accumulated instance-wide lock waiting remained near 1,470 task-seconds. Faster workflow completion did not mean that every SQL measurement improved.
A repeat of the same 30-minute workload subsequently showed 3.87% higher successful throughput, 6.40% lower p95 execution latency, and 8.68% lower p99 execution latency, with no failed workflow runs in either measured window. Both measurements are retained below: the repeat was an observed improvement, not proof of a tuning change or a product-wide performance guarantee.
The workflow
The workflow snapshot shows the processing sequence used in the benchmark. The workflow is taken such that huge set of I/O operations are performed during the workflow executions to simulate the SQL benchmarking under high I/O operations.
The workflow performs six steps:
- Detect a newly created file in a receiving folder.
- Insert a business record into SQL.
- Read the source file's contents.
- Create a copy in a destination folder.
- Delete the source file.
- Delete the destination copy.
This is a synthetic processing-and-cleanup scenario, not an archival workflow: both test-file copies are removed on successful completion. A successful run means that the complete sequence finished, not just that the SQL insert succeeded.
Infrastructure: OpenShift K8se cluster with single node, one shared disk
The deployment topology is a hosted Windows machine running an on-premises, single-node OpenShift cluster in a Linux VM, with local SMB storage and SQL Server 2025 on the same Windows host. The SMB files, SQL data and transaction logs, and cluster VM storage all share the same host drive and backing disk. Different folders or virtual disks on that shared backing disk do not create independent I/O capacity.
The workflow operates in a fully disconnected runtime environment: the execution and data paths shown remain local, without an external runtime-service dependency for this workflow. This documents the supplied runtime topology, not an independent network-isolation test or a claim about offline installation and management.
Autoscaling adds workflow pods, not OpenShift nodes or additional disks. The configured 1-10 replicas therefore share the same single-node compute and storage resources.
This layout matters when interpreting performance. File creation, reads, copies, and deletion can overlap with SQL reads, data writes, transaction-log writes, and cluster storage activity on the same disk. More pods can increase that shared I/O demand without increasing disk capacity. Storage delays can also lengthen transactions and the time locks remain held, but the topology alone does not establish that disk contention caused the measured blocking or throughput limit.
How the baseline was measured
The test offered small, 1 KiB files at a target rate of 100 files per second for 30 minutes. The existing workflow and database configuration were retained during the measurement; this was a baseline, not a tuned result.
Measurements covered file publication, workflow starts and outcomes, execution duration, SQL request timing, SQL process resources, database-file I/O, and blocking. Existing autoscaling remained enabled, so this was not a fixed-replica benchmark.
Observability also has a cost: these are instrumented results, not a claim of zero measurement overhead.
SQL benchmark: reads, writes, and locking periods
The database results below come from the two measured 30-minute exercises, not from the one-hour dashboard view later in this post. SQL counter snapshots bracket each exercise: approximately 1,801.16 seconds for the initial workflow-state observation and 1,801.74 seconds for the repeat. Business-data counter coverage is approximately 1,801.16 and 1,801.71 seconds. The workflow load-generation window itself is exactly 1,800 seconds.
| Evaluation | Plain-language question | What the saved measurements can answer |
|---|---|---|
| Read | How much information does SQL retrieve, and how long do disk reads take? | Physical database-file read counts and average I/O latency; completed SQL request timing. |
| Write | How much information does SQL save, and how long do data and log writes take? | Physical data-file and log-file write counts and average I/O latency; completed SQL request timing. |
| Locking period | How long does an operation wait for another operation, and how long does the owner hold its lock? | Accumulated lock-wait time, waiting-task counts, and sampled blocking. Individual lock-hold durations were not recorded. |
Read and write I/O: volume and latency
The two database roles are labeled workflow state and business data. Each row below describes a file-I/O operation, not an individual SQL statement.
| Database role / file | I/O operation | Initial count | Repeat count | Initial average ms/I/O | Repeat average ms/I/O |
|---|---|---|---|---|---|
| Workflow state / data | Read | 35,169 | 9,331 | 0.896 | 0.571 |
| Workflow state / data | Write | 74,146 | 90,913 | 12.958 | 38.652 |
| Workflow state / log | Write | 318,134 | 334,775 | 0.938 | 1.115 |
| Business data / data | Read | 104 | 19 | 0.923 | 0.474 |
| Business data / data | Write | 124 | 14 | 0.919 | 0.714 |
| Business data / log | Write | 25,826 | 27,018 | 1.152 | 1.425 |
Average read I/O latency = read-stall milliseconds / read I/O count. Average write I/O latency = write-stall milliseconds / write I/O count. These are operation-weighted counter ratios, not averages of sample averages.
The repeat performed fewer physical data reads and more workflow-state writes. Its average workflow-state data-file write latency was approximately three times the initial value. Workflow-state log writes also became slower on average. The small business-data file-I/O counts should not be treated as a stable disk-performance estimate.
A read satisfied from memory need not cause a physical file read. Likewise, many row changes can be persisted together, and transaction-log writes are distinct from later data-page writes. Consequently, these counts are not SELECT counts, INSERT counts, or committed business-record counts. None of the file-I/O averages is the duration of an entire SQL statement or transaction.
Completed SQL request timing
SQL requests provide a separate view of elapsed server-side work. The trace selected events completed within each exact 30-minute window. Percentiles are approximate; requests still running at cutoff are excluded.
| Database role / request type | Window | Completed events | Average ms | p95 ms | p99 ms |
|---|---|---|---|---|---|
| Workflow state / remote call | Initial | 1,127,136 | 1.780 | 2.431 | 62.479 |
| Workflow state / remote call | Repeat | 1,170,736 | 1.647 | 1.643 | 52.385 |
| Business data / remote call | Initial | 81,114 | 0.960 | 1.354 | 14.487 |
| Business data / remote call | Repeat | 84,220 | 1.041 | 1.225 | 15.503 |
| Workflow state / SQL batch | Initial | 586 | 0.244 | 0.382 | 0.557 |
| Workflow state / SQL batch | Repeat | 645 | 101.029 | 33.750 | 7,967.948 |
A remote call is a completed RPC event, not necessarily one statement. These request populations mix reads, writes, and supporting work; they do not establish separate SELECT-only or INSERT-only latency distributions. Batch events are shown separately rather than hidden inside the much larger remote-call population. Database-wide activity can include monitoring and dashboard requests, so this is not an application-only isolation test.
The repeat improved workflow-state remote-call latency, but business-data p99 and batch latency worsened. There is no basis for saying that all SQL latency improved.
Lock waiting: duration, concurrency, and observation period
A lock hold belongs to the operation owning the lock: acquisition through release. A lock wait belongs to another operation waiting to obtain a conflicting lock. These are different periods; a waiting operation's duration does not reveal precisely how long the owner held the lock.
| Locking measurement | Scope | Initial | Repeat |
|---|---|---|---|
| Accumulated lock-wait time | SQL instance | 1,473.235 s | 1,467.470 s |
| Lock-waiting task count | SQL instance | 51,283 | 50,548 |
| Wait-time / waiting-task counter ratio | SQL instance | 28.728 ms | 29.031 ms |
| Range/update coordination waits | SQL instance | 1,287.958 s | 1,273.562 s |
| Update coordination waits | SQL instance | 183.449 s | 168.197 s |
| Other lock waits | SQL instance | 1.828 s | 25.711 s |
| Peak sampled blocked requests | Workflow-state database | 16 | 20 |
| Snapshots showing blocked requests | Workflow-state database | 85 / 353 | 78 / 354 |
| Longest span of consecutive positive blocking snapshots | Workflow-state database | Approximately 15.2 s | Approximately 10.2 s |
The cumulative lock counters are instance-wide and reported once, not added again for each database. Other activity on the instance can contribute. They count waiting SQL tasks, not unique transactions, locks, or workflow runs. The mean counter ratio is not a measured per-lock hold time or a lock-wait percentile.
1,473 accumulated wait-seconds does not mean the database was continuously blocked for 1,473 seconds. Concurrent tasks can wait at the same time. The totals cannot be divided by test duration and described as the percentage of the test spent blocked.
The roughly five-second snapshots count requests blocked by another identified session. They do not record each request's wait type or lock lifetime. The longest positive-snapshot span means blocking was present at successive observations; different requests may have been involved, and blocking could have stopped between samples. It is not proof of one continuous blocking episode or one transaction holding a lock for that long. No blocked business-data requests were seen in the snapshots; brief blocking between samples remains possible.
For write-related context, instance-wide waiting for transaction-log flushes accumulated 1,200.092 seconds initially and 1,390.289 seconds in the repeat. These are task-wait sums, not individual commit latency or additional time to add to workflow duration.
What this does and does not establish
The exercise establishes measured read/write I/O volume and average latency, mixed SQL request timing, and aggregate lock waiting with sampled blocking under the workflow workload. It does not establish isolated SQL read/write capacity, statement-specific read/write latency, exact blocking-episode lengths, or p50/p95/p99 lock-hold durations.
One-hour dashboard results (Initial + repeat)
These are actual values from the supplied dashboard with Last 1 hour visibly selected. This is a rolling dashboard observation, not a newly executed one-hour controlled load test.
| Measurement | Dashboard result |
|---|---|
| Selected observation period | Last 1 hour |
| Total runs displayed | 45,821 |
| Successful runs displayed | 45,821 |
| Failed runs displayed | 0 |
| Displayed successful count / 3,600 seconds | 12.728 runs/second |
| Average execution duration displayed | 3.70 seconds |
| Success rate displayed | 100% |
| Retry count | No data |
Processing beyond the cutoff
This supplied dashboard view spans a longer period than the 30-minute baseline. Processing continues after file generation stops.
The displayed run total belongs to the dashboard's selected scope and aggregation. It is not the number of successful completions during the fixed measurement window, and it has not been reconciled to the exact benchmark cohort. The curve shows run counts over time, not a cumulative completion counter; its bucket size is not specified here, so the vertical values should not be read as runs per second.
Latency: look beyond the average
| Successful workflow execution duration | Result |
|---|---|
| Average | 4.11 seconds |
| p50 | Approximately 3.89 seconds |
| p95 | Approximately 6.20 seconds |
| p99 | Approximately 13.01 seconds |
| Maximum | 23.71 seconds |
These durations measure workflow execution after a run starts. They exclude time spent waiting in the receiving folder. As the backlog grows, a file's arrival-to-completion time can be much longer.
Each point summarizes one minute. Workflow duration uses seconds; SQL request duration uses milliseconds. The SQL panels separate requests associated with workflow state from requests associated with business data, without exposing database identities.
The first few minutes show higher workflow latency than much of the later window. The chart exposes this change but does not, by itself, establish its cause.
The workflow chart includes successful runs completed by cutoff. SQL timing includes captured completed requests; requests still running at cutoff are not represented in those percentiles. Workflow bucket and whole-window comparison percentiles were computed from the observed completed runs; displayed values are rounded. SQL percentiles are approximate.
SQL activity in the broader observation period
These supplied SQL panels provide broader context, not additional fixed-window baseline results.
SQL operations per second counts database work, not completed workflow runs: one workflow can require multiple SQL operations. The CPU line here is measured in milliseconds of SQL execution CPU time, not the percentage of host capacity shown below. Dashboard time ranges and aggregation differ from the baseline charts, so their averages and totals should not be substituted for the 30-minute measurements.
| SQL process measurement | Result |
|---|---|
| Average CPU, normalized to host capacity | 1.83% |
| Peak sampled CPU, normalized to host capacity | 8.08% |
| Physical memory at the first recorded sample | Approximately 1.20 GiB |
| Physical memory at the last recorded sample and peak | Approximately 3.15 GiB |
These are instance-wide SQL process measurements, not workflow-container utilization or total machine utilization. CPU points represent roughly five-second interval averages, not instantaneous peaks. The dashed reference uses the reported full-window average; the recorded series ends slightly before cutoff and is not extrapolated.
A system can have CPU headroom while work waits for storage, another transaction, a network response, or another part of the workflow. Aggregate CPU usage can also hide a narrower, serialized bottleneck.
Configured scaling and application resources
The deployment's configured scaling values were captured after the repeat. Application-configuration fingerprints matched before and after the test.
| Scaling setting | Captured value |
|---|---|
| Minimum replicas | 1 |
| Maximum replicas | 10 |
| Polling interval | 30 seconds |
| Configured cooldown | 300 seconds |
Polling and cooldown values describe configuration, not guaranteed reaction times. Actual scaling also depends on controller decisions and stabilization.
The dashboard's matching-pod count rises from about one to five, then steps down through four to three during the repeat. A later increase occurs after the measurement cutoff, while queued work continues processing.
This panel counts matching pod records; it does not filter explicitly for readiness. It should not be interpreted as proof that every displayed pod was ready at every instant. Independent runtime checks found one ready replica before the repeat and three after it.
The captured resource budget also distinguishes the application container from the entire pod:
| Resource scope, per replica | CPU request | CPU limit | Memory request | Memory limit |
|---|---|---|---|---|
| Application container | 0.425 cores | 1 core | 1,844 MiB | 2 GiB |
| Whole pod, including supporting containers | 0.501 cores | 1.5 cores | 2 GiB | 4.5 GiB |
Green represents usage; yellow represents the summed application-container limits. The chart's resource scope excludes supporting containers, so it is not the whole-pod or cluster resource budget.
The CPU usage line is a five-minute rate expressed in cores. Memory usage is the containers' working set. As the number of matching application containers changes, their summed limits change too; this does not mean usage suddenly rose to the limit.
These application metrics are not interchangeable with SQL process CPU percentages or SQL process physical memory. Aggregate headroom also does not exclude per-container throttling or uneven load distribution.
Supplied latency dashboard
This supplied panel shows p50 3.60 s, p95 5.47 s, and p99 10.5 s for its selected scope. Its time filter is not visible, so these values are not substituted for the fixed-window comparison above.
Run and SQL trends beyond the repeat window
This view extends beyond the 20:54:59 IST measurement cutoff and includes continued processing. Values are counts in the dashboard's time buckets, not a cumulative total or a documented runs-per-second rate.
SQL duration and SQL CPU time here are in milliseconds. They are not workflow execution time or host CPU percentage. The dashboard aggregation covers a different scope from the verified 30-minute SQL measurements.
How to use these results
This is a baseline for one synthetic workflow, payload size, workload shape, and deployment. It is not a product-wide capacity limit, service-level guarantee, or comparison between deployment platforms.
Workflow outcomes describe runs started within the measurement window and their status at cutoff. They are time-window totals, not a file-by-file correlation audit; concurrent executions of the same workflow can contribute. SQL process resources and wait measurements can include other activity on the same instance; individual SQL requests are not equivalent to workflow runs.
For organizations that must keep integrations close to their data, whether for regulatory, data-residency or operational reasons, Hybrid Logic Apps brings the Logic Apps platform into their own datacenter. In this benchmark, the workflow ran fully disconnected on a single on-premises host, with SQL Server 2025 storing workflow state and no dependency on an external runtime service.
The business value is straightforward. Sensitive data stays on site, workflow state lives in a database your team already operates and protects, capacity scales automatically within the hardware you own, and when demand spikes, work queues instead of failing. Teams also build on the same Logic Apps skills they use in Azure, rather than maintaining a separate integration stack for on-premises workloads.
Recommendations
-
Do not manually alter, truncate, drop, or selectively delete records from runtime-managed SQL tables. Partial changes can leave missing content, orphaned metadata, inconsistent run history, or state that affects retries and recovery. Use the deployment’s supported retention and cleanup mechanisms; any exceptional database maintenance should follow with a recoverable backup.
-
Performance: Evaluate storage latency, CPU, memory, and blocking. Validate supported configuration changes through repeatable benchmarks rather than modifying internal tables or weakening transaction consistency. Please refer this for SQL server guidance Monitor and Tune for Performance - SQL Server | Microsoft Learn
-
Give SQL independent I/O capacity from SMB and cluster VM storage. Increase CPU or memory when measurements justify it—not simply because throughput is low.
-
Use supported availability groups or failover clustering for availability and recovery. These are not automatically a scale-out solution for writes. Follow Availability Group: Prerequisites, Restrictions, and Recommendations - SQL Server Always On | Microsoft Learn
-
We executed the test using single node K8se cluster, for better use distribute workflow pods across independent worker hosts with adequate storage and networking. Scale incrementally and remeasure successful throughput, write latency, blocking, backlog, and recovery behavior while preserving runtime-managed tables.

 Microsoft