Hi all,
Prabhakar here to discuss how I recently used XPerf to troubleshoot an issue with reduced performance due to Working Set trimming . As you may recall from our previous posts, the trimming of the system Working Set can have a pretty severe impact on performance. In this case the customer was running Windows Server 2008 and was having the classic performance issues due to Working Set trimming. The problem is, it is often difficult to troubleshoot these types of issues if we cannot pinpoint an application that is depleting memory and causing the trim to occur.
So, in this case, I decided to use XPerf to see if I could determine what was causing the trimming. To do this, we carried out the following steps:
1. Change the registry value to disable paging of the kernel:
HKEY_LOCAL_MACHINE\SYSTEM\CurrentControlSet\Control\Session Manager\Memory Management
DisablePagingExecutive (dword)
From 0 to 1
WARNING : You want to put it back to 0 once the data collection is done. If you don’t, it may affect performance.
Note : The registry key requires a reboot. You could wait until the next steps before you reboot.
2. Run the XPerf command using this syntax:
xperf.exe –on PROC_THREAD+LOADER+MEMINFO+CONTMEMGEN -stackwalk ContiguousMemoryGeneration –f kernel.etl -BufferSize 1024 -MaxBuffers 1024 -MaxFile 1024 -FileMode Circular
PROC_THREAD Process and thread create or delete
LOADER Kernel and user mode Image Load and Unload events
MEMINFO Memory List info
CONTMEMGEN Tracks contiguous memory generation
3. Once the issue has reproduced, we stopped the XPerf log by using this syntax:
Xperf.exe –d MMContiguousMemory.etl
4. Copy over and analyze the MMContiguousMemory.etl log file. Below is a screenshot of what the log looked like, showing the trimming occurring:

And this is the zoomed section on the left showing the Stack Count Summary by type. Memory ContiguousMemoryCreation is the ETW Trace Point that is being signaled every time a call to MmContiguousMemoryAlloction() is made which has been known to trigger trimming operation. We just need to figure out what is making those allocation requests.


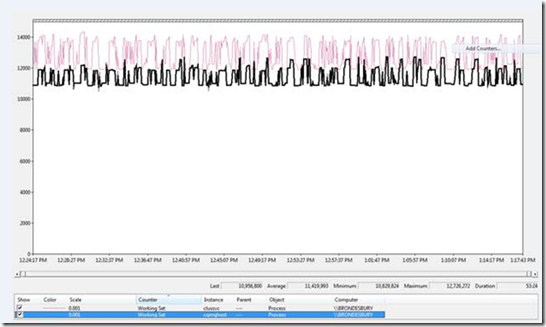
Simultaneous Perfmon logs which shows up working set trimming:
Summary Table:

From the summary above, we can see that Wmiprvse.exe is what was most active, followed by a third-party process. By following the path down the list, we find that Storport.sys is the common binary that is making the memory calls:


In both of the cases above, Storport.sys!StorAllocateContiguousResources is the call that appears to be the common thread. Knowing this, we checked the version of Storport.sys and found that it was not the latest. I sent the customer the latest hotfix package that included Storport.sys, and the issue was resolved. The point behind all of this really has nothing to do with any specific binary, but the ability to use XPerf to troubleshoot yet another type of issue.
More info on Working Set Trimming if you are interested:
2001745 Working Set Trimming can negatively impact SQL, Exchange, and Operating System performance under Windows 2003
http://support.microsoft.com/kb/2001745
Till next time…
Prabhakar Shettigar
<br/>
 Microsoft