Today’s post comes to us from Priyanka Rotti and Sudha N – two of our Support Engineers on the Performance team. Reviewing Performance Monitor Logs can be one of the most daunting tasks for an administrator, especially if it’s not something that you do on a regular basis. The Performance Analysis of Logs (PAL) tool can read Performance Monitor counter logs and analyzes them based on some pre-defined thresholds. PAL includes threshold definitions for most of the major Microsoft products such as IIS, SQL Server, BizTalk Server, Exchange Server and Active Directory. PAL isn’t intended to replace traditional performance analysis – but, it can help to cut down on some of the analysis time. So, let’s dig right in …
There are some prerequisites for installing PAL. The first is the Microsoft LogParser . PAL uses the Log Parser tool to query the performance monitor logs and to create charts and graphs for the PAL report. The second prerequisite is the Microsoft Office 2003 Web Components – which are required in order to create charts. Finally, if you do not already have the Microsoft .NET Framework v2.0 installed, you will need that to use the GUI portion of PAL (which is what we will be walking through today).
OK, let’s assume that you have PAL installed and that you have captured your Performance Monitor Log. Let’s launch PAL:

Select the “Counter Log” tab, and then select the log file to analyze under the Counter Log Path section. One especially useful feature is the ability to preselect a time range within the log files. Please note that the control does not pre-populate the date range within the log file. When you launch PAL, the current date / time on the system that you are launching PAL on is what is populated.

Let’s switch to the “Threshold File” tab.

Using the drop-down menu, there are a number of different threshold files to choose with which to analyze your data. From our (the Performance team) perspective, the “System Overview” file fits our needs best. In the bottom left hand corner you’ll see a section called Question Variable Names. In this section you can answer certain pre-defined questions such as the number of Processors, whether or not the /3GB switch is in use etc. This will help when PAL is generating the report – especially where percentage type calculations are used.
An extremely useful feature of PAL is that you can edit the threshold files to add and edit counters and thresholds beyond what is defined by default. To modify the template, click on the Edit button.

Click on the “New” button in the bottom left of the PAL Editor


At which point you can browse your system for the counters you want to add. You also have the option to connect to a remote system to select counters. Select your counter and click on the Add button …

And you can see that the \Memory\Cache Bytes counter has been added. Once you have the counter added, creating a threshold is the next step. Click on the Add button in the Thresholds section. There are different conditions that you can define – for example, is the condition Critical, or should it be listed as Informational (or Warning)..

OK, this is where things get a little tricky. You will need to do some minor VBScript editing to create your Threshold code. In our example above, we are asking PAL to generate a Warning when \Memory\Cache Bytes grows past 400MB. If you are not comfortable with VBScript coding, you can always use the existing Thresholds as a reference and then base your thresholds on those. Before getting back to the main window – don’t forget to save your file!
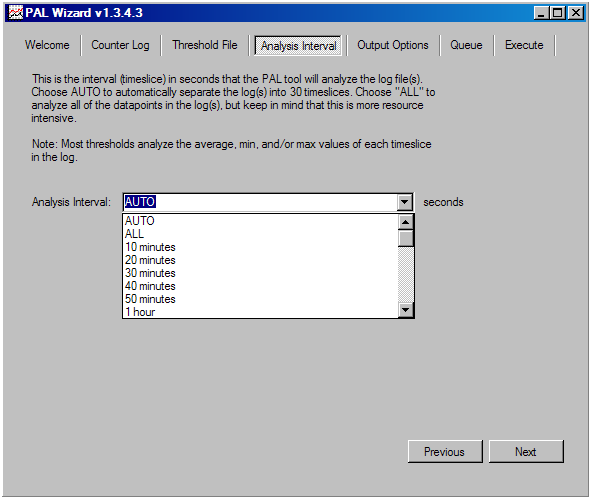
Now that we have our Thresholds defined, it’s time to configure our Analysis interval. In many cases, selecting the “Auto” or “All” option will suffice, but there may be occasions to define different intervals. One thing to remember is that the more data points you have the longer it takes to analyze the log … so be judicious in your choices!

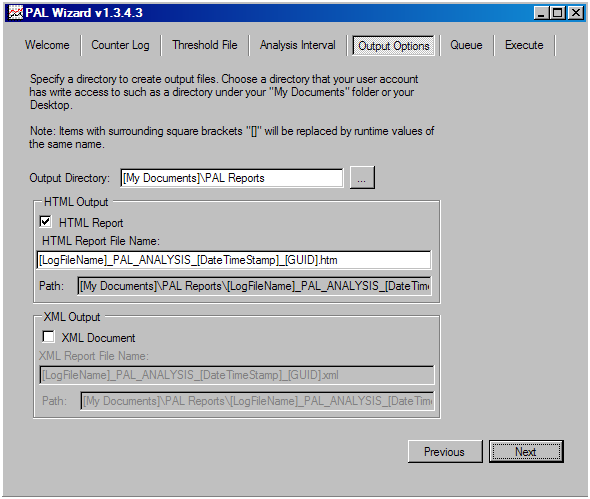
Once you have configured your Analysis Interval, select your output directory and report type (the default is HTML), and click Next

The final screen in this wizard shows you the different options for executing the job, and then it’s time to run our job. You’ll notice that you have the option to run the analysis as a low priority process. When dealing with large log files (or an amalgamation of log files), you may consider using this setting to allow you to work on other tasks while the analysis proceeds (it is somewhat resource intensive). Remember that the larger the log file, and the more data points you have, the longer the processing takes.

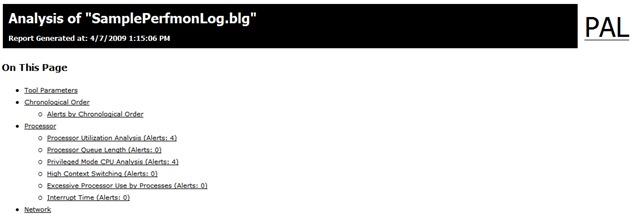
Once the analysis completes, an Internet Explorer window opens that displays the results of the analysis. The data in this next section is generated from the sample Performance Monitor log file that is provided with the PAL tool.

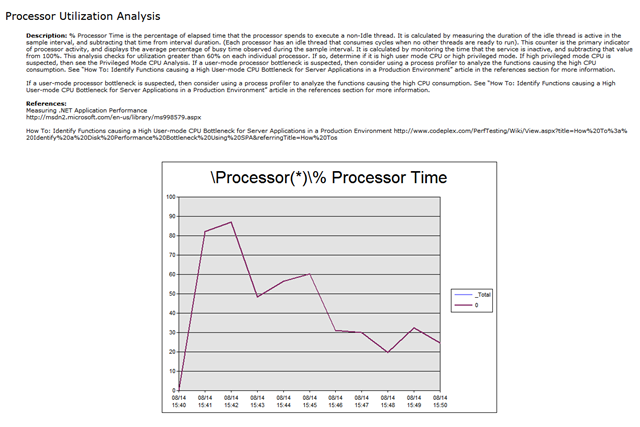
Navigation through the report is fairly straightforward via the table of contents at the top of the page. Each counter in the contents lists the number of alerts for that counter. For our demonstration, let’s take a look at the Processor Utilization Analysis (the first one on our list):

As you can see, not only is there a description of what we are measuring, but also a visual representation of the counter (scaled for viewing ease!). Just below that is the breakout of the values with some additional analysis (Std Deviation, Hourly Trend etc)

Each counter generates a similar report – making finding areas to investigate that much easier. Remember, though that this tool is not designed to eliminate the analysis, rather it facilitates it. Because we don’t have any contextual references or a baseline to compare our sample data to, there may not actually be anything to be concerned about with this system.
With that, it’s time to wrap up this Two Minute Drill. We hope you enjoyed our post!
Additional Resources:
- Priyanka Rotti & Sudha N
| Share this post : |
|
|
|

|

|

|

|

|
 Microsoft