Why more copies isn't always faster, where the real bottleneck hides at extreme scale, and what we're building to push past it.
Authors: Payal Mahesh and Vicky Lin
Azure Container Registry team: Jeanine Burke and Johnson Shi
Introduction
It's Monday morning. You spin up a fresh 1,000-node AKS cluster for a big training run or a fleet-wide rollout. Every node reaches for the same large container image at the same instant. What actually happens in the next ten minutes - and whether your pods reach Ready in 9 minutes or 14 - turns out to depend on a single number you've probably never thought about: how many copies of each image layer exist behind your registry.
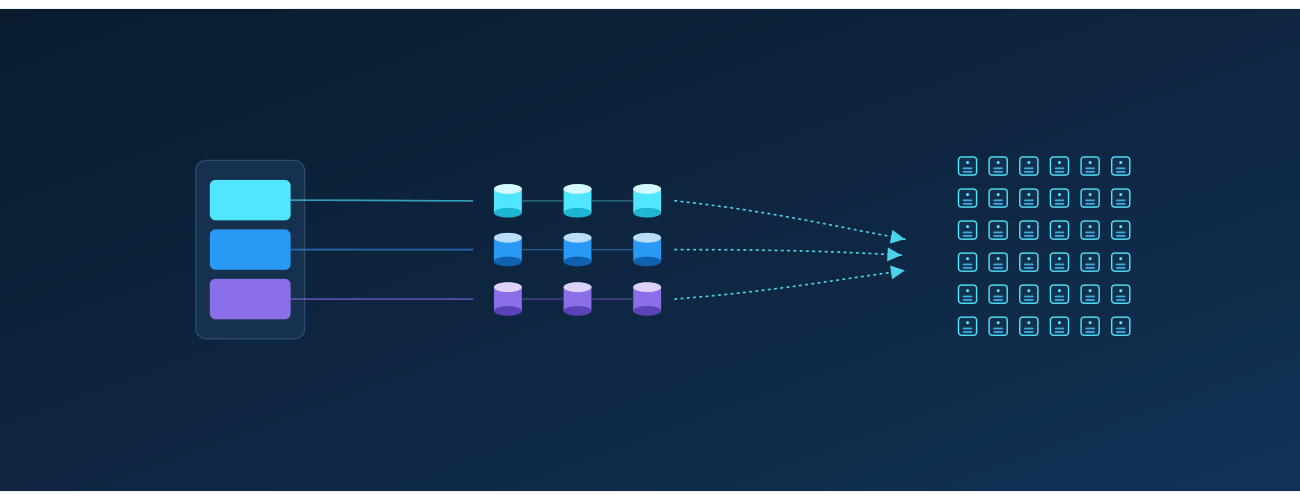
At the surface, you see a single capacity number for your registry size - but behind that abstraction, Azure Container Registry maintains copies of your layer data to optimize pull performance. That number of copies directly determines the read throughput available per layer. Each copy can serve requests independently, so distributing the layer across storage allows it to be read in parallel. More copies mean more independent readers - and higher aggregate throughput when thousands of nodes pull at once.
The intuitive answer is that more is better: add copies, get faster pulls. When we actually tested it at 1,000-node scale, the truth turned out to be more interesting:
- A few extra copies helped a little.
- A moderate number helped a lot, and eliminated storage throttling entirely.
- A large number helped no more than the moderate one.
- A huge number actually made pulls slower again.
Think of it like opening checkout lanes at a grocery store. Opening a few more lanes when the store is slammed cuts the line dramatically. Past a certain point, though, extra lanes barely help, because by then it's the customers, not the cashiers, who are the bottleneck. And open too many? Now the staff is spread thin and tripping over each other, and the line moves worse than it did at the sweet spot.
This post walks through what we measured, why the curve bends where it does, and what we're building next so finding that sweet spot isn't something anyone has to do by hand.
Key Takeaways
- There's a sweet spot, not a slope. Adding copies per layer cut pod-startup P99 by 27% and raised P50 per-node egress throughput by 244%, but only up to a point. Past that, the returns vanish, and far past it, latency actually regresses.
- Storage throttling is the real enemy. The win comes from spreading load across enough storage backends that no single backend gets pinned at its egress ceiling. Once throttling is gone, more copies stop helping.
- Storage scale alone has a ceiling. Even at the sweet spot, the per-backend egress limit caps total throughput. The next jump in performance has to come from somewhere else, which is exactly what we're building (see What's Next).
- This isn't something customers should need to manage. We're building a proactive, on-demand storage scaling capability that automatically grows the footprint before throttling happens and shrinks it back when the burst is over.
A quick bit of background
Within a region, the layer data behind your container images is backed by Azure storage. The number of copies ACR maintains per layer determines how many independent storage backends a concurrent-pull workload can spread its reads across. That's what matters, because each backend has a finite egress ceiling. Once concurrent reads against one backend get close to that ceiling, requests start getting throttled, and your pulls slow down in proportion.
The principle is simple: more copies per layer means more backends serving the same data, which means more total egress headroom and fewer throttled requests. What we wanted data on was how many, and where it stops helping.
How we tested
We ran a controlled series of large-scale pull tests against ACR Premium on a roughly 1,000-node cluster, with every node pulling the same large image cold at the same time (no local cache on any node). The only thing we changed between runs was the number of per-layer copies behind a single registry endpoint. Everything else, including rate limits, the image, node count, and concurrency, stayed constant.
For each run we measured pod-startup latency (P50/P90/P99), end-to-end storage read latency, egress throughput distributions (P50-P99.9), and storage throttling events. Pod-startup latency is our headline metric, because it's the one number that reflects the actual customer experience no matter where the bottleneck happens to be. Per-node egress throughput matters too, though. It tells you directly how much pull bandwidth ACR delivers to your fleet, and it's usually what customers have in mind when they ask how much faster extra copies will make their pulls. We report egress as a distribution rather than a single average, since per-request and per-time-window views can tell very different stories about the same set of pulls.
These are observations from a single controlled environment, not a service guarantee. Absolute numbers will move with image size, node count, layer composition, network topology, and concurrency.
What we found
We tested five configurations, sweeping from a low baseline number of per-layer copies up to a very high one. We name them by relative copy count rather than exact instance counts:
- Baseline: the lowest level, our reference point.
- Low: a modest step up from Baseline.
- Mid: a meaningful step up from Low.
- Higher: a further step up from Mid.
- Very high: the largest configuration we tested, well above Higher.
Here are the numbers. All percent changes are relative to Baseline.
| Configuration | Pod startup P50 | Pod startup P90 | Pod startup P99 | Storage throttling events | Peak per-backend egress |
|---|---|---|---|---|---|
| Baseline (fewest copies) | 9m 36s | 11m 0s | 14m 16s | Many; all top backends above the egress ceiling | Highest |
| Low | 9m 27s (−2%) | 10m 14s (−7%) | 12m 59s (−9%) | Some; one backend still above the ceiling | High |
| Mid | 9m 25s (−2%) | 9m 45s (−11%) | 10m 22s (−27%) | Zero | Below the ceiling |
| Higher | 9m 20s (−3%) | 9m 37s (−13%) | 10m 22s (−27%) | Zero | Well below the ceiling |
| Very high | 9m 28s (−1%) | 10m 31s (−4%) | 13m 48s (−3%) | Zero | Lowest |
Look at the P99 pod-startup column from top to bottom: 14m 16s, 12m 59s, 10m 22s, 10m 22s, 13m 48s. It improves, flattens out, then climbs back up. Three things explain that shape:
1. The win: Throttling falls off a cliff at the Mid configuration
As we added copies per layer, per-backend egress fell and storage-side throttling decreased. At the Mid configuration, throttling errors hit zero, and they stayed at zero for every configuration above it.
The upside isn't just that the errors went away, though. It's raw pull bandwidth. At the Mid sweet spot, the typical node saw its P50 egress throughput jump 244% over Baseline. With load spread across enough copies, each node pulled its layers off storage much faster, not just without stalling.
For a workload owner, that's the difference between watching pods come up in a steady stream and watching them stall for tens of seconds at a time while throttling clears. Same image, same node count, same registry, very different experience.
To put it in concrete terms: if your team runs a daily AI training kickoff that needs all 1,000 nodes pulling before the job can start, this is the difference between starting on time and starting four minutes late every day. Over a quarter of training runs, that adds up.
2. The surprise: more copies made pulls slower
This is the finding that genuinely surprised us. Going from Higher to Very high, the largest configuration we tested, cost us 3 minutes and 26 seconds at P99: 10m 22s climbing back up to 13m 48s. That gave back almost the entire benefit we'd built up over the previous four configurations. Tail storage-read latency at Very high actually came out worse than Baseline.
The Very high run is where the wheels came off, and the reason is the trade-off underneath. Once storage throttling is gone, more copies stop buying you anything, and the cost of fanning reads across that many backends starts to take over. The throughput distribution shows it clearly. P50 and P75 throughput had been climbing steadily and getting smoother through Mid and Higher, then dropped sharply at Very high while the peak P99/P99.9 spikes came back. Spread the same load across too many backends and it fragments into smaller, less consistent bursts.
The takeaway is that "more is better" stops being true past the sweet spot, and the failure mode is quiet. You won't see throttling errors. You'll just see your pulls get slower.
3. What we didn't expect: at few copies, the hottest backend is what hurts you
At the lowest copy counts, pull traffic wasn't spread evenly across the underlying storage footprint. Some backends absorbed far more traffic than others. As we added copies, that distribution evened out and the hottest backends cooled down.
The implication is sharp. You can saturate the busiest backend, and trigger throttling, even when the total headroom across all your backends is large in aggregate. What matters is the load on the hottest backend, not the average. That's exactly the failure mode that demand-driven, proactive scaling (described below) is meant to head off before it happens.
So how should you think about this?
You don't size copies yourself; ACR manages the storage footprint behind your registry. Still, it helps to understand what moves the sweet spot, because the shape of your own workload is what decides where it lands. The bigger your worst-case concurrent burst (more nodes, larger images, higher concurrency), the more copies per layer it takes to keep pulls off the throttling ceiling, and the further out the sweet spot sits. Smaller workloads may already be sitting on the flat part of the curve.
One thing is worth saying plainly. The storage footprint underneath is managed by ACR and shared across many registries, so there's no fixed, private storage budget that maps one-to-one to your workload. The sweet spot isn't a number you compute and provision; it's a behavior the platform has to land on for you, which is exactly why we're moving toward demand-driven scaling that handles it automatically.
That's what brings us to what we're building next.
What's next: proactive, on-demand storage scaling and a caching layer
The fixed-copy tests above answer the question "how many should the ACR system provision?" but they assume a single, static answer. Real workloads aren't static. A 1,000-node burst happens at deploy time, not at 3 a.m. on a Tuesday. And no matter how many copies are provisioned, the per-backend storage ceiling still bounds peak deliverable throughput. So we're investing along two complementary directions.
1. Proactive, demand-driven storage scaling
We're building a capability that adjusts the number of per-layer copies automatically based on real-time pull demand:
- Proactive, not reactive. The system scales the storage footprint before concurrent pull pressure pushes any single backend near the throttling threshold, so throttling is prevented before it forms rather than cleaned up after the fact.
- On-demand scale-out. The footprint expands automatically as sustained pull demand grows.
- Scale-in when demand subsides. The footprint contracts so you're not paying for steady-state capacity you only needed during a burst.
- Tiering for cold content. Long-tail, rarely-pulled content can sit on colder storage, so the redundant footprint of frequently-pulled content doesn't pay full hot-storage cost everywhere.
The benefit to customers is straightforward: smoother pulls under burst, higher delivered throughput on average, no permanent over-provisioning, and no manual re-tuning as workloads grow.
2. A caching layer to absorb burst beyond the storage ceiling
Even a perfectly scaled storage footprint runs into the per-backend egress ceiling at extreme scale. To push past it, we're investing in a caching layer in the registry service that absorbs burst traffic before it ever reaches storage. A pull surge that hits the same set of layers, which is the common case for fleet-wide deployments, can be served largely from cache. That takes a lot of load off any single storage backend and complements the storage scaling above.
We'll share results from this work in follow-up posts.
If you have questions about scaling ACR for your workload, or about how we measure storage performance, reach out on the Azure Container Registry GitHub repository.
Note: All results in this post are based on controlled internal testing configurations and are intended to illustrate general scaling behavior rather than prescribe exact configurations.

 Microsoft