Forum Discussion
gresdawg
Feb 18, 2019Brass Contributor
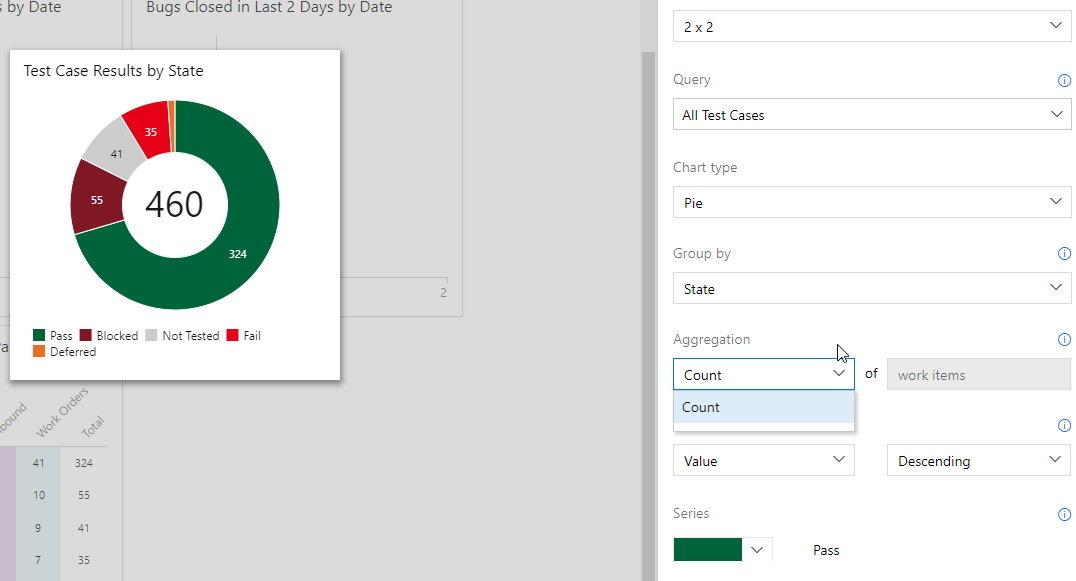
Query based pie charts in Azure DevOps - how do I display a percentage rather than a count?
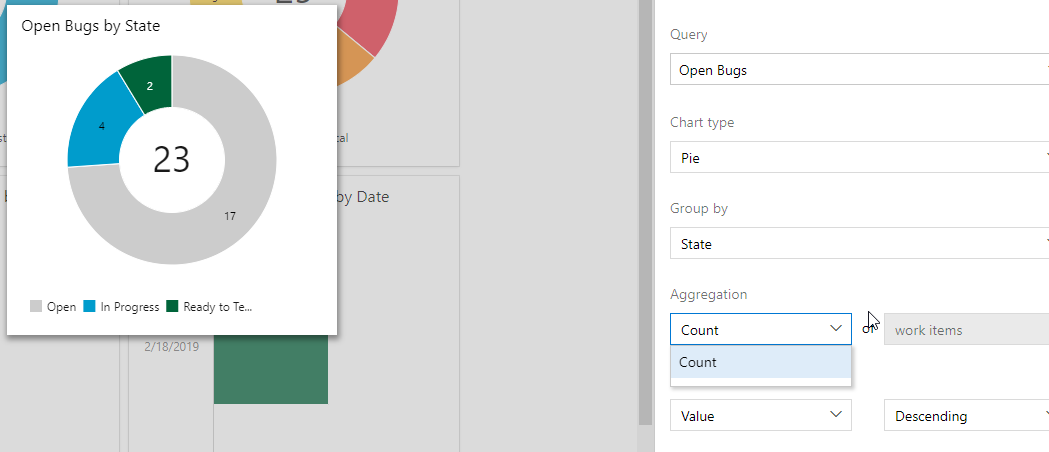
Hi, I created several charts to track the progress of bugs and test cases. I will use the following two as examples: 1. Open Bugs by State: please reference attached - this chart shows the co...
Jean-luc7636
May 03, 2023Copper Contributor
I keep getting an error that the Query cannot be in Hierarchical.
When changing the state to Flat - I simply get a Widget failed to load.
What would be the Query to show Story Case by States?