Analyze and compare thousands of traces, isolate the transactions that matter, and move from trends to root cause with Trace Analytics
Analyze distributed traces at scale
We are excited to announce the public preview of Azure Monitor traces. You can now analyze application transactions at-scale using end-to-end traces and their derived metrics to identify patterns in usage, performance, and failures.
Trace-based metrics automatically generates metrics from transaction traces that can power service-level indicators, dashboards, alerts and long-term trend analysis.
Trace Analytics brings distributed operations from multiple services together and lets you define matching criteria to isolate the business-relevant or service-specific transactions that matter most to you. From that result set, you can compare behavior across traces, understand which services and dependencies shape end-to-end latency or result in failures, and drill into individual transactions when deeper diagnosis is required.
Move from broad signals to the traces that explain it
Distributed systems and AI-powered applications can generate millions of spans across many services, dependencies, and customer journeys. The challenge is rarely finding a single slow or failed trace. It is understanding whether the issue represents a pattern, which business transactions are affected, and which components and dependencies are contributing most to the outcomes at-scale.
Figure 1: Trace-derived metrics in Application Insights Traces blade
With the new trace experiences, you can use trace-based metrics and Trace analytics to analyze high-volume telemetry and focus on the transactions most relevant to customer journeys, agent interactions or specific services and performance thresholds. These workflows support both wide trend analysis and pattern recognition plus detailed investigations of individual end-to-end transactions.
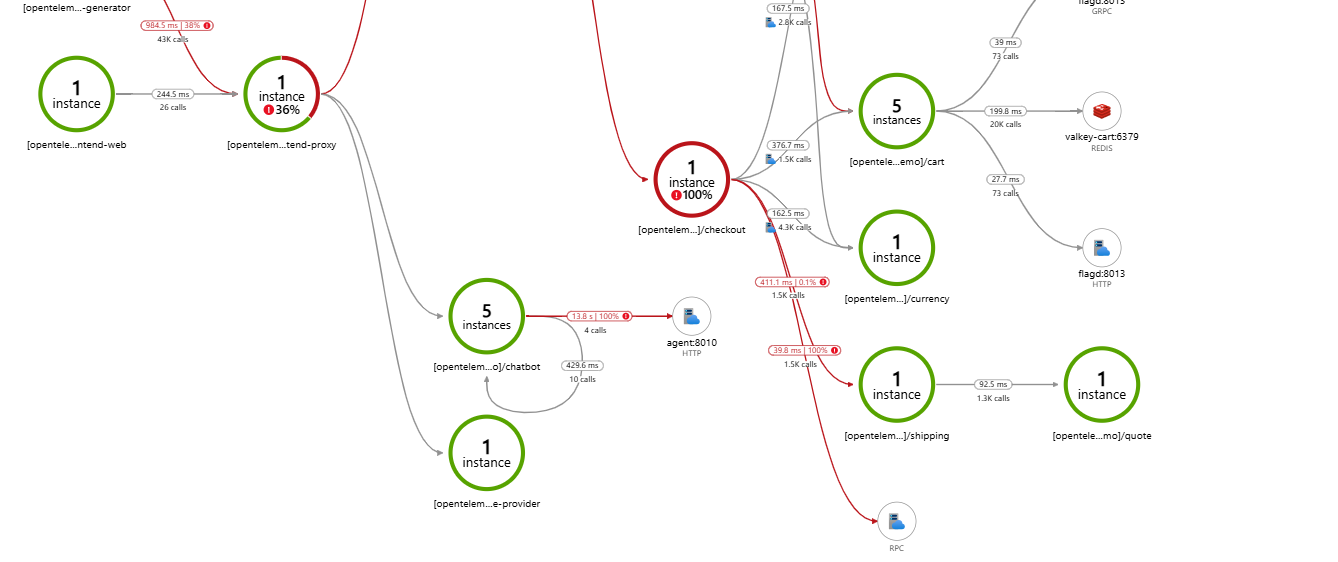
Figure 2: Critical Path Analysis in Application Insights Traces
• Trend application behavior and SLIs over time with trace-based metrics
• Find and analyze business transactions that are not meeting SLOs
• Use critical path analysis to identify services and dependencies driving end-to-end transaction time
• Perform agent-based troubleshooting using Azure Monitor traces MCP
• Compare span attributes across healthy and unhealthy traces
• Find failing components responsible for broken customer journeys
• Drill down to individual trace details
Unified tracing
Available to every Application Insights user. Benefit from the new tracing experience regardless of your current instrumentation or application architecture by linking your Application Insights resources to a centralized trace store in an Azure Monitor workspace.
OpenTelemetry-compatible by design. Azure Monitor preserves OpenTelemetry attributes, naming conventions, and schema when traces are ingested, enabling search and analysis using native OpenTelemetry semantics across cloud-native and open-source observability stacks.
Get started
Existing Application Insights users can opt-in to the new tracing features with a few selections in the Azure portal. Organizations managing multiple Application Insights resources can enable the experience programmatically by using the provided Azure Resource Manager template.
Try the public preview and share your feedback with the Azure Monitor team as we continue to expand the distributed tracing experience. Reach us at TraceAnalyticsFeedback@microsoft.com

 Microsoft