Fabric Apps now has built-in-observability and coding-agent telemetry exploration [Public Preview]
Introducing Observability in your coding agent for Fabric Apps
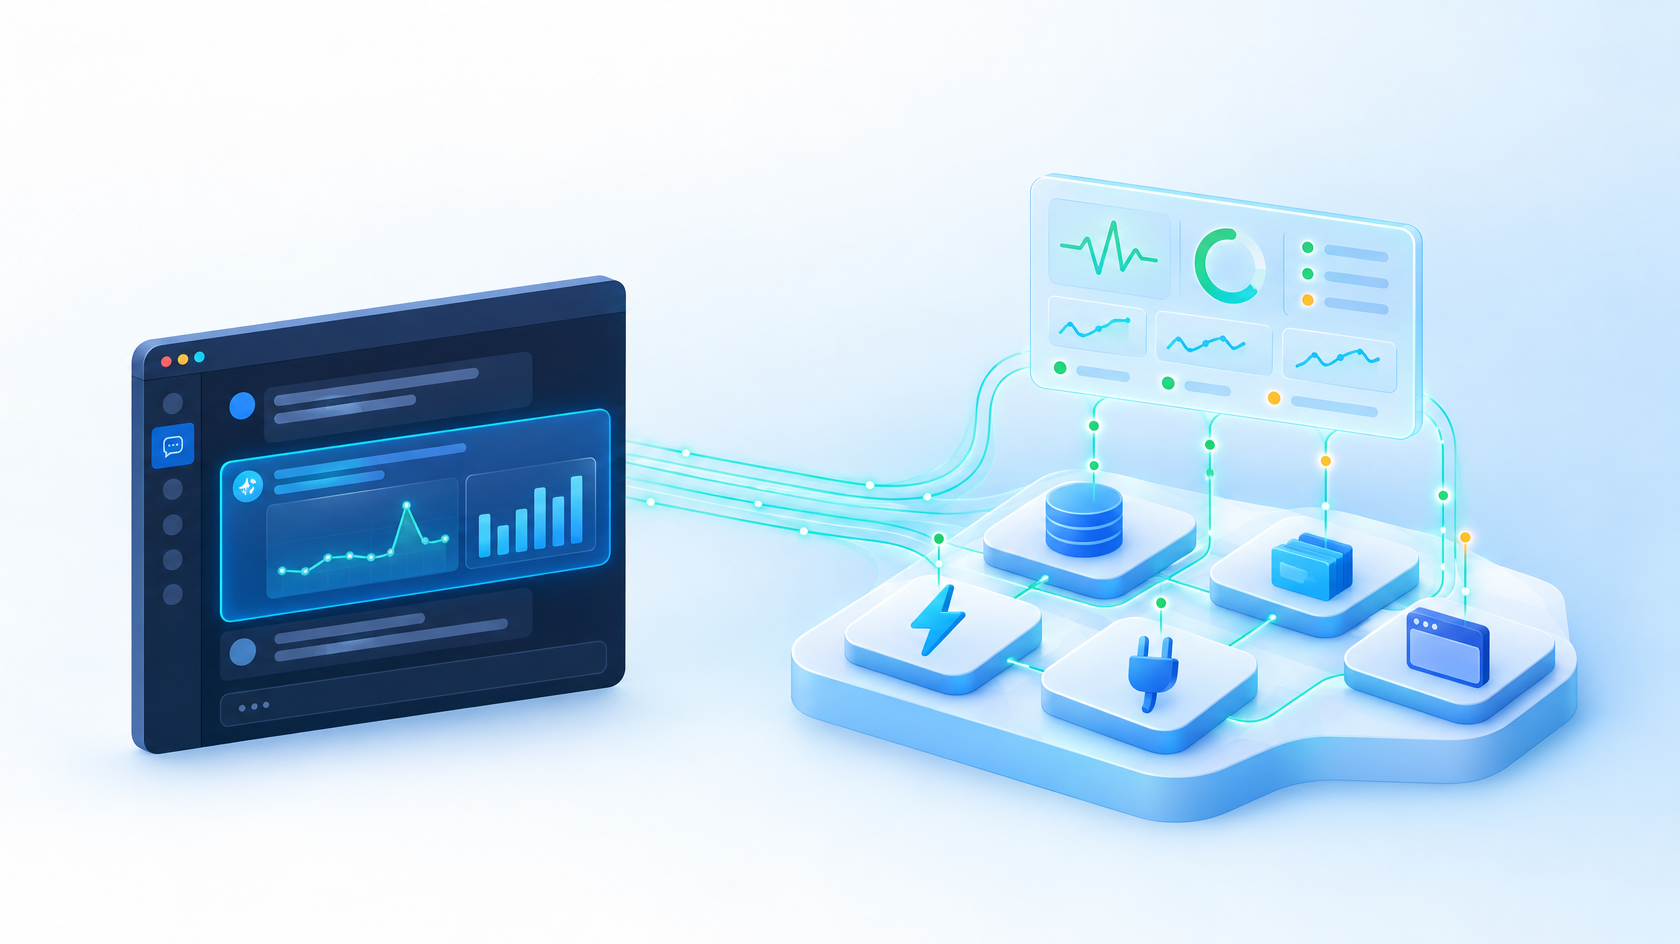
Today at Microsoft Ignite, we're introducing observability for Fabric Apps. Every app includes built-in platform health metrics from the moment it's deployed, with no setup required. In public preview, you can also turn on application telemetry for your app's frontend and Functions with a single request to your coding agent, then explore usage and errors by simply asking it questions. There is no manual SDK wiring, no connection strings to manage, and no telemetry pipeline to build. Developers can explore their application's behavior where they already work, without switching to a separate monitoring tool for every question.
Microsoft Fabric brings data and analytics together. Fabric Apps puts that data to work through applications. This preview brings visibility into those applications directly into the developer's workflow.
Why this matters
Modern apps are multi-layered. A slow page could be a frontend issue, a failing Function, a throttled storage call, or a database query gone wrong. Builders typically spend hours stitching together signals from different tools before they can even start fixing the problem. With Fabric Apps, we want builders to spend that time shipping, not instrumenting – and to get answers in the tools they already use.
What’s new at Ignite
- Built-in health metrics, on by default
Every Fabric app comes with platform health metrics collected by Fabric, with no setup and no code changes:
- App: sign-ins and app loads
- Database: query count, query errors, query error rate, and average query duration
- Storage: request count and request error rate
- Functions: invocations, failed invocations, error rate, and average duration
- Connectors: request count, failed requests, error rate, and average duration
Application telemetry with one request (public preview) Ask your coding agent to enable telemetry. It instruments your frontend with the Microsoft OpenTelemetry Browser Distro and connects your frontend and Functions to a dedicated Application Insights resource for your app.
The benefit is a shorter path from observing a symptom to understanding where to look next, with application behavior and development context in the same environment.
- End-to-end coverage across every layer.
What application telemetry captures
- Frontend (browser): visits, page views, views per visit, page load duration (P95), sessions with JavaScript errors, and request failure rate.
- Functions: logs and traces from your Functions, including console output.
- Explore application telemetry through your coding agent [Public Preview]
When a user reports a problem, developers need evidence, not just a description of the symptom. With this preview, you can ask your coding agent questions such as:
- “How is my application being used?”
- “What errors has my application reported in the last hour?”
- “How many visits and page views did my app have this week?”
Your coding agent, such as GitHub Copilot in Visual Studio Code, queries your app's telemetry in Application Insights and brings the results into the conversation. You can explore the evidence alongside your code and ask follow-up questions to narrow it down.
- At-a-glance health in Fabric Apps item.
The Fabric Apps item shows key usage, performance, and failure trends for app, database, storage, Functions, and connectors, so you can quickly spot when something needs attention.
To view them, open Metrics in your app's management view or in the Monitoring Hub, where built-in trends for sign-ins, app loads, database queries, storage, Functions, and connectors are available.
How it works
- Build and deploy your app. Built-in platform health metrics start collecting automatically
- Turn on Telemetry: Ask your coding agent to enable telemetry. It instruments your frontend and Functions and connects them to your app's Application Insights resource.
- Ask your agent. Explore usage, check for errors, and narrow down where to look – then make the fix right where you work
Because application telemetry is built on OpenTelemetry, your telemetry follows open standards rather than a proprietary format.
What’s coming next
We’re just getting started. Coming soon after Ignite:
- Richer client-side usage charts directly in the Fabric Apps item.
- Platform metrics, logs, and traces available alongside your app telemetry in Application Insights.
- Extended portal experiences for your Application health views in the Fabric Monitoring hub.
- Proactive alerting and AI-assisted investigation, so issues find you – and come with a head start on root cause. We're targeting FabCon US in March 2027.
Get started
Fabric Apps observability is available in public preview today. To get started, create or redeploy an app. See documentation links below for supported scenarios and setup details
Monitor your Fabric app with App Metrics (preview) - Microsoft Fabric | Microsoft Learn
Monitor Applications in Monitor Hub (Preview) - Microsoft Fabric | Microsoft Learn

 Microsoft