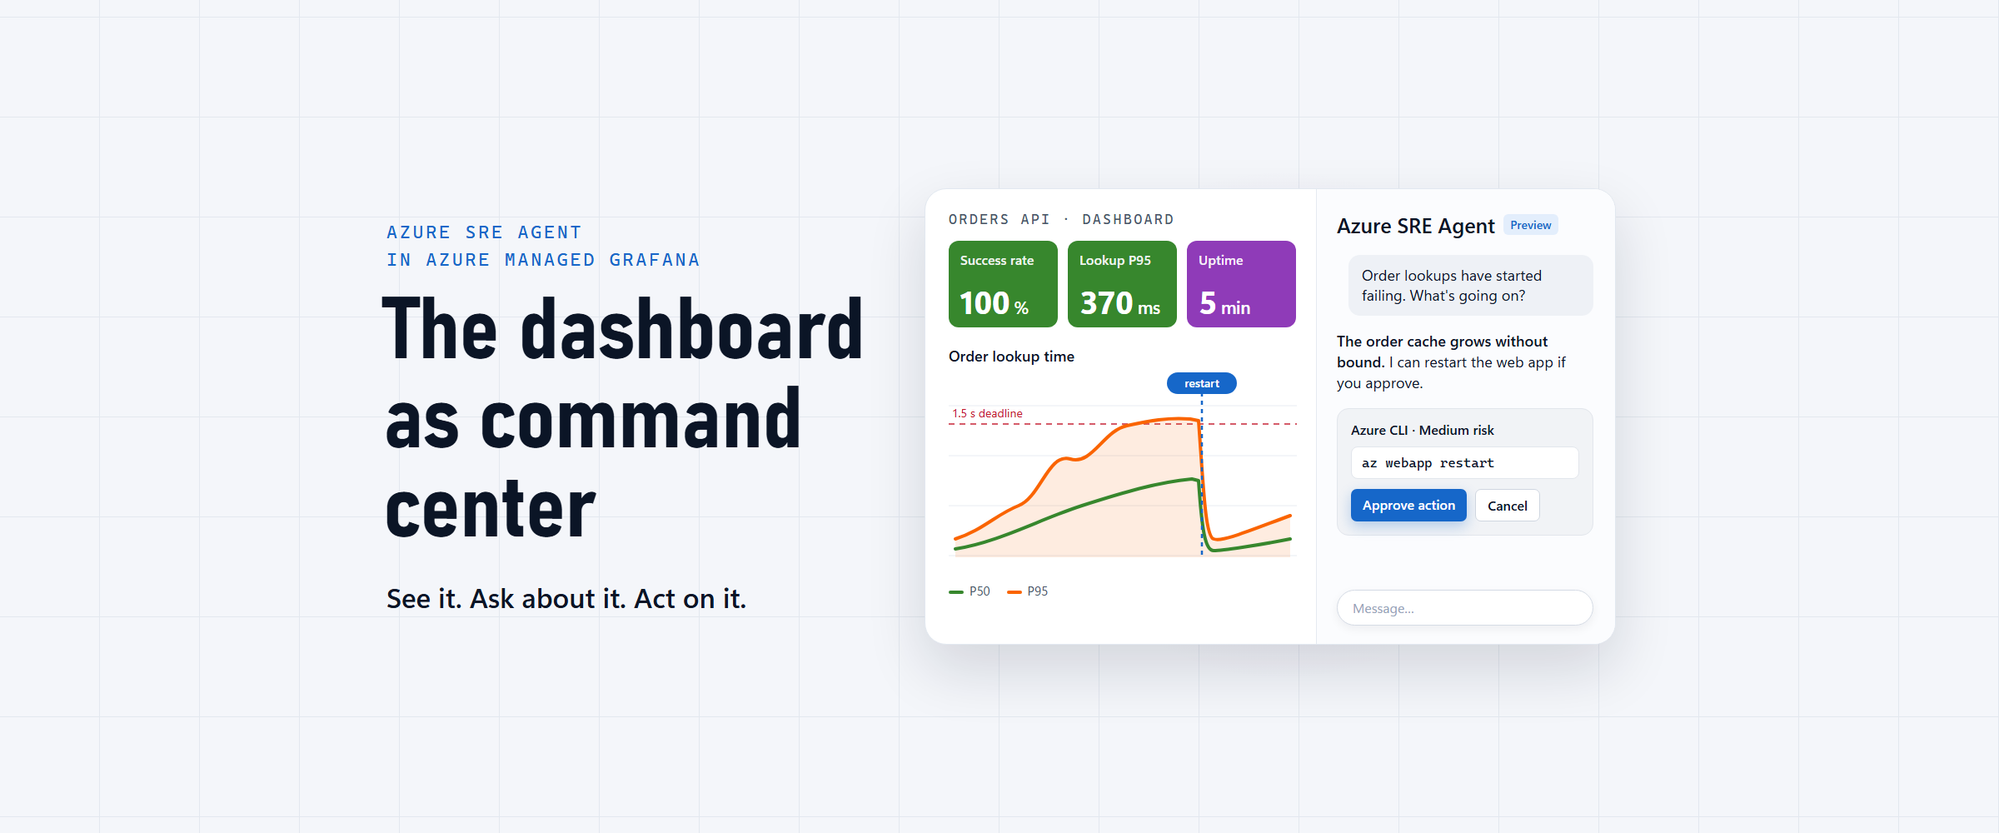
Open Azure SRE Agent beside the dashboard you're looking at, ask it to investigate, and approve what it does next, without leaving Azure Managed Grafana.
We're introducing the Azure SRE Agent integration in Azure Managed Grafana, now in preview. Pair an Azure SRE Agent with your Grafana workspace, and an agent icon appears in the toolbar of your dashboards. Select it, and the agent opens in a pane beside the dashboard you're looking at. It reads that dashboard and queries the same data sources, so you can ask it to investigate without writing the queries yourself. If you've given it the permissions, it can also act on what it finds, and it asks for your approval first.
One screen, four prompts
To try it, I built a small web app with a bug I planted: an Orders API on Azure App Service whose in-memory order cache is never evicted. I gave it a Grafana dashboard and a steady trickle of traffic, then waited. About 15 minutes later the dashboard turned red. I opened the agent pane and typed the least careful question I could:
Order lookups have started failing. What's going on?
I didn't name the app, the resource group, a table or a metric. About 30 seconds later:
The answer starts with the conclusion: "Order lookups are failing because the order cache grows without bound. Lookups scan a larger cache each time, and past a point they time out and return 503." Then it lists the evidence, and where each piece came from:
| Source | What the agent found |
|---|---|
| Prometheus (the app's own metrics) | orders_cache_entries rose from 147 to 1,587, and process uptime climbed steadily, so no restart had cleared it |
| Application Insights | P95 lookup time went from 288 ms to 805 ms to about 1.2 s; HTTP 503 responses first appeared in the 05:10 UTC bin |
| Console log in Log Analytics | 14 OrderCacheLookupTimeout errors between 05:12 and 05:20, with a sample line: scanned 656 of 658 cached orders in 1500 ms |
It also said what it hadn't done: "I did not read the code, so this is inferred from the telemetry." It named a mitigation (restart the app, which empties the cache), named the fix (bound the cache and replace the scan with a keyed lookup), and ended with: "I have not made any changes. I can restart the orders-api-2611 web app if you approve."
So I typed the second prompt:
Yes, restart it, then confirm from the dashboard's data that it recovered.
The agent didn't run anything yet. It showed me the exact command and waited:
I selected Approve action. What happened next is the part I like most. The restart command returned success, and the agent still didn't call the incident over. It went back to the data and reported: "I can't confirm recovery. The restart command returned success, but the dashboard data shows the app has not recovered." The uptime gauge was still climbing and the cache was still growing. It was right. App Service brought the new process up about two minutes after the restart call, and the agent had checked before that.
Third prompt: "Don't restart again. Give it a moment and check the data once more." This time uptime had fallen from 1,391 seconds to 17, the cache had dropped from 1,764 entries to 19, P95 lookup time was back to between 207 and 462 ms, and there were no 503s in the last three minutes. The agent added a warning I hadn't asked for: "This restart only buys time." At the rate the cache refills, the failures would return in 10 to 15 minutes.
For the fourth prompt I gave it the exact times of the restart and asked for a short incident note for the ticket. It wrote a timeline, the cause, the mitigation, three follow-ups and a list of gaps in its own analysis, while the success rate beside it was back at 100%:
From the first question to the incident note took about 11 minutes. I wrote four sentences, no query, and I never left the dashboard.
Same dashboard, two readers
A dashboard is a team's understanding of a system, written down in a form that runs. Each panel is a query someone wrote because the answer mattered, pointed at the right resource and titled with the question it answers. I argued in an earlier post that this makes a dashboard a map for an AI agent as much as for a person. This integration puts both readers in front of the same map at the same time.
Here is how the agent gets there. Each conversation in the pane starts with a short block of host context that Grafana adds for you:
The user is using the SRE Agent embedded chat in Grafana.Current Grafana URL: https://<grafana-endpoint>/d/orders-api/orders-api?from=now-30m&to=now…
The URL carries the dashboard, the time range and the variable values, so "this dashboard" and "the last 30 minutes" mean the same thing to the agent as they do to you. From there the agent works through the workspace's MCP endpoint, the same MCP tools other clients use. The pane shows each call as it happens. For my first prompt there were six:
| Calls | Tool | What it did |
|---|---|---|
| 1 | amgmcp_dashboard_inspect | Read the dashboard: its panels, their queries, data sources and descriptions |
| 3 | amgmcp_prometheus_query | Queried the app's own metrics: cache entries, uptime, request rate by status |
| 2 | amgmcp_query_resource_log | Ran KQL for the Application Insights and console-log evidence |
Between the first and second call, the agent also read a note from its own memory. It's the same agent you use in the SRE Agent portal, with the same connectors, knowledge and memory. The pane is another door into it.
The dashboard itself is worth a look, because it is what made the investigation short. It has 16 panels over four sources, one row each:
- What callers see comes from Application Insights: lookups by result code, and lookup time at P50, P95 and P99.
- What the platform sees comes from Azure Monitor platform metrics: the web app's memory working set, the App Service plan's CPU and memory, and HTTP 5xx at the front end.
- What the app says about itself comes from Prometheus, scraped from the app's
/metricsendpoint into an Azure Monitor workspace: cached orders, cache size, lookup duration and uptime. - What the logs say comes from Log Analytics: the console log and its errors grouped by kind.
In this incident, no single source told the story. The platform metrics show memory climbing but not why. Application Insights shows callers failing but not what is filling up. The cache gauge in Prometheus is the cause, and the console log confirms it. Putting those four on one page is what Grafana is for. The agent inherits that work: one amgmcp_dashboard_inspect call tells it which sources exist, which queries matter and what each panel means.
From reading to acting
Reading and acting use different identities, and that is deliberate.
Reading goes through Grafana. The agent's queries run through the workspace's data sources, with whatever identity each data source is configured with. If a data source can't see something, the agent can't see it through Grafana either.
Acting uses the agent's own permissions. The restart ran as the agent's managed identity. The approval card says so: "Agent permissions will be used to complete this action." The Azure activity log agrees: the Microsoft.Web/sites/restart/action operation at 05:25:39 UTC lists that identity as the caller.
For this demo I gave that identity two roles, Reader and Website Contributor, scoped to the demo's resource group and nothing else. I also turned on the agent's Azure CLI tools in the SRE Agent portal and left the write tool's permission on Ask, which is why the restart waited for me. Before I did either, I asked the agent whether it could restart a web app. It checked its own role assignments and answered that it couldn't, and that the command would fail with a 403.
That is the shape I want from an agent that can touch production. It works with the permissions I've granted. It shows the command before it runs. It checks the result against the data, and it doesn't treat "the command succeeded" as "the problem is fixed".
The command center
Think about the big screen in an operations room. It shows the state of the system to everyone at once, and showing is all it does. The investigating and the acting happen at people's desks: in query editors, in the portal, in a terminal. Each step away from the screen costs context, and the person on call pays that cost at the worst possible time.
With the agent in the pane, the screen is where the work happens. You see the problem, ask about it, get the drill-down without writing the queries, approve an action, and watch the panels recover, all on one page. The dashboard gives the agent its context, and the agent makes the dashboard something you can act from.
Set it up
You need an Azure Managed Grafana workspace in the Standard tier and an Azure SRE Agent. Then there are three steps, and you do all three yourself: enabling the integration doesn't create connectors or role assignments for you.
- Connect the agent to Grafana. In the SRE Agent portal, add the Azure Managed Grafana connector for your workspace. Choose Viewer for read-only access or Editor if the agent should also create and update dashboards. An MCP connector that points at
https://<grafana-endpoint>/api/azure-mcpworks too. - Enable the integration. In the Azure portal, open your Grafana workspace, go to Integrations > Azure SRE Agent (Preview), select the agent and select Save. The portal checks for the connector and shows "SRE Agent has connected to Grafana" when it finds it.
- Give people access. Each person who uses the pane needs the SRE Agent Standard User role on the agent and a Grafana role on the workspace. Assign the role to a Microsoft Entra group if you can.
Then open any dashboard and select the Azure SRE Agent icon in the toolbar. The full steps, including the Azure CLI command for the role assignment and how to turn the integration off, are in Integrate Azure SRE Agent (preview) with Azure Managed Grafana.
What to know
- It's in preview. Expect changes, and check the agent's work. The pane says so itself: AI-generated content might be incorrect.
- Investigation works with the Grafana connector alone. Action needs more. To let the agent change anything in Azure, grant its identity a role on the target, as narrowly as you can, and decide which tools may run without asking.
- A restart is a mitigation. In my demo the cache started refilling the moment the app came back. The agent said so twice, and it was right.
- The pane keeps your conversation while the browser tab stays open. To go back to an earlier one, use My chats in the pane.
Try it
Open one of your own dashboards and start with a prompt the pane suggests:
Summarize this dashboard and highlight anything unusual
Which panels show spikes or anomalies in the current time range?
Then ask about something you'd normally write a query for.
Everything behind this post is in the sample folder: the Orders API with its unbounded cache, the load generator, the Prometheus scraper, the dashboard and a script that creates all of it in one resource group.
If you have feedback or questions, tell us at https://aka.ms/managed-grafana/issues.

 Microsoft