Over the last six months, we have been listening to you and building new capabilities to help you observe your agents. You’ve been sharing with us that quality issues are tricky and evaluation is critical, that agent reasoning needs to be understood, that humans must be in the loop to review select agent interactions, and that security and privacy are essential.
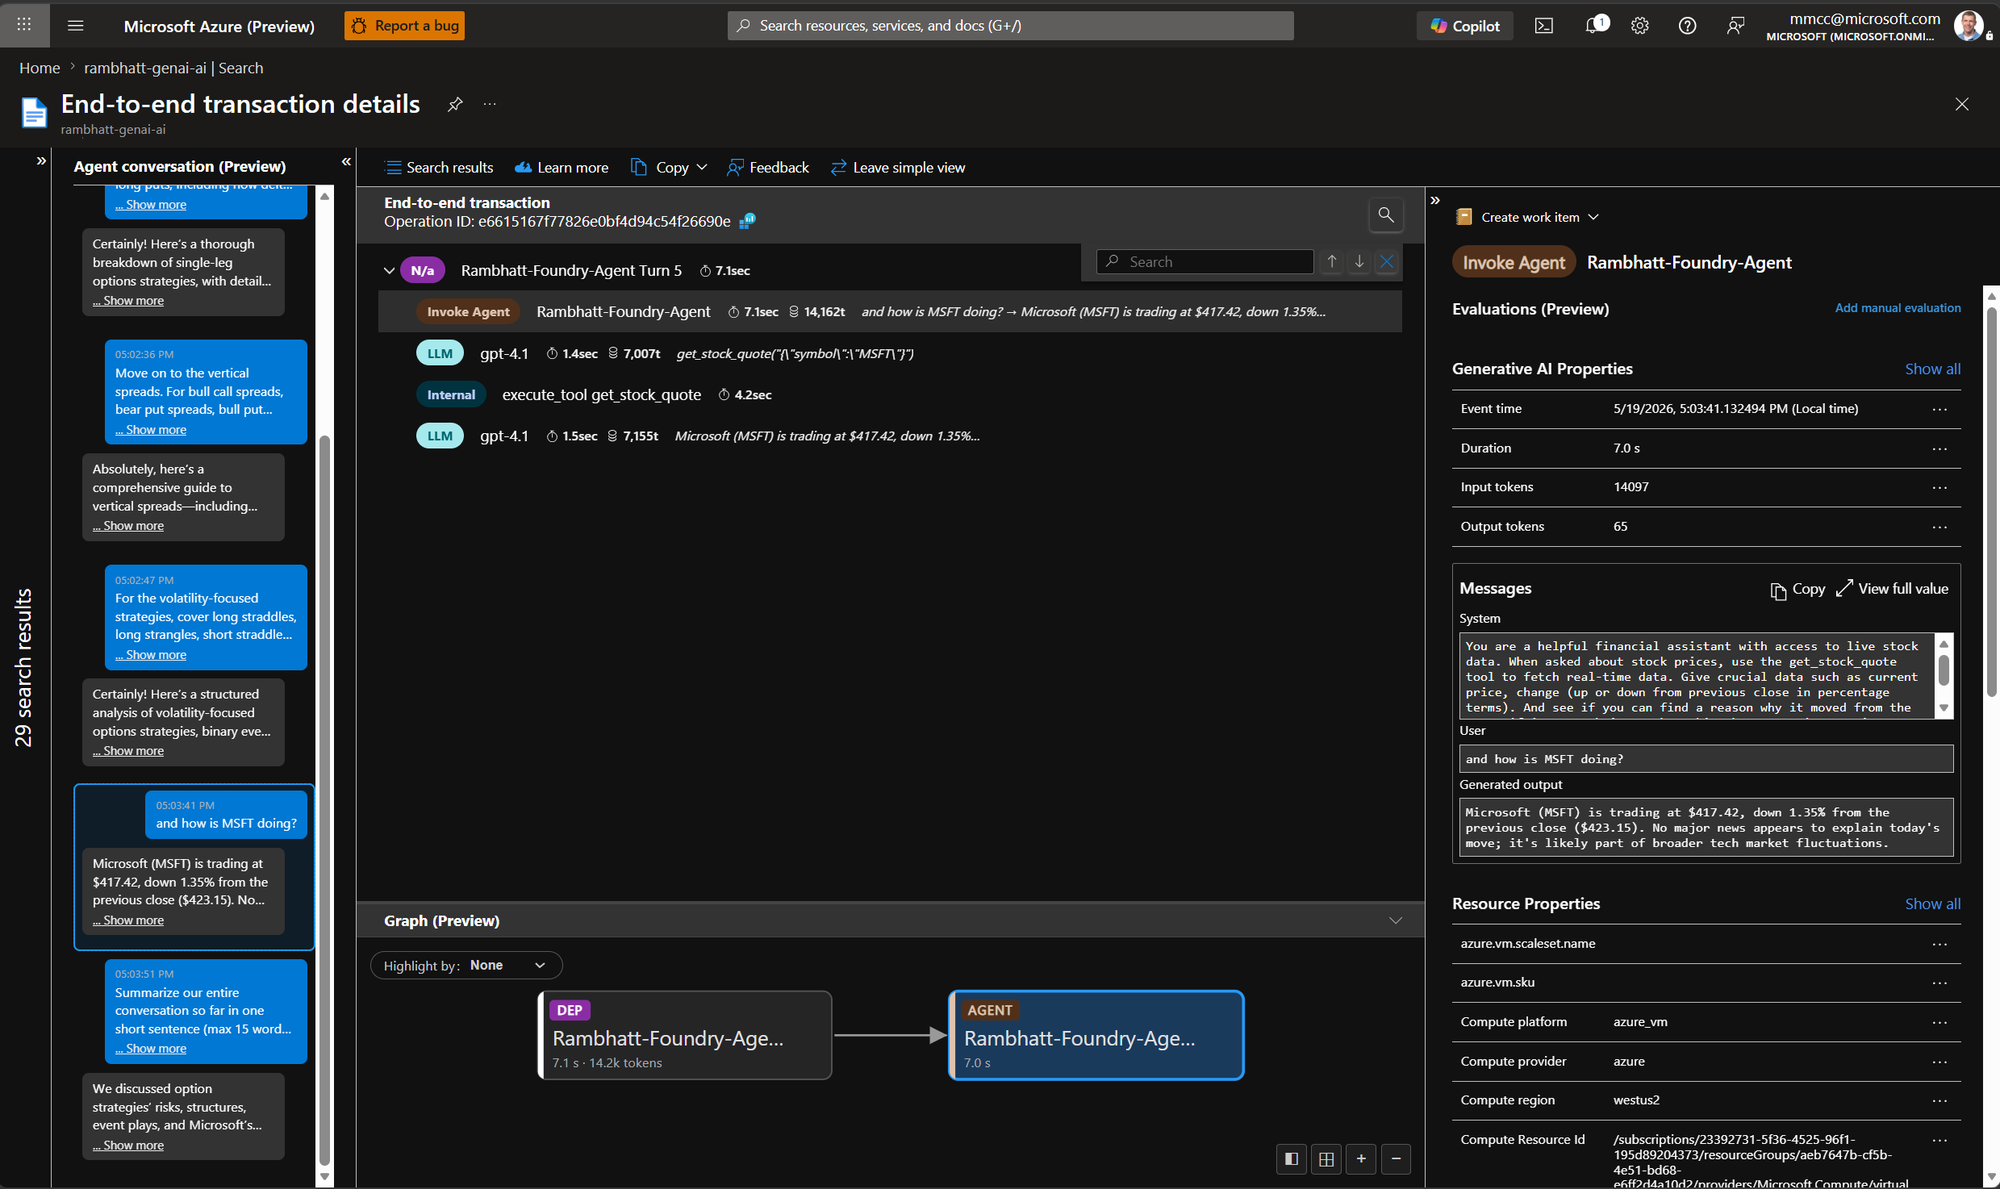
To address these concerns, we’re announcing several new capabilities that make agents a first-class artifact in Azure Monitor, so you can debug them in the context of your broader distributed application alongside non-agentic components. Microsoft Foundry remains the surface for building and evaluating agents within the context of your project, while Azure Monitor provides the full-stack observability platform and underlying data foundation that powers those experiences.
Today, we’re announcing new capabilities in Azure Monitor across ingestion, performance, evaluation workflows, agent debugging, and instrumentation updates to help teams get telemetry faster, inspect agent behavior more deeply, and standardize observability across hosting environments and frameworks.
What’s new
- Reducing pipeline latency from more than 60 seconds to 7.5 seconds at P90. This makes telemetry available faster for teams troubleshooting agents at scale.
- Emitting events up to 1MB and up to 256kB per attribute. Prompts and responses can get large, and this helps avoid data truncation.
- Introducing a new view that shows a list of all agents being monitored. Whether you use Microsoft Agent Framework, LangChain, Microsoft Copilot Studio, Foundry Hosting, AKS Hosting, or something else, they all show up here.
- Improving drill-in from Evaluations to underlying prompts/responses. Evaluations in Azure Monitor are powered by Foundry, and we continue to improve visuals.
- Showing conversation context in end-to-end transaction view. In chat agents, conversations have become critical glue that connects traces and eases debugging.
- Searching by text and showing prompt previews in end-to-end transaction view. Prompts and responses are essential to understanding agent logic, and now you can search based on keyword text in Search and End-to-end transaction details views.
- Show evaluation scores in end-to-end transaction details and sort by evaluation score in Search. Evaluation is emerging as a “4th pillar” of telemetry, and you’ll see it surface more prominently across Azure Monitor Application Insights.
- Access the entire JSON blob of prompt/response text. This makes it easier to get to your underlying data and copy out of Azure Monitor for custom analysis/evaluation.
- Adding a “trace tree” to enhance traversing the agent’s reasoning logic. This new addition to end-to-end transaction view makes traversing long-traces much easier.
- Enabling builders to annotate (i.e., manual evaluations) from transaction details. Get rid of spreadsheets on the side and annotate from within Azure Monitor.
- Enabling capture of end-user feedback (i.e., thumbs up/down). Brings end-user feedback alongside other telemetry for more powerful troubleshooting.
- Extending AI-powered troubleshooting to agents. Observability agent offers full-stack, AI-powered troubleshooting and surfaces up findings in an issue. Learn More.
- Observability of Coding Agents. Get end-to-end visibility into agent and model usage, performance, and cost with Azure Monitor Application Insights, and built-in Grafana dashboards. Learn More.
- A unified “Microsoft OpenTelemetry Distro” to observe agents hosted anywhere. A unified Microsoft OpenTelemetry Distro for observing agents hosted anywhere gives teams a single starting point across Foundry, Azure Monitor, and A365, reducing fragmentation and simplifying onboarding (GH Repos: Python, .NET, JavaScript).
- Skills-based enablement. Getting started is easier. Just point your agent to a skill for AI-assisted instrumentation. We also plan to upgrade tools for instrumentation in Azure MCP.
What’s next
We’re continuing to invest in this area, with upcoming work focused on stronger security controls for prompts and responses, better cost transparency for agents, and clearer ways to measure ROI across your agent fleet.
These updates make it possible to observe agents without adopting a separate toolchain. Explore the new capabilities, and if you see gaps, let us know so we can continue shaping the roadmap based on your feedback. Learn More.

 Microsoft