troubleshooting tips
6 TopicsLessons Learned #549: Reproduce, Challenge, and Validate – Testing Technical Assumptions
During an Azure SQL investigation, the available evidence may point to a technically reasonable explanation. For example: A network change may appear to explain a connectivity issue. High CPU may appear to explain a performance degradation. A query plan change may appear to explain a longer execution time. A failover may appear to explain why the behavior disappeared. These explanations may be correct. However, before considering them confirmed, I normally try to reproduce the behavior and validate the conditions under which it occurs. A reasonable explanation is still a hypothesis until the available evidence supports it consistently. Reproduce the Smallest Useful Scenario A reproduction does not always need to recreate the complete production environment. In many cases, a smaller test provides a clearer result. For a connectivity issue, the test may require only: one client; one database endpoint; the same authentication method; the relevant network path; a clearly identified timestamp. For a performance issue, it may require: one representative query; the same parameters; the relevant database configuration; a controlled execution period. The objective is to isolate the behavior being investigated while reducing unnecessary variables. The smaller the scenario, the easier it normally becomes to understand why the result changes. Define the Expected Result Before running a test, I try to define what result I expect. For example: Hypothesis: The connection behavior depends on a specific network path. Expected Result: The behavior should occur when the connection uses that path and should not occur when an alternative path is used. Result That Would Challenge the Hypothesis: The same behavior occurs independently of the network path. The same approach can be used for performance investigations. Hypothesis: The query slowdown is caused by Data IO saturation. Expected Result: Query duration should increase when Data IO reaches its service-level limit. Result That Would Challenge the Hypothesis: The same slowdown occurs while Data IO remains low. Defining the expected result before the test helps avoid interpreting every outcome as confirmation of the initial explanation. Change One Variable at a Time When several conditions are changed simultaneously, it may be difficult to determine which one affected the result. For example, suppose a performance test includes: a larger service objective; updated statistics; a new index; lower concurrency. If performance improves, the result is positive, but it may not clearly identify which change produced the improvement. A more useful approach is to test each relevant change separately. Test Change Test 1 Original configuration Test 2 Updated statistics only Test 3 New index only Test 4 Higher service objective only This does not mean that every investigation requires an extensive test matrix. The objective is simply to avoid changing several important variables at the same time when we need to understand which one explains the behavior. Compare Where the Behavior Occurs and Where It Does Not Understanding where a behavior does not occur can be as useful as reproducing where it does. For example: Does the connection fail from one application server but succeed from another? Does the query perform normally with different parameters? Does the issue occur only through one network path? Does the previous execution plan perform better? Does the behavior disappear when concurrency is reduced? These comparisons help define the boundaries of the problem. They may not immediately identify the complete root cause, but they help determine which conditions are relevant and which ones are less likely to explain the result. Challenge the Explanation Once a test appears to support a hypothesis, I normally try to challenge it. For example, if performance improves after scaling the database, it may be tempting to conclude that CPU was insufficient. However, scaling may also provide: more memory; higher Data IO capacity; greater transaction-log throughput; additional workers; different resource limits. The improvement is important evidence, but additional information may still be required to identify which resource was actually limiting the workload. Similarly, if a failover restores normal performance, it may also have: disconnected blocking sessions; refreshed application connections; caused query recompilation; reset a temporary condition. The action that restores normal operation may not, by itself, fully explain the original cause. Document the Result and Its Limitations Not every test produces a definitive answer. A useful conclusion should describe: which conditions were tested; what result was expected; what result was observed; whether the result was repeatable; which differences from the original scenario remained; what the evidence did and did not allow us to confirm. For example: The behavior was reproduced only when the connection used the affected network path. The same authentication method and database endpoint worked successfully through an alternative path. Based on these tests, the network path was confirmed as a relevant condition. The available evidence did not identify the specific network component responsible for the behavior. This conclusion is useful because it clearly separates what was validated from what remains unknown. Conclusion Reproduction is one of the most valuable troubleshooting tools available to an engineer. However, its purpose is not simply to make an error occur again. A useful reproduction should help us understand: which conditions are required; which conditions are not relevant; what result supports the hypothesis; what result challenges it; how consistently the behavior can be observed. The most effective tests are often simple: reproduce the smallest useful scenario; define the expected result; change one variable at a time; compare affected and unaffected conditions; document the limitations. Reproduction does not only confirm that a behavior exists. It helps define the conditions under which the technical conclusion can be trusted.Lesson Learned #548: From Symptoms to Evidence – How I Approach an Azure SQL Investigation
After working on many Azure SQL support cases, I have learned that the initial service request details are essential, although they may not always provide sufficient information to understand the complete technical situation. When a service request is initially created, the available information may be limited to a brief description such as: The database is running slowly. CPU utilization is high. Connections are failing. The issue started after a deployment. Performance improved after a failover. The workload became slower after a service-tier migration. These details provide an important starting point for the investigation. However, the initial description may not yet include all the relevant timestamps, metrics, logs, configuration details, or historical context required for a complete technical assessment. This is completely understandable. At the time the service request is created, the immediate priority is normally to describe the observed behavior and its impact. Additional technical context can then be collected progressively during the investigation. For that reason, I normally use the initial service request details to understand the reported symptom and determine which additional information may be required. The first objective is to clarify the observed behavior, define the affected scope, and identify the evidence that may help us evaluate the different possible explanations. In this article, I would like to share the approach I normally follow when moving from an initial service request description to an evidence-based technical conclusion. Clarifying the Observed Behavior The first thing I normally try to understand is the exact impact. For example: Was the application completely unavailable, or was it slower than usual? Did the behavior affect all users or only a specific group? Did it affect all queries or only one process? Was the issue continuous or intermittent? Did it affect one database, several databases, or the complete logical server? Did the problem occur only from a particular network location? Did existing connections continue working while new connections failed? These questions may appear simple, but the answers can significantly change the direction of the investigation. For example, the initial service request details may indicate: Connections to Azure SQL Database are failing. After reviewing the scenario, we may find that: other applications can connect successfully; only one application instance is affected; existing connections continue working; only new connections are failing; the issue occurs from one specific network path. With this additional information, the situation may no longer appear to be a general Azure SQL connectivity issue. The investigation may instead need to focus on areas such as: application connection pooling; authentication; DNS resolution; token renewal; network routing; firewall rules; a specific application instance; client-side resource pressure. Similarly, a service request may indicate that the database is slow. Before looking for the cause, I normally try to understand what “slow” means in that specific situation. For example: Are all queries slower? Is only one stored procedure affected? Has execution time increased from seconds to minutes? Is the delay occurring while opening the connection? Is the delay occurring while executing the command? Is the application waiting on Azure SQL Database or on another dependency? Before reviewing metrics, logs, or execution plans, it is important to convert the initial description into a precise and measurable technical symptom. Distinguishing Observations from Possible Explanations One of the most useful habits I have developed is to separate what has been observed from what still needs to be validated. Consider the following statement: The application became slow when database CPU reached 95%. From this description, we may have two observations: the application experienced a slowdown; database CPU reached 95%. However, the relationship between those two observations still needs to be validated. High CPU may have caused the slowdown, but it could also be part of a larger chain of events. For example, CPU utilization may have increased because: the application started sending more requests; blocking caused requests to accumulate; a query execution plan changed; application retries generated additional workload; a scheduled process started running; concurrency increased; a query began processing more data; data distribution changed; statistics changed; a maintenance task started. In other words, high CPU may be the cause of the performance issue, but it may also be the result of another condition. I have seen similar situations after failovers, application restarts, and scaling operations. For example, the available details may indicate: Performance returned to normal after a failover. The failover is an important part of the investigation, but it may not, by itself, fully explain the original cause. A failover may also: disconnect blocking sessions; cause queries to compile again; refresh application connections; reset a temporary condition; clear some cached state; coincide with a reduction in workload. For this reason, I normally try to distinguish between: what was initially reported; what has been confirmed by telemetry; what is currently considered a possible explanation; what has already been validated. This distinction helps prevent an early assumption from becoming the final conclusion before sufficient evidence is available. Building a Timeline When timestamps and historical information are available, I normally try to build a timeline. A timeline is often one of the most useful parts of an investigation because several events may initially appear related until they are placed in the correct order. Consider the following example: Time Event 10:00 UTC Application deployment completed 10:05 UTC Active sessions started increasing 10:10 UTC Query duration increased 10:12 UTC Data IO reached 100% 10:15 UTC CPU reached 95% 10:20 UTC Application timeouts were reported 10:30 UTC Application service was restarted 10:35 UTC Session count returned to normal If the initial service request description mentions only the CPU peak and the application timeouts, CPU may appear to be the most likely starting point. However, the timeline shows that the number of active sessions and Data IO utilization increased before CPU reached 95%. This does not immediately confirm the root cause, but it changes the questions that should be asked. For example: Why did the number of sessions increase? Did requests start taking longer because of IO pressure? Did application retries contribute to the workload increase? Was the CPU peak the initial cause, or was it a consequence of the accumulating workload? Did the application deployment change request volume or execution patterns? Depending on the situation, the timeline may include information from: Azure Monitor metrics; Query Store; application logs; deployment history; audit events; scaling operations; failovers; configuration changes; maintenance processes; network changes. The objective is not to collect every piece of information available. The objective is to identify the sequence of events that may explain what happened before, during, and after the reported incident. Using Each Data Source for the Right Question Another lesson I have learned is that no single source of telemetry normally explains the complete situation. Different data sources answer different questions. Azure Monitor Azure Monitor can help identify whether the database reached limits related to: CPU; Data IO; log write; sessions; workers; storage; connection failures; deadlocks. These metrics are very useful for identifying when resource pressure occurred. However, a database-level metric may not directly identify the query, application, or operation responsible for that resource usage. Query Store Query Store may help identify: changes in query duration; increased CPU consumption; changes in execution count; increased logical reads; execution-plan changes; query regressions. It can be especially useful when a database-level metric needs to be correlated with specific query activity. Dynamic Management Views Dynamic Management Views may provide information about: active requests; waits; blocking; sessions; open transactions; memory grants; current resource consumption. This information is especially valuable while the issue is occurring. However, some of the data may no longer be available after the event has ended. Application Logs Application logs may help identify: connection timeouts; command duration; retry behavior; connection-pool exhaustion; authentication errors; dependency failures; changes in request volume. These logs often provide context that may not be visible from the database side. Deployment and Configuration History Deployment and configuration history may help explain why the behavior began at a particular time. This may include: application releases; schema changes; index operations; compatibility-level changes; connection-string updates; service-tier changes; network changes; security configuration changes. The important point is to choose the evidence according to the question being investigated. For example, if I am investigating whether a workload is limited by Data IO rather than CPU, reviewing only CPU percentage may not provide sufficient information. I would also want to understand: when Data IO reached its limit; whether query duration increased during the same period; which queries generated the highest number of reads; whether the workload started reading more data; whether the same degradation occurred when Data IO remained below its limit; whether additional IO capacity changed the result. The investigation becomes more effective when every piece of telemetry is connected to a specific technical question. Collecting more data does not automatically produce a better conclusion. Keeping More Than One Possible Explanation Open It is easy to identify one technically reasonable explanation and begin searching only for evidence that supports it. I normally try to avoid doing this, especially during the first stages of the investigation. For example, imagine that a database is migrated from a DTU-based service tier to a vCore-based service tier and the workload subsequently performs more slowly. One possible explanation is that the new environment does not provide sufficient CPU. However, other possibilities may include: lower Data IO capacity; lower transaction-log throughput; different memory availability; an execution-plan change; statistics changes; a compatibility-level difference; increased concurrency; a change in request volume; a change in data size or distribution; an application change unrelated to the migration. Each possible explanation requires different evidence. If CPU remains moderate while Data IO repeatedly reaches its limit, increasing the number of vCores without reviewing the storage characteristics may not address the main constraint. If Query Store shows a plan regression immediately after the migration, the selected service tier may not be the primary cause. If execution count doubled after an application deployment, the database may simply be processing more work than before. Keeping several possible explanations open does not make the investigation less decisive. It reduces the risk of reaching a conclusion before the relevant evidence has been reviewed. Defining What Would Challenge the Hypothesis One of the most useful questions I ask during troubleshooting is: What result would demonstrate that my current hypothesis may not be correct? Suppose the current hypothesis is: The performance degradation is caused by Data IO saturation. Evidence supporting this hypothesis may include: Data IO reaches 100% during the affected periods; query duration increases at the same time; the affected queries perform a high number of physical reads; CPU remains below its limit; performance improves when the workload runs with additional IO capacity. However, I should also look for results that may challenge the hypothesis. For example: Does the same slowdown occur while Data IO remains low? Are there periods with high Data IO but normal application performance? Are queries with very few reads also affected? Does additional IO capacity consistently improve the workload? Does changing another variable produce a larger improvement? Does the issue occur in an environment where the same IO pressure is not present? If an investigation only searches for supporting evidence, almost any initial theory may appear correct. Actively looking for evidence that challenges the current explanation makes the final conclusion stronger and more reliable. Conclusion After working on many support investigations, one of the most important lessons I have learned is that the initial service request details and the final technical conclusion naturally serve different purposes. The initial description provides the first available information about the observed behavior and its impact. At that stage, some of the relevant logs, metrics, timestamps, configuration details, or historical context may not yet be available. A reliable investigation begins with the initial service request details and develops progressively as additional evidence and technical context become available.
Modern Authentication (Oauth/OIDC)
The Significance of OAuth 2.0 and OIDC in Contemporary Society. In today's digital landscape, securing user authentication and authorization is paramount. Modern authentication protocols like OAuth 2.0 and OpenID Connect (OIDC) have become the backbone of secure and seamless user experiences. This blog delves into the roles of OAuth 2.0 and OIDC, their request flows, troubleshooting scenarios and their significance in the modern world. Why Oauth 2.0? What problem does it solve? Let's compare Oauth to traditional Forms based Authentication. Aspect OAuth Forms Authentication Password Sharing Eliminates the need for password sharing, reducing credential theft risk. Requires users to share passwords, increasing the risk of credential theft. Access Control Provides granular access control, allowing users to grant specific access to applications. Limited access control, often granting full access once authenticated. Security Measures Enhanced security measures, creating a safer environment for authentication. Susceptible to phishing attacks and credential theft. User Experience Simplifies login processes, enhancing user experience. Can lead to user password fatigue and weak password practices. Credential Storage Does not require storing user credentials, reducing the risk of breaches. Requires secure storage of user credentials, which can be challenging. Session Hijacking Provides mechanisms to prevent session hijacking. Vulnerable to session hijacking, where attackers steal session cookies. OAuth 2.0 Overview OAuth 2.0 is an authorization framework that allows third-party applications to obtain limited access to user resources without exposing user credentials. It provides a secure way for users to grant access to their resources hosted on one site to another site without sharing their credentials. OAuth 2.0 Request Flow Here’s a simplified workflow: Authorization Request: The client application redirects the user to the authorization server, requesting authorization. User Authentication: The user authenticates with the authorization server. Authorization Grant: The authorization server redirects the user back to the client application with an authorization code. Token Request: The client application exchanges the authorization code for an access token by making a request to the token endpoint. Token Response: The authorization server returns the access token to the client application, which can then use it to access protected resources. Let’s take an Example to depict the above Authorization code flow. Consider a front-end .NET core application which is built to make a request to Auth server to secure the token. (i.e. Auth token) the token then will be redeemed to gain access token and passed on to an API to get simple weather details. 1. In program.cs we will have the following code. builder.Services.AddAuthentication(OpenIdConnectDefaults.AuthenticationScheme) .AddMicrosoftIdentityWebApp(builder.Configuration.GetSection("AzureAd")) .EnableTokenAcquisitionToCallDownstreamApi(new string[] { "user.read" }) .AddDownstreamApi("Weather", builder.Configuration.GetSection("Weather")) .AddInMemoryTokenCaches(); The above code configures the application to use Microsoft Identity for authentication, acquire tokens to call downstream APIs, and cache tokens in memory. AddMicrosoftIdentityWebApp This line Registers OIDC auth scheme. It reads the Azure AD settings from the AzureAd section of the configuration file (e.g., appsettings.json). This setup allows the application to authenticate users using Azure Active Directory. EnableTokenAcquisitionToCallDownstreamApi This line enables the application to acquire tokens to call downstream APIs. The user.read scope is specified, which allows the application to read the user's profile information. This is essential for accessing protected resources on behalf of the user. AddDownstreamApi This line configures a downstream API named "Weather". It reads the configuration settings for the Weather API from the Weather section of the configuration file. This setup allows the application to call the Weather API using the acquired tokens. AddInMemoryTokenCaches This line adds an in-memory token cache to the application. Token caching is crucial for improving performance and reducing the number of token requests. By storing tokens in memory, the application can reuse them for subsequent API calls without needing to re-authenticate the user. 2. In applicationsettings.json we will have the following. "AzureAd": { "Instance": "https://login.microsoftonline.com/", "Domain": "Domain name", "TenantId": "Add tenant ID", "ClientId": "Add client ID", "CallbackPath": "/signin-oidc", "Scopes": "user.read", "ClientSecret": "", "ClientCertificates": [] }, In the home controller we can inject the IDownstreamApi field into home default constructor. private IDownstreamApi _downstreamApi; private const string ServiceName = "Weather"; public HomeController(ILogger<HomeController> logger, IDownstreamApi downstreamApi) { _logger = logger; _downstreamApi = downstreamApi; } 3. The following section makes an API call. public async Task<IActionResult> Privacy() { try { var value = await _downstreamApi.CallApiForUserAsync(ServiceName, options => { }); if (value == null) { return NotFound(new { error = "API response is null." }); } value.EnsureSuccessStatusCode(); // Throws if response is not successful string jsonContent = await value.Content.ReadAsStringAsync(); return Content(jsonContent, "application/json"); // Sends raw JSON as is } catch (HttpRequestException ex) { return StatusCode(500, new { error = "Error calling API", details = ex.Message }); } } The above code will make sure to capture the token by making call to Identity provider and forward the redeemed access token (i.e. Bearer token) to the backend Api. 4. Now let’s see the setup at the Web Api: In program.cs we will have the following code snippet. var builder = WebApplication.CreateBuilder(args); // Add services to the container. builder.Services.AddControllers(); builder.Services.AddMicrosoftIdentityWebApiAuthentication(builder.Configuration); builder.Services.AddEndpointsApiExplorer(); builder.Services.AddSwaggerGen(); Followed by Appsettings.json. "AzureAd": { "Instance": "https://login.microsoftonline.com/", "Domain": "Domain name", "TenantId": “Add tenant id", "ClientId": "Add client id.", "CallbackPath": "/signin-oidc", "Scopes": "user.read", "ClientSecret": "", "ClientCertificates": [] }, In the controller we can have the following. namespace APIOauth.Controllers { [Authorize(AuthenticationSchemes = "Bearer")] [ApiController] [Route("[controller]")] public class WeatherForecastController : ControllerBase { private static readonly string[] Summaries = new[] { "Freezing", "Bracing", "Chilly", "Cool", "Mild", "Warm", "Balmy", "Hot", "Sweltering", "Scorching" }; To drill down the request flow let’s capture a fiddler: Step 1: First 2 calls are made by the application to openid-configuration and Keys end points. The first step is crucial as the application requires Open id configuration to know what configuration it has and what are the supported types. Example: Claims supported; scopes_supported, token_endpoint_auth_methods_supported, response mode supported etc… Secondly the keys endpoint provides all the public keys which can later be used to Decrypt the token received. Step 2: Once we have the above config and keys the application now Redirects the user to identity provider with the following parameters. Points to be noted in the above screen is the response_type which is code (Authorization code) and the response_mode is Form_post. Step 3: The subsequent request is the Post requests which will have the Auth code in it. Step 4: In this step we will redeem the auth code with access token. Request is made by attaching the auth code along with following parameters. Response is received with an access token. Step 5: Now the final call is made to the Api along with the access token to get weather details. Request: Response: This completes the Oauth Authorization code flow. Let us now take a moment to gain a brief understanding of JWT tokens. JWTs are widely used for authentication and authorization in modern web applications due to their compact size and security features. They allow secure transmission of information between parties and can be easily verified and trusted. Structure A JWT consists of three parts separated by dots (.), which are: Header: Contains metadata about the type of token and the cryptographic algorithms used. Payload: Contains the claims. Claims are statements about an entity (typically, the user) and additional data. Signature: Ensures that the token wasn't altered. It is created by taking the encoded header, the encoded payload, a secret, the algorithm specified in the header, and signing that. Here is an example of a JWT: OpenID Connect. (OIDC) OIDC Overview OpenID Connect is an authentication layer built on top of OAuth 2.0. While OAuth 2.0 handles authorization, OIDC adds authentication, allowing applications to verify the identity of users and obtain basic profile information. This combination ensures both secure access and user identity verification. OIDC Request Flow OIDC extends the OAuth 2.0 authorization code flow by adding an ID token, which contains user identity information. Here’s a simplified workflow: Authorization Request: The client application redirects the user to the authorization server, requesting authorization and an ID token. User Authentication: The user authenticates with the authorization server. Authorization Grant: The authorization server redirects the user back to the client application with an authorization code. Token Request: The client application exchanges the authorization code for an access token and an ID token by making a request to the token endpoint. Token Response: The authorization server returns the access token and ID token to the client application. The ID token contains user identity information, which the client application can use to authenticate the user. Example: Consider .Net core application which is setup for user Authentication. Let’s see the workflow. Let’s capture a fiddler once again to see the authentication flow: Step 1: & Step 2: would remain same as we saw in Authorization code flow. Making a call to OpenID configuration & making a call to Keys Endpoint. Step 3: Response type here is “ID token” and not a Auth code as we saw in Authorization code flow. This is an implicit flow since we are not redeeming or exchanging an Auth code. Also, an Implicit flow doesn't need a client secret. Step 4: In a post request to browser, we will receive an ID token. This completes the implicit code flow which will result in getting the ID token to permit the user to the application. Common Troubleshooting Scenarios Implementing OAuth in ASP.NET Core can sometimes present challenges. Here are some common issues and how to address them: 1. Misconfigurations Misconfigurations can lead to authentication failures and security vulnerabilities. For example, loss of internet connection or incorrect settings in the OAuth configuration can disrupt the authentication process. One example which we have faced is servers placed in “DMZ” with no internet access. Server need to make an outbound call to login.microsoft.com or identity provider for getting the metadata for openId/Oauth. 2. Failures due to server farm setup. Loss of saving Data protection keys on different workers. Data protection is used to protect Cookies. For server farm the data protection keys should be persisted and shared. One common issue with data protection keys in OAuth flow is the synchronization of keys across different servers or instances. If the keys are not synchronized correctly, it can result in authentication failures and disrupt the OAuth flow. In memory token caches can also cause re-authentication since the user token might exist in other workers or get purged after a restart. 3. Token Expiration Token expiration can disrupt user sessions and require re-authentication, which can frustrate users. It's essential to implement token refresh functionality to enhance user experience and security. 4. Redirect URI Mismatches Redirect URI mismatches can prevent applications from receiving authorization cods, causing login failures. Ensure that the redirect URI specified in the identity provider’s settings matches the one in your application. 5. Scope Misconfigurations Improperly configured scopes can result in inadequate permissions and restrict access to necessary resources. It's crucial to define the correct scopes to ensure that applications have the necessary permissions to access resources. By understanding these common pitfalls and implementing best practices, developers can successfully integrate OAuth into their ASP.NET Core applications, ensuring a secure and seamless user experience. References: Call a web API from a web app - Microsoft identity platform | Microsoft Learn Microsoft identity platform and OAuth 2.0 authorization code flow - Microsoft identity platform | Microsoft Learn OpenID Connect (OIDC) on the Microsoft identity platform - Microsoft identity platform | Microsoft Learn I hope it helps!2.9KViews2likes2CommentsTroubleshooting tips from the Windows Server support team
In this video, Windows Server support engineers Giles Pauli, Jeff Hughes, and Mike Rhoads talk with Pierre Roman, sharing insights into the most common issues faced by users of Windows Server and how the support team addresses these cases. Each engineer shares their perspective on recurring challenges, highlighting both technical issues and user misunderstandings and the conversation is structured to provide practical advice for IT professionals and administrators on how to prevent or resolve these common problems. The most frequent support cases include: Active Directory Issues: Problems with domain controllers, replication failures, and account lockouts are among the top reasons customers contact support. These often stem from misconfigurations, outdated documentation, or network connectivity problems. Update and Patch Management: Many cases involve failed updates, compatibility issues after patching, or confusion about update sequencing and prerequisites. Storage and Disk Management: Common cases include troubleshooting storage spaces, disk failures, and issues with mounting or accessing network shares. Networking Problems: Support often addresses DNS misconfigurations, DHCP issues, and firewall or routing problems that impact server connectivity. Performance and Resource Bottlenecks: Customers frequently report slow server performance, which is often traced to resource constraints, misconfigured services, or hardware limitations. Role and Feature Installation Failures: Issues arise when installing or configuring server roles such as Hyper-V, IIS, or Remote Desktop Services, often due to missing dependencies or conflicting settings. The engineers emphasize the importance of proactive maintenance, such as regular backups, monitoring, and keeping systems up to date, to reduce the frequency of support cases. They also highlight the value of clear documentation and change management to prevent configuration drift and recurring issues.674Views1like0CommentsSpotlight on the ADX Time Pivot Visualization
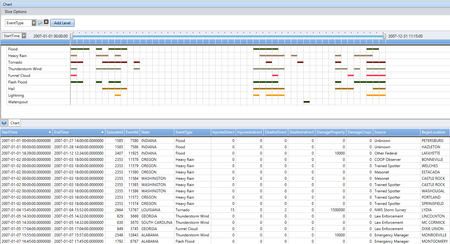
The Time Pivot chart is a powerful interactive navigation tool that lets you analyze your data over an events timeline, that pivots on a time axis. Time Pivot makes it easy to identify event flows, and beautifully tells the story of “what happened”. It helps you to generate multiple views of the same data by letting you pick multiple levels of data slicing. Time Pivot visualization is your essential tool for analyzing data across hundreds of different tables.5.8KViews7likes2Comments