threat hunting & ti
354 Topics
Growing our connector ecosystem with 500+ Microsoft Sentinel connectors
Connecting the modern security environment Having spent years working across Microsoft's cloud, AI, and customer-facing organizations. I have seen that technology delivers the greatest value when it works with the environments customers already operate. That's especially true in cybersecurity. Most organizations rely on a diverse mix of platforms, applications, and security solutions. Security teams need to bring signals from across that environment together so they can understand risk, investigate threats, and respond with confidence. As a Microsoft Security customer experience leader, one of my priorities is ensuring that we're helping connect these technologies and get more value from their existing investments. When security data remains fragmented across disconnected tools, teams can lose valuable context. When that data comes together, defenders gain a more complete view of their environment and can make faster, better-informed decisions. Expanding the connector ecosystem Microsoft recently announced the Integrated Security Operations Center (ISOC) in Microsoft Defender. ISOC brings together security signals, threat intelligence, AI, and protection capabilities into a unified experience. It gives humans defenders and AI agents shared context to reason across the environment, coordinate investigations, and strengthen protection. Today, we are expanding the connector ecosystem to more than 500 connectors that enable customers to bring data from Microsoft and diverse third-party sources into their security operations experience. By connecting more signals across the technology estate, organizations can build a more complete understanding of risk and uncover relationships that might otherwise remain fragmented across separate tools. Combined with Microsoft's threat intelligence, AI, and protection capabilities, those signals become actionable context that helps human defenders and AI agents make better decisions and coordinate protection at the speed of the threat. Growing through partnership The strength of this connector ecosystem reflects the work of Microsoft and our technology partners to support our shared customers. Together, we are helping organizations connect the technologies they rely on and bring more of their security data into a unified operational experience. Below we showcase just a portion of the many partners with solutions available in Microsoft Security Store today. We remain committed to expanding this ecosystem so customers can achieve can gain broader visibility and greater value from their security investments. How to Get Started For Customers If you are a Microsoft Sentinel or ISOC customer, or considering adopting it, we are committed that you have the security connectors and integrations you need to enable your use of the platform. If an integration with an independent software vendor, or ISV solution is not yet available, or you have an issue with a solution already published, we have a dedicated team that may be able to assist by working with ISVs to build new, or update existing, connectors. If you have such a need, submit a request here. For Software Companies If you are a software development partner, the Microsoft Sentinel Codeless Connector Framework, or CCF, provides a streamlined way to bring your product into the Microsoft Security ecosystem. Use our Sentinel connector builder agent now to turn your API documentation into a working connector in just minutes. Partners can also come to us directly for engineering guidance and support in getting a connector built or improved. Reach out to us via our intake form. Building a more connected foundation for security operations Our goal is simple: help customers protect their digital environments by giving human defenders and AI agents a more complete picture of risk. We'll continue investing in connectors, partnerships, and integrated security experiences to help customers defend their organizations with greater visibility, context, and confidence. Learn More Microsoft Sentinel What is Microsoft Sentinel Empower Real-Time Security with Microsoft Sentinel’s CCF Push Feature | Microsoft Community Hub Sentinel connector hands-on labs Building Microsoft Sentinel Connectors in Minutes with the Sentinel Connector Builder Agent Building a CCF Nested API Pull Connector: A Technical Lab Walkthrough Microsoft Sentinel features in public preview Accelerate connectors development using AI agent in Microsoft Sentinel | Microsoft Community Hub Extending Sentinel Data Integration: Azure Blob Storage Support for CCF Connectors | Microsoft Community Hub Public Preview: Nested API Support Comes to Microsoft Sentinel CCF | Microsoft Community Hub Public Preview: Multi-Account Support for Microsoft Sentinel Codeless Connectors | Microsoft Community Hub474Views0likes1CommentTurn threat intelligence into informed action with Microsoft Defender
Every new threat raises a familiar set of questions. Is it targeting our industry? Are we exposed? What should we investigate first? Answering those questions takes more than another feed or a longer list of indicators. It takes intelligence that brings the relevant context together and helps your team understand which threats matter to your organization and where to investigate next. With the new Threat Intelligence experience in Microsoft Defender, we're bringing Microsoft threat intelligence, third-party sources, and your team's own insights together around the way you work. Threat Intelligence Overview helps you prioritize the threats most relevant to your organization. Threat Intelligence Explorer gives analysts a centralized experience to search, filter, and investigate the intelligence behind them. Focus on the threats that matter to your organization A threat can be significant globally without being your team's most urgent concern. Your industry, the regions where you operate, and what's happening in your environment all shape what deserves attention. Threat Intelligence Overview puts that context at the center of your starting page. The personalized dashboard brings the external threat landscape together with insights about your organization, highlighting relevant threats, their impact, and your exposure. You can focus on industries and regions of interest, see threats actively affecting your organization, and identify where a closer investigation is needed. For an analyst planning the day's research or a security leader reviewing emerging risks, the starting point is the same: what matters to us right now? From there, you can move into Explorer to examine the intelligence behind a threat. Prioritize threats using a personalized view of the threat landscape, organizational impact, and exposure. Bring Microsoft, third-party, and your own intelligence into the same investigation A Microsoft report may explain how an actor operates. A third-party feed may identify infrastructure associated with that activity. Your own team may have intelligence from a previous investigation. Each contributes a different part of the picture. Threat Intelligence Explorer lets you work with those sources together. Microsoft Research articles and indicators sit alongside connected third-party feeds and intelligence curated by your organization. Start with what you know: an actor's name, a CVE, a domain, or an IP address. Free-text search finds matching intelligence across the types and sources available to your organization. Refine the results by type, industry, geography, or source, then follow relationships to understand how individual findings fit together. Threat Intelligence Explorer covers indicators, threat actors, campaigns, attack patterns, tools, vulnerabilities, and reports. You can move from understanding a threat to examining its associated intelligence, then continue from an indicator's details into the relevant Defender entity page for deeper investigation. Search across intelligence sources and follow relationships from a threat to the evidence you need to investigate. Follow a lead from relevance to investigation Suppose your team is researching Aqua Blizzard. The question is not simply what the actor does, but whether its activity should change your priorities. In Threat Intelligence Overview, you can review threats relevant to your industry and regions alongside available impact and exposure information. In Threat Intelligence Explorer, a search for the actor brings together matching intelligence from Microsoft, your connected feeds, and your organization's repository. From there, you can review a report, filter the results, and follow available relationships to associated intelligence. If an indicator warrants a closer look, continue into its Defender entity page to investigate further. As the picture becomes clearer, you can tag relevant records in your Threat Intelligence Platform and curate intelligence for the team. What began as a question about a threat actor becomes focused research, a deeper investigation where needed, and intelligence your colleagues can build on. Keep the intelligence you rely on Threat Intelligence Overview and Explorer replace the previous Threat Intelligence pages (Threat Analytics, Intel Management) with a personalized starting point and a shared investigation workspace. The Microsoft reports you rely on remain available in full detail (build on convergence of Microsoft Defender Threat Intelligence into Microsoft Sentinel and Defender XDR), and your existing intelligence carries over. The transition is designed to preserve existing threat intelligence capabilities, with the new experience bringing them together through Threat Intelligence Overview and Explorer. Customers with an eligible Microsoft Defender license can access the new experience. For details on eligible licenses, see Microsoft Defender XDR prerequisites. Learn more Explore threat intelligence with Intel Explorer Transition to the new Threat intelligence experience765Views0likes1CommentIntroducing the Microsoft Sentinel ASIM EmailEvent schema
Email remains one of the most common entry points for security threats. Yet email products often describe the same activity with different table names, fields, and values. This makes it harder to build detections and investigations that work consistently across data sources. The Microsoft Sentinel Advanced Security Information Model, or ASIM, EmailEvent schema is now available. It provides a common structure for email delivery and inspection events, helping customers and partners create security content that works across supported email data sources. A consistent view of email security activity EmailEvent standardizes the information analysts need to understand what happened to an email and why. It covers: Email delivery and inspection events Sender, source, and recipient information Message subject, size, direction, and delivery location URLs and file attachments SPF, DKIM, and DMARC authentication results Delivery actions such as delivered, blocked, quarantined, or deleted Threat, risk, confidence, tactic, technique, and remediation details Instead of learning a different data model for every product, analysts can query the normalized EmailEvent fields. Parser developers map each source's native data to the same schema. How it works Consider an email that contains a suspicious attachment. The email security product records the sender, recipients, attachment, authentication results, inspection verdict, and final action. A connector collects that event. A parser or Data Collection Rule maps the source fields to EmailEvent. Microsoft Sentinel can then query the normalized record using the same field names used for other supported email sources. This common structure separates security content from the details of a specific product. When another source adds an EmailEvent parser, existing source-independent queries and detections can work with that source without being rewritten around its native field names. Why it matters Simpler analytics: Write queries against one consistent set of email fields. Broader coverage: Apply source-independent security content across normalized email sources. Faster investigations: Compare delivery, authentication, attachment, URL, and threat details without translating different data models. Easier integration: Give connector and parser developers a defined contract for bringing new email telemetry into ASIM. EmailEvent does not replace the rich native data produced by email security products. It provides a consistent security layer that makes that data easier to use together. Build on EmailEvent The EmailEvent release includes the schema definition, source-independent parser framework, filtering parser, deployment templates, and validation support in the Azure-Sentinel repository. The schema version is 1.0.0. Customers can use normalized EmailEvent data to develop hunting queries, analytics rules, workbooks, and investigation experiences. Partners and community contributors can create source-specific parsers that map their email data to the schema. Get started Normalization Email Schema MS Learn Learn about normalization and ASIM Explore the EmailEvent implementation in Azure-Sentinel Deploy ASIM parsers Thank you to the ASIM engineering and partner teams who contributed to the schema, deployment path, validation, and release.824Views1like0CommentsFrom Domain Lists to Decisions: Scaling WHOIS Threat Intelligence with MDTI and Microsoft Graph
The real problem isn't WHOIS. It's what WHOIS costs you at scale. Ask any SOC analyst whether WHOIS data is useful and they'll say yes without hesitation. Registrant emails, creation dates, registrars, and nameservers are among the most durable pivots in domain-based threat intelligence — the threads that tie a single phishing domain back to an entire adversary campaign. Now ask them how often they actually pull WHOIS for every suspicious domain in an alert. The honest answer is: not always. And that gap is the real problem. Here's why. When a campaign surfaces two hundred lookalike domains, manual WHOIS becomes a losing game: It's slow. One-domain-at-a-time portal lookups don't finish before the incident clock runs out. It's inconsistent. Different analysts capture different fields, so the data can't be compared or correlated. It's un-auditable. Screenshots and copy-paste don't hold up in an investigation review months later. It loses the pattern. By the time you've checked twenty domains by hand, the shared registrant email that connected them has scrolled off the screen. The outcome of all this friction is the part that should worry a security leader: analysts quietly stop enriching, or enrich only a sample. The pivot that would have collapsed twenty alerts into one campaign never happens. The newly registered domain that should have been escalated gets triaged as routine. The intelligence exists — the process just can't reach it fast enough. The outcome we're actually after Reframe the goal. This isn't a project to "run WHOIS." It's a project to produce a specific set of outcomes: Every suspicious domain gets enriched — not a hand-picked sample. Enrichment is consistent and structured, so patterns across domains become visible instead of buried. The output is audit-ready — defensible in an investigation and reusable in a report. The whole thing is fast enough to happen inside the incident, not the day after. Get-MDTIWhois.ps1 exists to deliver exactly those outcomes. It reads a list of domains, calls Microsoft Defender Threat Intelligence (MDTI) through Microsoft Graph, and returns both a normalized CSV for immediate triage and the raw JSON for deep investigation — in one pass, read-only, with nothing changed in your environment. What changes for the analyst The clearest way to see the value is the before-and-after. Before: An alert fires on a suspected phishing campaign with two hundred candidate domains. The analyst opens a portal, checks a handful of domains, eyeballs a few registrant fields, and makes a judgment call on incomplete data. Correlation is mental and fragile. Twenty related alerts stay twenty separate alerts. After: The analyst drops the domains into a text file, runs one command, and gets a spreadsheet where all two hundred are enriched with the same fields. Sorting by registrant email instantly reveals that forty of them share one address, one budget registrar, and creation dates in the same week. Twenty alerts become one campaign. One judgment call becomes one defensible conclusion. That's the outcome: not "we ran WHOIS," but "we saw the campaign the manual process would have missed." Where the value shows up This translates into concrete wins across several SOC workflows: Faster campaign triage. Shared registrant emails and nameservers collapse dozens of alerts into a single adversary-infrastructure story — directly reducing mean-time-to-respond. Better newly-registered-domain hunting. Enrich domains from DNS or proxy logs, sort by registration date, and surface the freshly registered domains that are disproportionately malicious — before they're clicked. Enrichment that feeds the platform. The normalized CSV drops straight into a Sentinel watchlist, or the same Graph call can be wrapped in a Logic App / Azure Function playbook to auto-enrich domain entities the moment an incident is created. Reusable intelligence. Registrant and nameserver pivots become custom indicators and hunting queries — value that compounds over time instead of being thrown away after each investigation. Why this approach, specifically There are other ways to get WHOIS. A few reasons this approach earns its place in a modern, Defender-portal-centric SOC: It uses first-party intelligence. MDTI is Microsoft's own threat-intelligence graph, queried natively through Microsoft Graph — no third-party data broker, no separate contract, no data leaving your Microsoft trust boundary. It's read-only by design. The script cannot modify Sentinel, Defender, tenant settings, or domain records. Enrichment tooling should never be able to change the environment it observes — and this one can't. It's built to survive real-world APIs. Throttling (HTTP 429) and transient 5xx errors are retried with backoff; permanent misses (404) aren't retried needlessly; a single failed domain never aborts the run. You always get a complete, dependable result set. It handles secrets the way you'd want. Client secrets come from an environment variable or a secure prompt — never hard-coded, never committed to source control. The engineering exists to protect the outcome: a complete, consistent, trustworthy enrichment set every single time, even when the input list is messy or the API is having a bad day. The output is built for decisions, not just data Two files, two jobs: The normalized CSV is the decision surface. One row per domain, every registrant/registrar/date/nameserver field an analyst pivots on — sortable, filterable, watchlist-ready. This is where twenty alerts become one campaign. The raw JSON is the safety net. Full API fidelity per domain, preserved for the audit trail and for the registrar-specific edge cases the normalized view can't anticipate. Together they answer both questions a SOC actually asks: "What do I do right now?" (CSV) and "Can I stand behind it later?" (JSON). What it takes to get there The barrier to entry is low: An Entra ID app registration with the Graph application permission ThreatIntelligence.Read.All (admin-consented), on a tenant with MDTI API access. A text file of domains, one per line. One command: $env:MDTI_CLIENT_SECRET = "<client-secret>" .\Get-MDTIWhois.ps1 ` -TenantId "<tenant-id>" ` -ClientId "<client-id>" ` -InputTxt ".\domains.txt" Under the covers it authenticates with a client-credentials grant, normalizes and de-duplicates the input, calls GET /security/threatIntelligence/hosts/{domain}/whois per domain, and writes both outputs. Minutes of setup; a repeatable capability afterward. Use it responsibly The project is provided as-is, for educational and demonstration purposes, and is not intended for production use without independent review, validation, and monitoring. Keep in mind: A 404 means MDTI has no current WHOIS record for that host — not that the domain is safe. WHOIS fields vary by registrar — always retain the raw JSON for anything you'll act on. WHOIS can contain personal data — validate your storage and sharing obligations before distributing enrichment output. Never commit secrets — use the environment-variable or secure-prompt path. The bottom line The value here isn't that WHOIS is difficult. It's that the friction of doing WHOIS well, for everything, quietly erodes detection quality — analysts under time pressure enrich less, correlate by memory, and miss the campaign hiding in plain sight. Get-MDTIWhois.ps1 removes that friction. It turns a flat list of domains into structured, audit-ready intelligence in a single read-only pass, so the pivot that reveals the adversary's infrastructure actually happens — inside the incident, not after it. That's the outcome worth automating. Disclaimer This article and the referenced tooling are provided “as-is,” for educational and demonstration purposes only, without warranties of any kind, express or implied. They are not intended for production, safety-critical, or regulated use without independent review, testing, validation, and appropriate safeguards. The views expressed are the author’s own and do not necessarily represent those of any employer or of Microsoft. You are solely responsible for how you deploy, modify, or adapt this tooling, and for ensuring compliance with all applicable laws, regulations, licensing terms, privacy obligations, and organizational security policies. Source: MDTI-WHOIS in the Microsoft Security Operations Toolkit. Provided as-is for educational purposes; test in a controlled environment before production use.
RESYNC MICROSOFT DEFENDER FOR ENDPOINT
hey guys im a junior IT officer and i have been tasked with finding a way to get microsoft defender for enpoint to get fresh data without waiting 24hrs or the 4 hours that microsoft insists the resync will happen,I tried advanced hunting running queries directly there,i tried runnning an anti virus scan but nothing happened and APIs i tried looking for APIs that can initiate a restart but nothing...any ideas ? i read on here there was github repo for using powerBI with defender to get new data https://github.com/microsoft/MicrosoftDefenderForEndpoint-PowerBI but its not clear how that work...any intel would be helpful350Views0likes1Comment
In Advanced Hunting "Include in query" generates incorrect KQL for nested JSON array fields
Hi, In Microsoft Defender Advanced Hunting, using the right-click "Include in query" option on a nested value inside SigninLogs.AuthenticationDetails generates incorrect KQL. Example data structure: [ { "authenticationMethod": "Previously satisfied" } ] When I right-click the authenticationMethod value, Defender generates: | where parse_json(AuthenticationDetails)["0.authenticationMethod"] == "Previously satisfied" This returns no results. The correct KQL is: | where tostring(parse_json(AuthenticationDetails)[0].authenticationMethod) == "Previously satisfied" or: | where tostring(parse_json(AuthenticationDetails)[0]["authenticationMethod"]) == "Previously satisfied" The generated syntax appears to treat "0.authenticationMethod" as one JSON property name instead of navigating to array element [0] and then accessing the authenticationMethod property. I have also observed that Microsoft Sentinel generates the expected syntax for the same type of nested field, while the Microsoft Defender portal generates the incorrect form. This is reproducible with SigninLogs.AuthenticationDetails, which is stored as a string containing a JSON array. Expected behavior: parse_json(AuthenticationDetails)[0].authenticationMethod Actual behavior: parse_json(AuthenticationDetails)["0.authenticationMethod"] Plase confirm whether this is a known issue with the Advanced Hunting result / Inspect Record / Include in query functionality.122Views0likes0CommentsIntegrating Proofpoint and Mimecast Email Security with Microsoft Sentinel
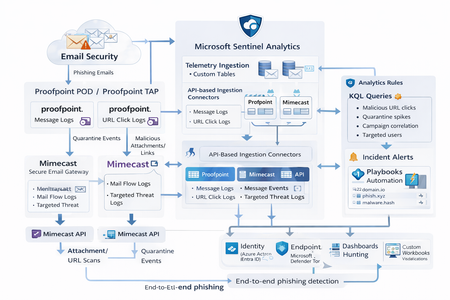
Microsoft Sentinel can ingest rich email security telemetry from Proofpoint and Mimecast to power advanced phishing detection. The Proofpoint On Demand (POD) Email Security and Proofpoint Targeted Attack Protection (TAP) connectors pull threat logs (quarantines, spam, phishing attempts) and user click data into Sentinel. Similarly, the Mimecast Secure Email Gateway connector ingests detailed mail flow and targeted-threat logs (attachment/URL scans, impersonation events). These integrations use Azure-hosted ingestion (via Logic Apps or Azure Functions) and the new Codeless Connector framework to call vendor APIs on a schedule. The result is a consolidated dataset in Sentinel’s Log Analytics, enabling correlated alerting and hunting across email, identity, and endpoint signals. Figure: Phishing emails are processed by Mimecast’s gateway and Proofpoint POD/TAP services. Security logs (delivery/quarantine events, malicious attachments/links, user clicks) flow into Microsoft Sentinel. In Sentinel, these mail signals are correlated with identity (Azure AD), endpoint (Defender) and network telemetry for end-to-end phishing detection. Proofpoint POD (Email Protection) Connector The Proofpoint POD connector ingests core email protection logs. It creates two tables, ProofpointPODMailLog_CL and ProofpointPODMessage_CL. These logs include per-message metadata (senders, recipients, subject, message size, timestamps), threat scores (spamScore, phishScore, malwareScore, impostorScore), and attachment details (number of attachments, names, hash values and sandbox verdicts). Quarantine actions are recorded (quarantine folder/rule) and malicious indicators (URL or file hash) and campaign IDs are tagged in the threatsInfoMap field. For example, each ProofpointPODMessage_CL record may carry a sender_s (sender email domain hashed), recipient list, subject, and any detected threat type (Phish/Malware/Spam/Impostor) with associated threat hash or URL. Deployment: Proofpoint POD uses Sentinel’s codeless connector (an Azure Function behind the scenes). You must provide Proofpoint API credentials (Cluster ID and API token) in the connector UI. The connector periodically calls the Proofpoint SIEM API to fetch new log events (typically in 1–2 hour batches). The data lands in the above tables. (Older custom logic-app approaches similarly parse JSON output from the /v2/siem/messages endpoints.) Proofpoint TAP (Targeted Attack Protection) Connector Proofpoint TAP provides user-click and message-delivery events. Its connector creates four tables: ProofPointTAPMessagesDeliveredV2_CL, ProofPointTAPMessagesBlockedV2_CL, ProofPointTAPClicksPermittedV2_CL, and ProofPointTAPClicksBlockedV2_CL. The message tables report emails with detected threats (URL or attachment defense) that were delivered or blocked by TAP. They include the same fields as POD (message GUID, sender, recipients, subject, threat campaign ID, scores, attachments info). The click tables log when users click on URLs: each record has the URL, click timestamp (clickTime), the user’s IP (clickIP), user-agent, the message GUID, and the threat ID/category. These fields allow you to see who clicked which malicious link and when. As the connector description notes, these logs give “visibility into Message and Click events in Microsoft Sentinel” for hunting. Deployment: The TAP connector also uses the codeless framework. You supply a TAP API service principal and secret (proofpoint SIEM API credentials) in the Sentinel content connector. The function app calls TAP’s /v2/siem/clicks/blocked, /permitted, /messages/blocked, and /delivered endpoints. The Proofpoint SIEM API limits queries to 1-hour windows and 7-day history, with no paging (all events in the interval are returned). (A Logic App approach could also be used, as shown in the Tech Community blog: one HTTP GET per event type and a JSON Parse before sending to Log Analytics.) Mimecast Secure Email Gateway Connector The Mimecast connector ingests the Secure Email Gateway (SEG) logs and targeted-threat (TTP) logs. Inbound, outbound and internal mail events from the Mimecast MTA (receipt, processing, delivery stages) are pulled via the API. Typical fields include the unique message ID (aCode), sender, recipient, subject, attachment count/names, and the policy actions or holds (e.g. spam quarantine). For example, the Mimecast “Process” log shows AttCnt, AttNames, and if the message was held (Hld) for review. Delivery logs include the success/failure and TLS details. In addition, Mimecast TTP logs are collected: URL Protect logs (when a user clicks a blocked URL) include the clicked URL (url), category (urlCategory), sender/recipient, and block reason. Impersonation Protect logs capture spoofing detections (e.g. if an internal name is impersonated), with fields like Sender, Recipient, Definition and Action (hold/quarantine). Attachment Protect logs record malicious file detections (filename, hash, threat type). Deployment: Like Proofpoint, Mimecast’s connector uses Azure Functions via the Sentinel content hub. You install the Mimecast solution, open the connector page, then enter Azure app credentials and Mimecast API keys (API Application ID/Key and Access/Secret for the service account). As shown in the deployment guide, you must provide the Azure Subscription, Resource Group, Log Analytics Workspace and the Azure Client (App) ID, Tenant ID and Object ID of the admin performing the setup. On the Mimecast side, you supply the API Base URL (regional), App ID/Secret and user Access/Secret. The connector creates a Function App that polls Mimecast’s SIEM APIs on a cron schedule (default every 30 minutes). You can optionally specify a start date for backfilling up to 7 days of logs. The default tables are MimecastSIEM_CL (for email flow logs) and MimecastDLP_CL (for DLP/TTP events), though custom names can be set. Ingestion Considerations Data Latency: All these connectors are pull-based and typically run on a schedule (often 30–60 minutes). For example, the Proofpoint POD docs note hourly log increments, and Mimecast logs are aggregated every 30 minutes. Expect a delay of up to an hour or more from event occurrence to Sentinel ingestion. Schema Nuances: The APIs often return nested arrays and optional fields. For instance, the Proofpoint blog warns that some JSON fields can be null or vary in type, so the parse schema should account for all possibilities. Similarly, Mimecast logs come in pipe-delimited or JSON format, with values sometimes empty (e.g. no attachments). In KQL, use tostring() or parse_json() on the raw _CL columns, and mv-expand on any multivalue fields (like message parts or threat lists). Table Names: Use the connector’s tables as listed. For Proofpoint: ProofpointPODMailLog_CL and ProofpointPODMessage_CL; for TAP: ProofPointTAPMessagesDeliveredV2_CL, ProofPointTAPMessagesBlockedV2_CL, ProofPointTAPClicksPermittedV2_CL, ProofPointTAPClicksBlockedV2_CL. For Mimecast SEG/TTP: MimecastSIEM_CL (seg logs) and MimecastDLP_CL (TTP logs). API Behavior: The Proofpoint TAP API has no paging. Be aware of timezones (Proofpoint uses UTC) and use the Sentinal ingestion TimeGenerated or event timestamp fields for binning. Detection Engineering and Correlation To detect phishing effectively, we correlate these email logs with identity, endpoint and intel data: Identity (Azure AD): Mail logs contain recipient addresses and (hashed) sender user parts. A common tactic is to correlate SMTP recipients or sender domains with Azure AD user records. For example, join TAP clicks by recipient to the user’s UPN. The Proofpoint logs also include the clicker’s IP (clickIP); we can match that to Azure AD sign-in logs or VPN logs to find which device/location clicked a malicious link. Likewise, anomalous Azure AD sign-ins (impossible travel, MFA failure) after a suspicious email can strengthen the case. Endpoints (Defender): Once a user clicks a bad link or opens a malicious attachment (captured in TAP or Mimecast logs), watch for follow-on behaviors. For instance, use Sentinel’s DeviceSecurityEvents or DeviceProcessEvents to see if that user’s machine launched unusual processes. The threatID or URL hash from email events can be looked up in Defender’s file data. Correlate by username (if available) or IP: if the email log shows a link click from IP X, see if any endpoint alerts or logon events occurred from X around the same time. As the Mimecast integration touts, this enables “correlation across Mimecast events, cloud, endpoint, and network data”. Threat Intelligence: Use Sentinel’s ThreatIntelligenceIndicator tables or Microsoft’s TI feeds to tag known bad URLs/domains in the email logs. For example, join ProofPointTAPClicksBlockedV2_CL on the clicked url against ThreatIntelligenceIndicator (type=URL) to automatically flag hits. Proofpoint’s logs already classify threats (malware/phish) and provide a threatID; one can enrich that with external intel (e.g. check if the hash appears in TI feeds). Mimecast’s URL logs include a urlCategory field, which can be mapped to known malicious categories. Automated playbooks can also pull Intel: e.g. use Sentinel’s TI REST API or Azure Sentinel watchlists containing phishing domains to annotate events. In summary, a robust detection strategy might look like: (1) Identify malicious email events (high phish scores, quarantines, URL clicks). (2) Correlate these events by user with Azure AD logs (did the user log in from a new IP after a phish click?). (3) Correlate with endpoint alerts (Defender found malware on that device). (4) Augment with threat intelligence lookups on URLs and attachments from the email logs. By linking the Proofpoint/Mimecast signals to identity and endpoint events, one can detect the full attack chain from email compromise to endpoint breach. KQL Query Here are representative Kusto queries for common phishing scenarios (adapt table/field names as needed): Malicious URL Click Detection: Identify users who clicked known-malicious URLs. For example, join TAP click logs to TI indicators:This flags any permitted click where the URL matches a known threat indicator. Alternatively, aggregate by domain: let TI = ThreatIntelligenceIndicator | where Active == true and _EntityType == "URL"; ProofPointTAPClicksPermittedV2_CL | where url_s != "" | project ClickTime=TimeGenerated, Recipient=recipient_s, URL=url_s, SenderIP=senderIP_s | join kind=inner TI on $left.URL == TI._Value | project ClickTime, Recipient, URL, Description=TI.Description This flags any permitted click where the URL matches a known threat indicator. Alternatively, aggregate by domain: ProofPointTAPClicksPermittedV2_CL | extend clickedDomain = extract(@"https?://([^/]+)", 1, url_s) | summarize ClickCount=count() by clickedDomain | where clickedDomain has "maliciousdomain.com" or clickedDomain has "phish.example.com" Quarantine Spike (Burst) Detection: Detect sudden spikes in quarantined messages. For example, using POD mail log:This finds hours with an unusually high number of held (quarantined) emails, which may indicate a phishing campaign. You could similarly use ProofPointTAPMessagesBlockedV2_CL. ProofpointPODMailLog_CL | where action_s == "Held" | summarize HeldCount=count() by bin(TimeGenerated, 1h) | order by TimeGenerated desc | where HeldCount > 100 Targeted User Phishing: Find if a specific user received multiple malicious emails. E.g., for user email address removed for privacy reasons:This lists recent phish attempts targeting Username. You might also join with TAP click logs to see if she clicked anything. ProofpointPODMessage_CL | where recipient has "email address removed for privacy reasons" | where array_length(threatsInfoMap) > 0 and threatsInfoMap_classification_s == "Phish" | project TimeGenerated, sender_s, subject_s, threat=threatsInfoMap_threat_s Campaign-Level Analysis: Group emails by Proofpoint campaign ID to see scope of each campaign:This shows each campaign ID with how many unique recipients were hit and one example subject. Combining TAP and POD tables on GUID_s or QID_s can further link click events back to the originating message/campaign. ProofpointPODMessage_CL | mv-expand threatsInfoMap | summarize Recipients=make_set(recipient), Count=dcount(recipient) by CampaignID=threatsInfoMap_campaignId_s | project CampaignID, RecipientCount=Count, Recipients, SampleSubject=any(subject_s) Each query can be refined (for instance, filtering only within a recent time window) and embedded in Sentinel Analytics rules or hunting. The key is using the connectors’ fields – URLs, sender/recipient addresses, campaign IDs – to pivot between email data and other security signals.2.4KViews8likes1CommentSmartScreen reputation issue for EV Code Signed Windows application
Hello Microsoft Defender Threat Intelligence Team, We are the developer of a legitimate Windows desktop application called "ShangJing". Recently, our users reported that Microsoft Defender SmartScreen displays the following warning when downloading and launching our application: "Microsoft Defender SmartScreen can't verify this file is safe." The application is not malicious and has been digitally signed with a GlobalSign EV Code Signing Certificate. Application information: Product Name: ShangJing Publisher: Zhaoyi Information Technology (Shanghai) Co., Ltd. Certificate: GlobalSign EV Code Signing Certificate File: 尚镜_2.0.0_platinum_setup.exe Issue: Users receive SmartScreen reputation warning when downloading our application. We have already submitted the file through Microsoft Security Intelligence submission portal 7 days ago, but we have not received any update yet. Submission ID: 0c015296-b9cf-4130-9eaf-fc59cd145370 The file is distributed through our official website: https://www.changine.cn/downloads We would like to understand: 1. Is this caused by insufficient SmartScreen reputation for a newly released binary? 2. Is there any additional verification required from the software publisher side? 3. How can we ensure our legitimate application gains proper SmartScreen reputation? Our application is widely used for live streaming and camera-related workflows. It does not contain any malicious behavior. We would appreciate any guidance from the Microsoft team. Thank you.509Views1like3Comments
Need information on generating sample events for Threat Intelligence" (both duplicate posts)
Two things are tripping this up, and they're common mix-ups: First — Attack Simulation Training doesn't generate Threat Intelligence events. If you used the built-in phishing simulator, its logs only show up under Email & collaboration → Attack simulation training → Simulations — they're intentionally excluded from real Threat Intelligence telemetry. That's likely why nothing's showing up even though you ran a campaign. Second — your EICAR test should actually work, but check the right place: not the generic Office 365 Management Activity API's AuditLogRecordType page in isolation — go specifically to the RecordType values used for Defender for Office 365 threat events: 28 = ThreatIntelligence (phishing/malware events) 41 = ThreatIntelligenceUrl (Safe Links time-of-click/block events) Plus ThreatIntelligenceAtpContent, ThreatFinder, MSTIC To reliably generate one: Confirm Purview audit logging is enabled for the tenant first — if it isn't, nothing downstream gets logged regardless of what you trigger. From an external mailbox, send a test user the EICAR string as a .txt attachment (exact 68-byte string, see Microsoft's anti-malware testing doc). Defender for Office 365 should detect and quarantine it. Verify it landed first in the portal UI: Email & collaboration → Explorer → Malware tab — if it's there, the underlying ThreatIntelligence record exists and the Management API call should return it (allow a short delay; these aren't instant). For the Safe Links side, send a known-safe-but-flagged test URL (Microsoft publishes test URLs for this) to trigger ThreatIntelligenceUrl. If it shows up in Explorer but still doesn't appear via the Management API, that's usually an API subscription/permission issue (you need an active subscription to the DLP.All or relevant Office 365 Management API content type, not just Graph permissions) — worth checking separately from the detection side.250Views0likes0Comments