sustainability
3 Topics
Flexible Cooling for AI Growth: How Zonal Architecture Supports Diverse Hardware Needs
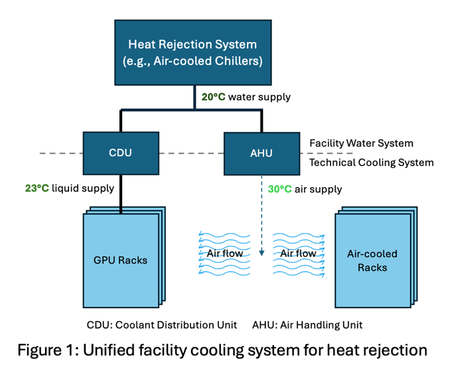
By: Ricardo Bianchini, Steve Solomon, Brijesh Warrier, Martin Herbert, Jay Jochim, Husam Alissa, Pulkit Misra, Eric Peterson and Cam Turner Context - Microsoft is pioneering zonal cooling in its next-generation AI datacenters, enabling flexible, performant, efficient, and sustainable thermal management for diverse workloads. The unprecedented growth of artificial intelligence (AI) is transforming datacenter infrastructure. Modern facilities must now support a diverse array of IT equipment, each with distinct cooling requirements. For example, modern GPUs and other AI accelerators require liquid cooling as air cooling is impractical at power draws exceeding 1 kW per accelerator due to the limited heat capacity of air to remove the resulting thermal load. Meanwhile, non-AI-accelerator (i.e., general-purpose) hardware deployments such as CPU-based compute, storage, and networking are expected to mostly remain air-cooled for the foreseeable future. Furthermore, liquid cooling offers a significant efficiency advantage: its superior heat dissipation allows coolant supply temperatures at the chip as high as 45°C without sacrificing peak performance. In contrast, air-cooled equipment requires much lower supply temperatures—around 30 °C—for optimal efficiency. The divergence in hardware cooling requirements creates a complex landscape that demands a strategy that is both flexible and adaptive. As shown in Figure 1, relying on a unified facility water system (FWS) introduces major inefficiencies. For example, liquid-cooled GPU racks may receive coolant below their required operating temperature when served by a single-temperature loop. This inefficiency becomes even more pronounced as the proportion of liquid- to air-cooled equipment increases (e.g., 90:10 liquid-to-air ratio for NVIDIA GB300 servers) since a larger share of the equipment is unnecessarily overcooled. Beyond operational efficiency, sustainability is a key priority for Microsoft even as we grow our AI infrastructure. Among our sustainability commitments, Microsoft has set goals to become carbon negative and eliminate water evaporation as a cooling method in its next-generation datacenters. A key lever for reducing carbon emissions is improving PUE (Power Usage Effectiveness, i.e., total power divided by IT power), a standard measure of datacenter power and energy efficiency. Achieving this requires dynamically matching cooling delivery to the specific needs of each equipment type, ensuring optimal performance, reduced energy consumption, and enhanced sustainability. Zonal Cooling: Flexible by Design Zonal cooling is a facility design that introduces multiple independent water loops, each supplying coolant at different temperatures. Figure 2 illustrates a specific implementation of the zonal concept with two facility-level zones: one loop serves air-cooled equipment, maintaining lower temperatures for human comfort and general-purpose hardware, and the other loop caters to liquid-cooled IT AI accelerators, which can operate efficiently at higher supply temperatures. This separation enables datacenter operators to precisely match cooling supply to the requirements of each zone, avoiding the inefficiency of over-cooling all equipment to the lowest common denominator. A key strength of zonal cooling is its flexibility. As new generations of IT hardware emerge, with varying thermal profiles, zonal cooling allows datacenters to adapt without major infrastructure overhauls. For example, future AI accelerators may need different liquid temperature ranges (see 30℃ Coolant - A Durable Roadmap for the Future) or technological improvements, such as microfluidics, may enable operating at even higher coolant temperatures, while general-purpose equipment requirements may remain unchanged. Zonal cooling’s architecture supports these changes by enabling operators to adjust loop temperatures and reconfigure cooling assignments as needed. Forms of Zonal Cooling Liquid cooling expands the allowable coolant supply temperature range and enables temperature-specific zones. This zonal approach can be applied at multiple layers: Facility-level: Two distinct temperature zones within a datacenter—one for air-cooled equipment and another for liquid-cooled equipment. Row-level: Tailor coolant temperature for each row based on deployed hardware (e.g., general-purpose vs GPU servers). Rack-level: Enable multiple temperature zones within a single rack for fine-grained optimization across servers. Chip-level: Apply zonal cooling inside the server. For example, use colder coolant for a GPU’s high-bandwidth memory (HBM) while supplying warmer coolant for the SoC and CPUs. This fine-grained approach can enable higher HBM stacking for improved performance, while avoiding unnecessary cooling overhead. Microsoft is building facility-level zonal cooling in the next generation of its AI datacenters going live in 2028 and beyond, while exploring the other three approaches in the lab. Facility-level zonal cooling is expected to reduce PUEs by up to 10%. Benefits from Zonal Cooling Zonal cooling is a strategic enabler for performance and efficiency. It can deliver: Improved energy efficiency and sustainability: By reducing the load on datacenter cooling infrastructure, zonal cooling improves energy efficiency as captured by annualized PUE, which measures average efficiency across all operating conditions. Lower annualized PUE means energy savings and lower carbon emissions. Increased server density: Tailored zonal cooling reduces peak cooling power demand during the hottest days, which in turn lowers peak PUE. Designers can leverage this reduction to reserve power for lower water temperatures (anticipating future accelerator needs), add more servers within the same utility power envelope, or contract less utility power per datacenter. Higher performance: Strategic control of coolant temperatures unlocks higher chip performance without sacrificing efficiency. For example, colder loops allow GPUs and CPUs to sustain elevated clock speeds via safe overclocking, while optimized memory cooling supports greater stacking density and increased bandwidth. Improved flexibility: With independent zones, operators can easily adjust coolant supply temperatures or reconfigure zones as new generations of hardware with varied cooling requirements emerge. This flexibility ensures compatibility with future innovations while maintaining optimal performance. Looking Ahead Zonal cooling represents a paradigm shift in datacenter thermal management. Its flexible, zone-specific approach to cooling air- and liquid-cooled IT equipment positions datacenters to efficiently adapt to future hardware innovations and workload diversity. As the industry continues to push boundaries in performance and sustainability, zonal cooling will be a foundational strategy for building performance and efficient infrastructure that meets tomorrow’s challenges.2.5KViews4likes1CommentDesigning Reliable Health Check Endpoints for IIS Behind Azure Application Gateway
Why Health Probes Matter in Azure Application Gateway Azure Application Gateway relies entirely on health probes to determine whether backend instances should receive traffic. If a probe: Receives a non‑200 response Times out Gets redirected Requires authentication …the backend is marked Unhealthy, and traffic is stopped—resulting in user-facing errors. A healthy IIS application does not automatically mean a healthy Application Gateway backend. Failure Flow: How a Misconfigured Health Probe Leads to 502 Errors One of the most confusing scenarios teams encounter is when the IIS application is running correctly, yet users intermittently receive 502 Bad Gateway errors. This typically happens when health probes fail, causing Azure Application Gateway to mark backend instances as Unhealthy and stop routing traffic to them. The following diagram illustrates this failure flow. Failure Flow Diagram (Probe Fails → Backend Unhealthy → 502) Key takeaway: Most 502 errors behind Azure Application Gateway are not application failures—they are health probe failures. What’s Happening Here? Azure Application Gateway periodically sends health probes to backend IIS instances. If the probe endpoint: o Redirects to /login o Requires authentication o Returns 401 / 403 / 302 o Times out the probe is considered failed. After consecutive failures, the backend instance is marked Unhealthy. Application Gateway stops forwarding traffic to unhealthy backends. If all backend instances are unhealthy, every client request results in a 502 Bad Gateway—even though IIS itself may still be running. This is why a dedicated, lightweight, unauthenticated health endpoint is critical for production stability. Common Health Probe Pitfalls with IIS Before designing a solution, let’s look at what commonly goes wrong. 1. Probing the Root Path (/) Many IIS applications: Redirect / → /login Require authentication Return 401 / 302 / 403 Application Gateway expects a clean 200 OK, not redirects or auth challenges. 2. Authentication-Enabled Endpoints Health probes do not support authentication headers. If your app enforces: Windows Authentication OAuth / JWT Client certificates …the probe will fail. 3. Slow or Heavy Endpoints Probing a controller that: Calls a database Performs startup checks Loads configuration can cause intermittent failures, especially under load. 4. Certificate and Host Header Mismatch TLS-enabled backends may fail probes due to: Missing Host header Incorrect SNI configuration Certificate CN mismatch Design Principles for a Reliable IIS Health Endpoint A good health check endpoint should be: Lightweight Anonymous Fast (< 100 ms) Always return HTTP 200 Independent of business logic Client Browser | | HTTPS (Public DNS) v +-------------------------------------------------+ | Azure Application Gateway (v2) | | - HTTPS Listener | | - SSL Certificate | | - Custom Health Probe (/health) | +-------------------------------------------------+ | | HTTPS (SNI + Host Header) v +-------------------------------------------------------------------+ | IIS Backend VM | | | | Site Bindings: | | - HTTPS : app.domain.com | | | | Endpoints: | | - /health (Anonymous, Static, 200 OK) | | - /login (Authenticated) | | | +-------------------------------------------------------------------+ Azure Application Gateway health probe architecture for IIS backends using a dedicated /health endpoint. Azure Application Gateway continuously probes a dedicated /health endpoint on each IIS backend instance. The health endpoint is designed to return a fast, unauthenticated 200 OK response, allowing Application Gateway to reliably determine backend health while keeping application endpoints secure. Step 1: Create a Dedicated Health Endpoint Recommended Path 1 /health This endpoint should: Bypass authentication Avoid redirects Avoid database calls Example: Simple IIS Health Page Create a static file: 1 C:\inetpub\wwwroot\website\health\index.html Static Fast Zero dependencies Step 2: Exclude the Health Endpoint from Authentication If your IIS site uses authentication, explicitly allow anonymous access to /health. web.config Example 1 <location path="health"> 2 <system.webServer> 3 <security> 4 <authentication> 5 <anonymousAuthentication enabled="true" /> 6 <windowsAuthentication enabled="false" /> 7 </authentication> 8 </security> 9 </system.webServer> 10 </location> ⚠️ This ensures probes succeed even if the rest of the site is secured. Step 3: Configure Azure Application Gateway Health Probe Recommended Probe Settings Setting Value Protocol HTTPS Path /health Interval 30 seconds Timeout 30 seconds Unhealthy threshold 3 Pick host name from backend Enabled Why “Pick host name from backend” matters This ensures: Correct Host header Proper certificate validation Avoids TLS handshake failures Step 4: Validate Health Probe Behavior From Application Gateway Navigate to Backend health Ensure status shows Healthy Confirm response code = 200 From the IIS VM 1 Invoke-WebRequest https://your-app-domain/health Expected: 1 StatusCode : 200 Troubleshooting Common Failures Probe shows Unhealthy but app works ✔ Check authentication rules ✔ Verify /health does not redirect ✔ Confirm HTTP 200 response TLS or certificate errors ✔ Ensure certificate CN matches backend domain ✔ Enable “Pick host name from backend” ✔ Validate certificate is bound in IIS Intermittent failures ✔ Reduce probe complexity ✔ Avoid DB or service calls ✔ Use static content Production Best Practices Use separate health endpoints per application Never reuse business endpoints for probes Monitor probe failures as early warning signs Test probes after every deployment Keep health endpoints simple and boring Final Thoughts A reliable health check endpoint is not optional when running IIS behind Azure Application Gateway—it is a core part of application availability. By designing a dedicated, authentication‑free, lightweight health endpoint, you can eliminate a large class of false outages and significantly improve platform stability. If you’re migrating IIS applications to Azure or troubleshooting unexplained Application Gateway failures, start with your health probe—it’s often the silent culprit.453Views0likes0Comments
Beyond the Canvas: The Azure Architecture Diagram Builder Becomes Agent-Ready
AZURE ARCHITECTURE BLOG · 8 MIN READ Author: Arturo Quiroga, Senior Partner Solutions Architect — Microsoft Two months ago I published From Prompt to Production: Building Azure Architecture Diagrams with AI, introducing the open-source Azure Architecture Diagram Builder. The response was humbling — thousands of you read it, tried the tool, and filed issues and feature requests. A follow-up on how the Well-Architected Framework scoring works went deep on validation. You asked, and the tool grew. This post is about what’s new since May — and one change big enough to reframe the whole project: the Azure Architecture Diagram Builder is no longer just an app you click. It’s a partner you chat with, and a tool other agents can call. TL;DR. Three arcs of new capability: (1) Architecture Chat turns diagram design into a multi-turn conversation over the live canvas; (2) Blueprint Diagrams produce hand-drawn, whiteboard-style deliverables alongside the formal topology; and (3) the app now exposes its capabilities as a Model Context Protocol (MCP) server, so AI agents can generate, validate, cost, and render Azure architectures programmatically. Plus a 13-model fleet, deployment guides grounded in Microsoft Learn, and July output enhancements. What’s new at a glance Capability What it does Architecture Chat Refine a diagram by conversation — “add Front Door with WAF,” then“now make it zone-redundant.” Each turn reads the live canvas and auto-saves to history. Blueprint Diagrams (BETA) Hand-drawn, whiteboard-style renders with nested zones and numbered flow arrows. Topology, Blueprint, or Both. A fleet of 13 models Multi-provider roster — GPT-5.x, DeepSeek, Grok, Mistral, and Kimi — with side-by-side comparison to pick the right brain per task. MCP server The app is now a remote MCP server. Agents can list_services, validate_architecture, estimate_costs, generate_bicep and render_diagram with typed, structured outputs. Microsoft Learn grounding Deployment guides now cite live Microsoft Learn documentation. Output enhancements (July 2026) Cost badges, light/dark render themes, and metadata panels in rendered diagrams. From clicking to conversing: Architecture Chat The single most common request after the launch post was some version of “I love the first diagram, but I want to iterate without re-writing the whole prompt.” Regenerating from scratch every time you tweak a requirement is slow and loses context. Architecture Chat solves this. It’s a conversational panel that sits alongside the canvas and treats your diagram as a living document. Each message is a turn in an ongoing design session: “Add an Azure Front Door with WAF in front of the app tier.” “Now make the data layer zone-redundant.” “Swap the SQL Database for Cosmos DB and update the connections.” Every turn reads the current state of the canvas — not the original prompt — so refinements compound naturally the way they would with a human architect at a whiteboard. The conversation auto-saves to history, so you can step back through the evolution of a design or branch from an earlier point. Architecture Chat panel beside the canvas, showing a multi-turn conversation that incrementally adds and modifies services on the diagram. Figure 1. Architecture Chat treats the diagram as a living document. Each message refines the current canvas — adding services, changing SKUs, or reorganizing groups — and the full exchange is saved to history. The shift is subtle but important: architecture design stops being a one-shot prompt and becomes an iterative dialogue. The whiteboard deliverable: Blueprint Diagrams (BETA) Formal topology diagrams with official Azure icons are perfect for documentation and stakeholder decks. But early-stage design conversations often want something looser — the hand-drawn feel of a whiteboard sketch that communicates intent without implying finality. Blueprint Diagrams generate exactly that: a whiteboard-style render with nested zones (subscription → VNet → subnet), numbered flow arrows, and a deliberately sketchy aesthetic. You choose the output mode: Topology — the formal, icon-based diagram from the launch post Blueprint — the hand-drawn whiteboard style Both — generate the two side by side The formal topology diagram of an architecture shown next to a Blueprint-style hand-drawn version of the same design with nested zones and numbered flow arrows. Figure 2. The same architecture in two visual languages. Left: the formal, icon-based topology. Right: Blueprint mode — a whiteboard-style render with nested zones and numbered flow steps, plus a numbered legend explaining each hop. Use Blueprint for early design conversations and Topology for final documentation. It’s the same underlying architecture — two visual languages for two different moments in the design lifecycle. A fleet of 13 models: pick the right brain per task The launch post shipped with multi-model support. That fleet has grown to 13 models across five providers, so you can match the model to the job — fast models for iteration, reasoning models for complex designs, code-optimized models for Bicep generation: OpenAI GPT-5.x — GPT-5.1, GPT-5.2, GPT-5.2 Codex, GPT-5.3 Codex, GPT-5.4, GPT-5.4 Mini DeepSeek — V3.2 Speciale, V4 Pro xAI Grok — 4.1 Fast, 4.3 Mistral — Large 3 MoonshotAI Kimi — K2.5, K2.7 Code The Compare Models feature runs the same prompt through any subset of these in parallel and ranks them on service count, token usage, latency, and cost — with Fastest / Cheapest / Most Thorough badges — so you can make an evidence-based choice rather than a guess. Compare Models results grid showing side-by-side metrics across all 13 models with Fastest, Cheapest, and Most Thorough badges. AI Critique panel with an overall ranking and per-model analysis generated by a critic model. Figure 3. Multi-model comparison across the full 13-model fleet. Top: the results grid ranks every model on service count, connections, token usage, latency, and cost, with Fastest / Cheapest / Most Thorough badges. Bottom: an optional AI Critique uses a critic model to rank the outputs and explain each model’s strengths and gaps. Adding a model is now a small, well-understood change — a testament to how the multi-provider abstraction has matured since May. The headline: the Diagram Builder is now an MCP server Here’s the change that reframes the project. Everything above is about a person using a web app. But the same capabilities — generating a diagram, validating it against WAF, estimating its cost, producing Bicep — are exactly the things an AI agent needs when it reasons about Azure architecture. So we exposed them. The Azure Architecture Diagram Builder now runs as a Model Context Protocol (MCP) server. Any MCP-capable agent can call its tools with typed inputs and structured outputs: Tool What the agent gets list_services The catalog of supported Azure services and categories validate_architecture A WAF assessment with pillar scores and findings estimate_costs Multi-region cost estimates from the Azure Retail Prices API generate_bicep Infrastructure-as-Code templates for the design render_diagram A rendered diagram (topology or blueprint) of the architecture This means an agent can hold a conversation like “design a HIPAA-compliant platform, check it against the Well-Architected Framework, tell me the monthly cost in West Europe, and give me the Bicep” — and the Diagram Builder answers each part programmatically, returning structured data the agent can reason over and chain. Microsoft Scout invoking the Diagram Builder’s render_diagram MCP tool, showing the tool-call parameters and saving the generated SVG to the workspace. The Azure architecture diagram rendered by the MCP tool and displayed inline in the Microsoft Scout conversation. Figure 4. The Diagram Builder as an MCP server inside Microsoft Scout. Top: from a natural-language request, the agent calls the render_diagram tool with structured parameters (title, format, direction, theme, region) and saves the returned SVG to its workspace. Bottom: the rendered architecture — grouped zones, labeled flows, and cost badges — appears inline in the conversation, generated entirely through agent tool calls. The tool that started as a canvas for humans is now also a building block for agents. That’s the arc: from an app you click, to a partner you chat with, to a tool other agents call. Grounded in Microsoft Learn, and sharper output Two smaller-but-meaningful improvements round out the release: Microsoft Learn grounding. Deployment guides now search official Microsoft Learn documentation at generation time and cite it, so the guidance reflects current, authoritative practice rather than a model’s training snapshot. Output enhancements (July 2026). Rendered diagrams now carry per-service cost badges, support light and dark render themes, and include metadata panels that summarize the architecture — service counts, regions, and estimated cost — directly on the image. Highlights Since the May launch, the Azure Architecture Diagram Builder has grown from a design tool into an agent-ready platform: Conversational design: iterate on a diagram by chatting over the live canvas, with full history Two visual languages: formal topology and hand-drawn Blueprint, from the same architecture 13 models, five providers: choose the right brain per task, with evidence-based comparison Agent-ready: an MCP server exposing generation, validation, costing, and IaC as callable tools Grounded guidance: deployment guides cite live Microsoft Learn documentation Still open source: every capability above is available to inspect, extend, and contribute to Try It Today Live demo: https://aka.ms/diagram-builder Source code: GitHub repository Documentation: See the Getting Started Guide for setup, and the repository’s MCP server directory for agent integration. If you read the first post and tried the tool — thank you. The features above exist because you told me what you needed. Keep the feedback coming via GitHub Issues. Tags: artificial intelligence · application · apps & devops · well architected · infrastructure102Views0likes0Comments