resources
95 TopicsAzure Verified Modules (AVM) is now owned by Azure engineering
Azure Verified Modules (AVM) has moved into the Azure Deployments team, inside Microsoft’s Azure engineering organization. That is the headline, and it is a big one for us. AVM started as a community-led project inside Microsoft, built and maintained largely by people who cared about it alongside their day jobs in various roles and teams across Microsoft. It is now owned by an engineering team, with dedicated engineers working on it every day; as well as those who helped make AVM what it is today. I want to be clear about what that does and does not mean, because I know the questions this raises. AVM is still open source. The repositories, specifications, the contribution model and the way you consume modules from the public registries are all unchanged. What has changed is the level of investment behind it, and how sustainable we can make it. In short: Microsoft has increased its investment in AVM. It has moved from a community-led project into Azure engineering, with dedicated engineering resources behind it. It stays open-source. On the back of that, we are updating the support statement and introducing a three-tier module ownership model at the start of 2027 (more on these below). This blog post has a lot of content, please take the time to read it all but feel free to use the table of contents below to help you navigate it. If AVM is new to you AVM is the Microsoft standard for Infrastructure as Code (IaC) modules for Azure, in both Bicep and Terraform. Every module is built to the same published specification, passes the same continuous integration (CI) tests, and is published to the official public Bicep and Terraform registries. The idea is simple: you should not have to write the same Azure IaC code again, and you should be able to trust what you pick up. There is a lot more detail at aka.ms/AVM. And if you would rather watch than read, Jared Holgate and I covered AVM in our recent Azure Infra Summit session: watch the recording on YouTube. What the move lets us fix: our support statement Today, the AVM support statement includes day-based targets for responses and fixes. We have not met them consistently, and that does not give you clear or reliable expectations. We are removing those targets and aligning with the support model used by Azure CLI, Azure PowerShell, Bicep, AzAPI, and the AzureRM Terraform provider. The move into Azure engineering is the important part. Dedicated engineers will maintain modules directly and improve the tooling, automation, and framework used by all module owners. That is a stronger commitment than any fixed target we cannot reliably meet. It also lets us be clearer about who maintains each module. Right now, every AVM module is treated identically, and that is not sustainable. So, we are introducing module tiering. Introducing module tiering Right now, every AVM module is treated identically. That is not sustainable. A resource group module needs almost no attention. A storage account or virtual machine module needs constant work as the underlying service evolves. So, today we are introducing two tiers (and thinking about a third) based on who owns and maintains a module: Tier Owned by What it means Tier 1 (Core) The AVM engineering team Modules are owned directly by the AVM team inside Azure engineering. These are the ones we maintain as our day job alongside the AVM specifications and framework Tier 2 (Maintained) Any Microsoft employee (FTE) Modules are owned by any Microsoft full-time employee or team/s. It also includes other Azure engineering teams owning the modules for their own services. This is the model we have today, and it is not going away. Tier 3 (Open-Source) * being considered for future * Vetted external owners (future) An idea, not a commitment. It would let trusted external parties such as Microsoft MVPs and accredited partners own modules. We will not look at this until the 2nd half of calendar year 2027. One thing that will not change: the bar. Every module in every tier is built to the same AVM specification and passes the same CI checks. Tiering describes who is behind a module, not its quality. Ownership also stays aligned across languages if in Tier 1. If we own a module in Tier 1, we own it in both Bicep and Terraform. Why we are not publishing the module tiering list yet We want to know our real maintenance capacity before we commit. We are spending the rest of 2026 reducing toil and clearing the backlog. This work will show how many modules we can maintain. We would rather publish a list that we can sustain than change it soon after publication. Publishing a list will also focus attention on excluded modules. We want clear evidence before those discussions start. For context, our draft puts about 50 resource modules in Tier 1, across Bicep and Terraform. Current telemetry suggests these modules represent about 85 percent of AVM module deployments. Usage is one input. Critical services and other factors also matter. We will validate the draft before making a public commitment. Distributed ownership is still the point AVM has always run on decentralized ownership and moving into engineering does not change that. If anything, it should help. Being inside Azure engineering puts us much closer to the product teams who build the services, and getting more of those teams to own the modules for their own service has been a goal from day one. That is already happening. With the recent transition of Azure Landing Zones (ALZ), the Azure Migrate team now maintain the ALZ modules and the subscription vending modules in AVM. Those sit in Tier 2, but they are maintained by a dedicated engineering team. Tier 2 is not a lesser tier, it is a broader one. However, if they currently own a resource module that will be included in Tier 1, they are still welcome to be involved in its ownership alongside the AVM engineering team, but we would also encourage them to own a module outside of Tier 1 so we have an owner on as many modules as possible. But all of this will be dealt with when we implement the tiering structure in early 2027. Tier 2 ownership remains open to Microsoft employees and teams. The AVM engineering team will support those owners through improved tooling, automation, and the AVM framework. We will confirm ownership changes when we implement module tiering in early 2027. Come and meet the team (AVM Community Call) Rather than list names on a page, we would rather you meet the people. Join our next AVM community call, where the new engineering team looking after AVM will introduce themselves and take your questions. If you want to know who is behind AVM now, or discuss anything in this post, this will be the place to do it, and we can’t wait to see you all there! Next community call: Monday 26th October 2026 @ 16:00 UK | 12:00 EDT | 09:00 PDT | 21:30 IST | 03:00 AEDT This call will be streamed to YouTube live so use the "Set reminder" / "Notify Me" options on YouTube and also put an entry in your calendar to remind you. This means it will automatically be recorded and published live once finished as well 👍 YouTube Live Link: aka.ms/AVM/CommunityCall GitHub Issue Link: AVM Community Call - October 2026 · Issue #3079 · Azure/Azure-Verified-Modules - please add a comment for any topics or discussions you'd like covered Everyone is welcome whether you contribute to AVM or just use it. We want to welcome you for an insight into our roadmap over the next 6 months as well as an open discussion with you all. What happens next We update the published module support statement and remove the day-based response targets. The team keeps burning down issues and pull requests and keeps reducing the manual toil in our CI. We validate our maintenance run rate through the end of calendar year 2026. We publish the initial tier classifications once we can stand behind them. We revisit Tier 3, including the legal and intellectual property questions, in 2027. AVM got here because customers, partners and contributors backed it and used it in anger. That has not changed, and neither has our need for your input. If you think we are getting this wrong, tell us in GitHub Discussions. Candidly, the feedback we get on this will shape how we land it. And finally, thank you to everyone who built this AVM exists because many people put real work into it, often alongside their day jobs. Matt White, Charlie Grabiaud, Mate Barabas, Pankaj Meshram, were some of AVM’s key founders and helped shape the project during its early days that are no longer involved in AVM day-to-day. Jared Holgate, Alexander Sehr, Erika Gressi, Kris Baranek, Sebastian Graf, Rene Hezser and Chris Sidebotham remain involved today helping develop and maintain the AVM framework and specifications with the engineering team. Some contributors have moved to other roles, teams, or companies. Many continue through issues, pull requests, community calls, and module ownership and contributions. Every contribution helped AVM reach this point and continue to drive it forward today. The move into Azure engineering adds dedicated investment. It does not replace the community that built and sustained AVM. To every past and present contributor and module owner: thank you for your time, commitment, and belief in AVM. Thanks, Jack and the AVM team.1.4KViews2likes0Comments
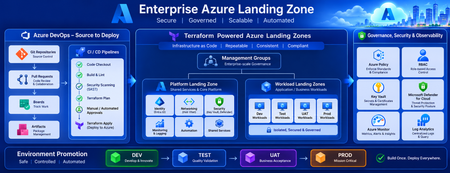
Building a Fully Automated Azure Landing Zone Deployment Using Azure DevOps and Terraform
Discover how to build a fully automated Azure Landing Zone using Azure DevOps and Terraform. This article walks through real-world Git workflows, CI/CD automation, environment promotion strategies, and governance integration to create secure, scalable, and enterprise-ready Azure environments.1.4KViews1like0CommentsGitHub Copilot App - Canvas Is Not a UI Builder
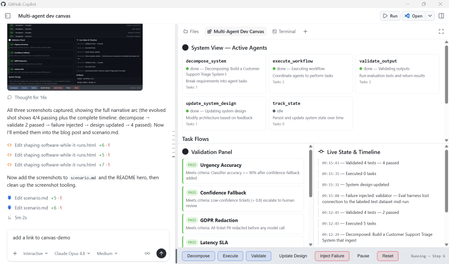
What if your development environment didn't just help you write code, but helped you observe, steer, and evolve a living system while it runs? That's the shift GitHub Copilot App Canvas represents. Canvas redefines how developers interact with agent-driven software: not by building traditional user interfaces, but by creating interactive environments where humans and AI co-create, test, and iterate in real time. This post walks through a real Canvas extension we built, a Multi-Agent Dev Canvas that demonstrates how Canvas becomes a runtime observability and control plane for an agent-driven system. We'll cover why Canvas exists, how it differs from traditional UI development, and how you can use it to accelerate the design-test-evolve loop for any multi-agent application. The Misconception: "Canvas Is for Building UIs" The first instinct many developers have when they see Canvas is to treat it like a UI framework, a place to build dashboards, boards, or user-facing applications. That's not what Canvas is for. Here's the distinction that matters: Traditional UIs are for using software. They serve end-users who interact with a finished product. Canvas is for shaping software while it runs. It serves developers and AI agents who are actively building, testing, and evolving a system. Canvas solves problems your final UI should never try to solve in a visible way. It's the observability layer, the control plane, the validation surface — all the things you need during development that disappear before production. Think of it this way: you wouldn't ship your debugger to users, but you absolutely need it while building. What We Built: A Multi-Agent Dev Canvas To demonstrate Canvas as a development runtime, we built a Multi-Agent Dev Canvas, a standalone GitHub Copilot Canvas extension (this repo, copilot-canvas-runtime) that treats an entire multi-agent system as a living, observable environment. The same pattern applies to any agent-driven system built on services such as Microsoft Foundry. The Multi-Agent Dev Canvas: a runtime observability and control plane where developers and AI agents collaborate to design, test, and evolve an agent-driven system in real time. The canvas provides four integrated panels: System View: See Your Agents Working Five specialised agents are displayed as live cards with real-time status indicators. Each card shows the agent's name, responsibility, current status (idle, running, done, or error), task count, and last action taken. When an agent is active, its card pulses blue. When it fails, it glows red. You see the system breathe. decompose_system — Breaks requirements into agent tasks execute_workflow — Coordinates agents to perform tasks validate_output — Runs evaluation tests and returns structured results update_system_design — Modifies architecture based on feedback track_state — Persists and updates system state over time Task Flows: Watch Work Move Through the Pipeline Below the agents, a flow graph visualises how tasks route between agents. When you decompose a system requirement like "Build an AI-powered code review agent," the canvas shows five components (pr-ingestion, code-analysis, feedback-generator, learning-loop, notification-service) flowing from the decomposer to the executor and designer agents. Each flow carries a status badge, pending, pass, or fail. Validation Panel: Continuous Testing, Not Afterthought Testing The validation panel displays structured test results with pass/fail badges and reasoning. When you run validation, each test case evaluates against specific criteria: ✅ "PR ingestion handles large diffs" — Meets criteria: process diffs over 5,000 lines without timeout ❌ "Feedback is actionable" — Failed: does not satisfy criteria that each suggestion includes a code fix ✅ "Learning loop converges" — Meets criteria: accept rate improves over 10 iterations ✅ "Notifications are non-blocking" — Meets criteria: delivery latency under 500ms This isn't a test runner you invoke separately, it's a validation surface embedded in the development loop. You see failures the moment they happen, in context, alongside the agents and flows that produced them. Live State Timeline: Every Mutation, Visible The right panel tracks every state change with timestamps. Decomposition events, workflow executions, validation runs, failure injections — all appear chronologically. This is the system's memory, visible to both the human developer and the AI agents working alongside them. Canvas as a Runtime: The Key Capabilities What makes Canvas a runtime rather than a display layer is that the agent can act through it. The canvas exposes seven agent-callable actions: Action What It Does decompose_system Accept requirements and components, generate task flows, update the system design execute_workflow Run pending tasks through the agent pipeline, produce artifacts validate_output Evaluate test cases against criteria, return structured pass/fail with reasoning update_system_design Modify the architecture description, constraints, or component list live track_state Read the full system state — agents, flows, validations, history, artifacts inject_failure Force an agent into an error state to test system adaptation pause_resume Toggle execution on and off The human developer can click Decompose, Execute, or Validate directly in the canvas. The AI agent can invoke the same actions programmatically. Both parties operate on the same surface, the same state, the same system, that's what makes Canvas collaborative in a way traditional tooling is not. Why This Matters: Canvas vs. Figma vs. Traditional UIs It helps to position Canvas against tools developers already know: Figma is Human-to-Human collaboration on design. Multiple people interact with the same visual surface, but nothing executes. It's a design tool. Traditional UIs are Human-to-System. Users interact with finished software through a polished interface. Canvas is Human-to-AI-to-System. It's a shared space where things actually execute. The developer steers, the AI acts, and the system evolves, all visible, all in real time. Canvas is collaborative in the Figma sense — it's a shared space, it's visual, multiple participants interact with the same surface. But unlike Figma, the participants include AI agents, and the surface isn't a mockup — it's a live system. How the Extension Works: Under the Hood A Canvas extension is a standard GitHub Copilot CLI extension, a single extension.mjs file that speaks JSON-RPC over stdio. The key components: 1. State Management Each canvas instance maintains its own system state: agents, task flows, validations, a state history timeline, artifacts, and the current system design. State is held in-memory per instance and pushed to the iframe via Server-Sent Events whenever it changes. function createInitialState() { return { agents: [ { id: "decomposer", name: "decompose_system", status: "idle", responsibility: "Break requirements into agent tasks" }, { id: "executor", name: "execute_workflow", status: "idle", responsibility: "Coordinate agents to perform tasks" }, // ... three more agents ], taskFlows: [], validations: [], stateHistory: [], artifacts: [], systemDesign: { description: "", constraints: [], components: [] }, execution: { paused: false, stepCount: 0 }, }; } 2. Real-Time Updates via Server-Sent Events The canvas runs a loopback HTTP server per instance. The iframe connects to an /events endpoint and receives state updates as they happen — no polling, no websocket complexity. if (req.url === "/events") { res.writeHead(200, { "Content-Type": "text/event-stream", "Cache-Control": "no-cache" }); clients.add(res); // Push current state immediately on connect res.write(`data: ${JSON.stringify(getState(instanceId))}\n\n`); } 3. Dual Interaction Model Every action is available through two paths. The human clicks a button in the iframe, which POSTs to the local server. The AI agent calls invoke_canvas_action through the SDK. Both paths mutate the same state and trigger the same SSE broadcast. Neither is privileged over the other. 4. Canvas Declaration The canvas registers with the Copilot SDK using createCanvas , declaring its identity, description, and all agent-callable actions with JSON Schema validation on inputs: createCanvas({ id: "multi-agent-dev", displayName: "Multi-Agent Dev Canvas", description: "Runtime observability and control plane for multi-agent development", actions: [ { name: "decompose_system", description: "Break requirements into agent tasks", inputSchema: { type: "object", properties: { requirements: { type: "string" }, components: { type: "array", items: { type: "string" } } }, required: ["requirements"] }, handler: async (ctx) => { /* ... */ }, }, // ... six more actions ], open: async (ctx) => { /* start server, return URL */ }, onClose: async (ctx) => { /* clean up */ }, }); Scenarios This Enables The Multi-Agent Dev Canvas supports four development scenarios that would be impossible with traditional tooling: 1. End-to-End Feature Design Tell the agent "Build an AI-powered code review system." Watch it decompose the requirement into five components, route tasks to specialist agents, execute the workflow, and validate the outputs, all visible in real time. Iterate by modifying constraints or components and re-running. 2. Live Agent Collaboration Observation See how agents hand off work to each other. The flow graph shows which agent produced what, which tasks are pending, and where bottlenecks form. This is the kind of observability you need when debugging multi-agent orchestration but would never expose in a production UI. 3. Fault Injection and Adaptation Testing Use inject_failure to force an agent into an error state. Watch how the system responds. Does the orchestrator recover? Do downstream tasks fail gracefully? This chaos-engineering approach, applied during development, visible in real time, catches integration failures before they reach production. 4. Validation-Driven Iteration Define test criteria, run validation, see which tests fail, update the system design, re-run. The validation panel isn't a separate CI pipeline, it's embedded in the development surface, creating a continuous feedback loop between design decisions and their measurable outcomes. Getting Started: Build Your Own Canvas Extension To create a Canvas extension in your own project: Read the SDK docs — Run extensions_manage({ operation: "guide" }) in GitHub Copilot CLI to get the canonical documentation paths. Scaffold — Run extensions_manage({ operation: "scaffold", kind: "canvas", name: "my-canvas", location: "project" }) to generate the boilerplate. Implement — Edit extension.mjs with your canvas logic: state model, actions, renderer HTML, and SSE updates. Reload — Run extensions_reload to activate your changes. Drive — Open with open_canvas , invoke actions with invoke_canvas_action , and iterate. The canvas extension lives in .github/extensions/your-canvas/extension.mjs for project-scoped extensions, or in your user extensions directory for personal use. No package.json needed, the github/copilot-sdk import is auto-resolved. Key Takeaways Canvas is a development runtime, not a UI framework. You don't build Canvas instead of your UI, you use Canvas to figure out, test, and evolve the UI and system before and during building it. Canvas solves problems your final UI should never expose. Agent observability, fault injection, live state mutation, validation feedback loops, these are development concerns, not user concerns. Canvas is Human-to-AI-to-System collaboration. Both the developer and the AI agent operate on the same surface, the same state, the same running system. It's Figma-like collaboration, but with AI agents, and things actually execute. Canvas turns debugging, testing, and execution into a continuous visual feedback loop. Instead of switching between an editor, a terminal, a test runner, and a monitoring dashboard, you have one surface where the system lives and evolves. Canvas extensions are lightweight. A single extension.mjs file, no dependencies, loopback HTTP server with SSE, the infrastructure gets out of the way so you can focus on the system you're building. The Bigger Picture Canvas redefines software development by shifting from writing static code to orchestrating living systems. Developers and AI co-create, observe, and evolve solutions in real time. Instead of building UIs for users, we build interactive environments for agents, turning debugging, testing, and execution into a continuous, visual feedback loop that accelerates innovation and brings ideas to production faster than ever. The Multi-Agent Dev Canvas we built here is one example. The pattern applies anywhere you're building agent-driven systems: AI orchestration, workflow automation, data pipelines, autonomous services. Anywhere you need to see, steer, and validate a complex system as it runs, that's where Canvas belongs. Resources copilot-canvas-runtime — this repository: the Multi-Agent Dev Canvas extension, scenario, and demo prompt GitHub Copilot Documentation — Official documentation for GitHub Copilot features Microsoft Foundry Documentation — Build and deploy AI agents with Microsoft Foundry1.4KViews0likes0CommentsMicrosoft Leads a New Era of Software Supply Chain Transparency
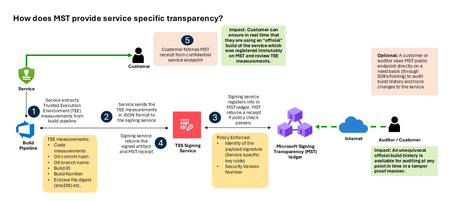
Microsoft announces the general availability of Microsoft’s Signing Transparency (MST) – a first-of-its-kind capability that brings unprecedented visibility and trust to our software supply chain. With this release, Microsoft is leading the industry by recording the build of critical cloud services into a publicly readable and verifiable SCITT standard (Supply Chain Integrity, Transparency, and Trust) compliant ledger. This means every production software build for in scope services like Azure Attestation and Azure Managed HSM (Hardware Security Module), Azure confidential ledger, Microsoft Signing Transparency itself (and others over time) – is now logged in an immutable, tamper-evident record. Only builds that are in the MST ledger are deployed to production; this gives customers confidence that the supply chain for these critical services can be audited at anytime. Notably, the MST ledger is fully open source and built to align with the emerging IETF SCITT standard. By embracing SCITT’s principles and open protocols, Microsoft ensures that MST not only secures our own ecosystem but also contributes to a broader industry movement toward standardized supply chain transparency. The open-source MST ledger serves as a verifiable trust anchor that any organization or researcher can inspect, audit, or even integrate with their own tooling. MST itself meets the highest levels of transparency, backed by a tamper-proof confidential ledger, open-source, and independently verified. Specifically, we are making the foundation of our trust model transparent and accessible to everyone – reinforcing that trust must be earned through proof, not just promises. This launch marks a major milestone in our commitment to Zero Trust principles, extending “never trust, always verify” all the way into the build itself. Building on a public preview introduced late last year, MST’s general availability delivers verifiable transparency at the software level. It transforms traditional code signing with an additive trust layer that is accessible via an open verification model. Every new software update is accompanied by a publicly auditable proof of integrity, enabling security teams to proactively confirm that each update is authentic and unaltered. To help organizations get the most out of this capability, we are also introducing a free tool to explore the contents – Ledger Explorer – an offline tool that allows security teams to examine MST ledger entries, verify cryptographic proofs, and even validate the ledger’s integrity independently. This tool, combined with MST’s open design, ensures that every Microsoft customer – and the broader community – can hold us accountable in real time for the software we run on their behalf. Key Benefits of Microsoft’s Signing Transparency (MST) Verified Code Integrity – Every software release is cryptographically logged in MST’s ledgers. This makes each build tamper-evident and traceable. If an attacker attempts to inject malicious code or sign an unauthorized update, it will be evident through the well-defined validation step built into the SCITT standard. Organizations gain the assurance that code integrity can be independently confirmed at any time. Independent Verification & Zero Trust – MST enables customers and auditors to verify software authenticity on their own, without having to solely rely on vendor attestations. For each update, Microsoft provides a transparency “receipt” (proof of logging) that you can use to prove the update was officially published and unaltered. This fosters a “don’t just trust, verify” approach, empowering security teams to double-check everything running in their environment aligns with what Microsoft intended. Audit-Trail & Compliance – The transparency ledger creates a permanent, auditable timeline of code deployments. Every entry is a record of what was released and when, backed by cryptographic proofs. This simplifies compliance reporting and accelerates forensic analysis. In the event of an incident, you can quickly audit the ledger to see if any unexpected code was introduced. For highly regulated industries, MST offers concrete evidence of software integrity and policy compliance over time. Leadership & Open Standards – We are delivering real transparency now, encouraging a future where all critical software is released with verifiable integrity. MST’s open source implementation and SCITT-compliant design exemplify our commitment to openness and collaboration. We believe widespread adoption of these standards will strengthen supply chain security for everyone, making trust verification a universal practice. Next Steps Microsoft’s Signing Transparency is more than a new security feature and shapes the advances in trust technology. As threats grow more sophisticated, we must evolve the way we assure our customers about the software they depend on. With MST now generally available, we are leading by example: proving that it is possible to open up the traditionally opaque process of software deployment and turn it into a source of strength and trust, i.e. empowering each person with verifiable transparency. We invite the industry to join us on this journey and get started by reading the documentation and exploring Ledger Explorer today! Together, by embracing transparency and open standards, we can turn “trust but verify” from a slogan into an everyday reality for digital infrastructure.1.2KViews0likes0CommentsLearn How to Build Smarter AI Agents with Microsoft’s MCP Resources Hub
If you've been curious about how to build your own AI agents that can talk to APIs, connect with tools like databases, or even follow documentation you're in the right place. Microsoft has created something called MCP, which stands for Model‑Context‑Protocol. And to help you learn it step by step, they’ve made an amazing MCP Resources Hub on GitHub. In this blog, I’ll Walk you through what MCP is, why it matters, and how to use this hub to get started, even if you're new to AI development. What is MCP (Model‑Context‑Protocol)? Think of MCP like a communication bridge between your AI model and the outside world. Normally, when we chat with AI (like ChatGPT), it only knows what’s in its training data. But with MCP, you can give your AI real-time context from: APIs Documents Databases Websites This makes your AI agent smarter and more useful just like a real developer who looks up things online, checks documentation, and queries databases. What’s Inside the MCP Resources Hub? The MCP Resources Hub is a collection of everything you need to learn MCP: Videos Blogs Code examples Here are some beginner-friendly videos that explain MCP: Title What You'll Learn VS Code Agent Mode Just Changed Everything See how VS Code and MCP build an app with AI connecting to a database and following docs. The Future of AI in VS Code Learn how MCP makes GitHub Copilot smarter with real-time tools. Build MCP Servers using Azure Functions Host your own MCP servers using Azure in C#, .NET, or TypeScript. Use APIs as Tools with MCP See how to use APIs as tools inside your AI agent. Blazor Chat App with MCP + Aspire Create a chat app powered by MCP in .NET Aspire Tip: Start with the VS Code videos if you’re just beginning. Blogs Deep Dives and How-To Guides Microsoft has also written blogs that explain MCP concepts in detail. Some of the best ones include: Build AI agent tools using remote MCP with Azure Functions: Learn how to deploy MCP servers remotely using Azure. Create an MCP Server with Azure AI Agent Service : Enables Developers to create an agent with Azure AI Agent Service and uses the model context protocol (MCP) for consumption of the agents in compatible clients (VS Code, Cursor, Claude Desktop). Vibe coding with GitHub Copilot: Agent mode and MCP support: MCP allows you to equip agent mode with the context and capabilities it needs to help you, like a USB port for intelligence. When you enter a chat prompt in agent mode within VS Code, the model can use different tools to handle tasks like understanding database schema or querying the web. Enhancing AI Integrations with MCP and Azure API Management Enhance AI integrations using MCP and Azure API Management Understanding and Mitigating Security Risks in MCP Implementations Overview of security risks and mitigation strategies for MCP implementations Protecting Against Indirect Injection Attacks in MCP Strategies to prevent indirect injection attacks in MCP implementations Microsoft Copilot Studio MCP Announcement of the Microsoft Copilot Studio MCP lab Getting started with MCP for Beginners 9 part course on MCP Client and Servers Code Repositories Try it Yourself Want to build something with MCP? Microsoft has shared open-source sample code in Python, .NET, and TypeScript: Repo Name Language Description Azure-Samples/remote-mcp-apim-functions-python Python Recommended for Secure remote hosting Sample Python Azure Functions demonstrating remote MCP integration with Azure API Management Azure-Samples/remote-mcp-functions-python Python Sample Python Azure Functions demonstrating remote MCP integration Azure-Samples/remote-mcp-functions-dotnet C# Sample .NET Azure Functions demonstrating remote MCP integration Azure-Samples/remote-mcp-functions-typescript TypeScript Sample TypeScript Azure Functions demonstrating remote MCP integration Microsoft Copilot Studio MCP TypeScript Microsoft Copilot Studio MCP lab You can clone the repo, open it in VS Code, and follow the instructions to run your own MCP server. Using MCP with the AI Toolkit in Visual Studio Code To make your MCP journey even easier, Microsoft provides the AI Toolkit for Visual Studio Code. This toolkit includes: A built-in model catalog Tools to help you deploy and run models locally Seamless integration with MCP agent tools You can install the AI Toolkit extension from the Visual Studio Code Marketplace. Once installed, it helps you: Discover and select models quickly Connect those models to MCP agents Develop and test AI workflows locally before deploying to the cloud You can explore the full documentation here: Overview of the AI Toolkit for Visual Studio Code – Microsoft Learn This is perfect for developers who want to test things on their own system without needing a cloud setup right away. Why Should You Care About MCP? Because MCP: Makes your AI tools more powerful by giving them real-time knowledge Works with GitHub Copilot, Azure, and VS Code tools you may already use Is open-source and beginner-friendly with lots of tutorials and sample code It’s the future of AI development connecting models to the real world. Final Thoughts If you're learning AI or building software agents, don’t miss this valuable MCP Resources Hub. It’s like a starter kit for building smart, connected agents with Microsoft tools. Try one video or repo today. Experiment. Learn by doing and start your journey with the MCP for Beginners curricula.3.9KViews2likes2CommentsBuilding AI Agents with Microsoft Foundry: A Progressive Lab from Hello World to Self-Hosted
AI agent development has a steep on-ramp. The combination of new SDKs, tool-calling patterns, model selection decisions, retrieval-augmented generation, and deployment concerns means most developers spend more time wiring things together than actually building anything useful. The Microsoft Foundry Agent Lab is a structured, open-source demo series designed to change that — nine self-contained demos, each adding exactly one new concept, all built on the same Microsoft Foundry SDK and a single model deployment. This post walks through what the lab contains, how each demo works under the hood, and the architectural decisions that make it a useful reference for AI engineers building production agents. Why a Progressive Lab? Agent frameworks can be overwhelming. A developer who opens a rich example with RAG, tool-calling, streaming, and a custom UI all at once has no clear line of sight to which parts are essential and which are embellishments. The Foundry Agent Lab takes the opposite approach: start with the absolute minimum and introduce one new primitive per demo. By the time you reach Demo 8, you have seen every major capability — not in one monolithic sample, but in a layered sequence where each addition is visible and understandable. # Demo New Concept Tool Used UX 0 hello-demo Agent creation, Responses API, conversations None Terminal 1 tools-demo Function calling, tool-calling loop, live API FunctionTool Terminal 2 desktop-demo UI decoupling — same agent, different surface None Desktop (Tkinter) 3 websearch-demo Server-side built-in tools, no client loop WebSearchTool Terminal 4 code-demo Code execution in sandbox, Gradio web UI CodeInterpreterTool Web (Gradio) 5 rag-demo Document upload, vector stores, RAG grounding FileSearchTool Terminal 6 mcp-demo MCP servers, human-in-the-loop approval MCPTool Terminal 7 toolbox-demo Centralized tool governance, Toolbox versioning Toolbox Terminal 8 hosted-demo Self-hosted agent with Responses protocol Custom server Terminal + Agent Inspector The Model Router: One Deployment to Rule Them All Before diving into the demos, it is worth understanding the one architectural decision that ties the entire lab together: every agent uses model-router as its model deployment. MODEL_DEPLOYMENT=model-router Model Router is a Microsoft Foundry capability that inspects each request at inference time and routes it to the optimal available model — weighing task complexity, cost, and latency. A simple factual question goes to a fast, cheap model. A complex tool-calling chain with code generation gets routed to a frontier model. You write zero routing logic. The lab's MODEL-ROUTER.md file contains empirical observations from running all nine demos. A sample of what the router selected: Demo Query Task Type Model Selected hello "What's the capital of WA state?" Factual recall grok-4-1-fast-reasoning hello "Summarize our conversation" Summarization gpt-5.2-chat-2025-12-11 tools "What's the weather in Seattle?" Tool-using gpt-5.4-mini-2026-03-17 code Data analysis with code generation Code generation + execution gpt-5.4-2026-03-05 rag HR policy document question Retrieval + synthesis gpt-5.3-chat-2026-03-03 This is the strongest signal in the lab: you do not need to reason about model selection. You declare what your agent needs to do; the router handles the rest, and it chooses correctly. Demo 0: The Minimum Viable Agent The hello-demo establishes the baseline pattern used by every subsequent demo. Two files: one to register the agent, one to chat with it. Registering the agent from azure.identity import DefaultAzureCredential from azure.ai.projects import AIProjectClient from azure.ai.projects.models import PromptAgentDefinition credential = DefaultAzureCredential() project = AIProjectClient(endpoint=PROJECT_ENDPOINT, credential=credential) agent = project.agents.create_version( agent_name=AGENT_NAME, definition=PromptAgentDefinition( model=MODEL_DEPLOYMENT, instructions="You are a helpful, friendly assistant.", ), ) Authentication uses DefaultAzureCredential , which works with az login locally and with managed identity in production — no API keys anywhere in the code. Chatting with the agent # Create a server-side conversation (persists history across turns) conversation = openai.conversations.create() # Each turn sends the user message; the agent sees full history response = openai.responses.create( input=user_input, conversation=conversation.id, extra_body={"agent_reference": {"name": AGENT_NAME, "type": "agent_reference"}}, ) print(response.output_text) The conversation object is server-side. You pass its ID on every turn; the history lives in Foundry, not in a local list. This is the Responses API pattern — distinct from the older Completions or Chat Completions APIs. Demo 1: Function Tools and the Tool-Calling Loop Demo 1 adds function calling against a real weather API. The key insight here is that the model does not execute the function — it requests the execution, and your code executes it locally, then feeds the result back. Declaring a function tool from azure.ai.projects.models import FunctionTool, PromptAgentDefinition func_tool = FunctionTool( name="get_weather", description="Get the current weather for a given city.", parameters={ "type": "object", "properties": {"city": {"type": "string", "description": "City name"}}, "required": ["city"], }, strict=True, ) agent = project.agents.create_version( agent_name=AGENT_NAME, definition=PromptAgentDefinition( model=MODEL_DEPLOYMENT, tools=[func_tool], instructions="You are a weather assistant...", ), ) The tool-calling loop response = openai.responses.create(input=user_input, conversation=conversation.id, ...) # Loop while the model is requesting tool calls while any(item.type == "function_call" for item in response.output): input_list = [] for item in response.output: if item.type == "function_call": args = json.loads(item.arguments) result = get_weather(args["city"]) # execute locally input_list.append(FunctionCallOutput(call_id=item.call_id, output=result)) # Send results back to the agent response = openai.responses.create(input=input_list, conversation=conversation.id, ...) print(response.output_text) The strict=True parameter on FunctionTool enforces structured outputs — the model must return arguments that match the declared JSON schema exactly. This eliminates argument parsing errors in production. Demo 2: UI Is Not Your Agent Demo 2 runs the exact same agent as Demo 1 but surfaces it in a Tkinter desktop window. The point is pedagogical: your agent definition, conversation management, and tool-calling logic are entirely independent of your UI layer. Swapping from terminal to desktop requires changing only the presentation code — nothing in the agent or conversation path changes. This is a principle worth internalising early: agent logic and UI logic should never be entangled. The lab enforces this separation structurally. Demo 3: Server-Side Built-In Tools The web search demo introduces a sharp contrast with Demo 1. With WebSearchTool , the tool-calling loop disappears entirely from client code: from azure.ai.projects.models import WebSearchTool agent = project.agents.create_version( agent_name="Search-Agent", definition=PromptAgentDefinition( model=MODEL_DEPLOYMENT, tools=[WebSearchTool()], instructions="You are a research assistant...", ), ) The agent decides when to search, executes the search server-side, and returns a grounded response with citations. Your client code looks identical to Demo 0 — a simple responses.create() call with no tool loop. The distinction matters architecturally: Function tools (Demo 1) — tool execution happens on your client; you control the code, the API call, the error handling. Built-in tools (Demo 3+) — tool execution happens inside Foundry; you get results without managing execution. Demo 4: Code Interpreter and the Gradio Web UI Demo 4 attaches CodeInterpreterTool , which gives the agent a sandboxed Python execution environment inside Foundry. The agent can write code, run it, observe output, and iterate — all server-side. Combined with a Gradio web interface, this demo shows an agent that can perform data analysis, generate charts, and explain results through a browser UI. Model Router is particularly interesting here: the empirical data shows it selects a more capable frontier model ( gpt-5.4-2026-03-05 ) for code-generation tasks, while simpler conversational turns stay on lighter models. Demo 5: Retrieval-Augmented Generation with FileSearchTool Demo 5 introduces RAG. The setup phase uploads a document, creates a vector store, and attaches it to the agent: # Upload document and create a vector store vector_store = openai.vector_stores.create(name="employee-handbook-store") with open("data/employee-handbook.md", "rb") as f: openai.vector_stores.files.upload_and_poll( vector_store_id=vector_store.id, file=f ) # Attach the vector store to the agent agent = project.agents.create_version( agent_name="RAG-Agent", definition=PromptAgentDefinition( model=MODEL_DEPLOYMENT, tools=[FileSearchTool(vector_store_ids=[vector_store.id])], instructions="Answer questions using only the provided documents...", ), ) At query time, the agent embeds the question, searches the vector store semantically, retrieves matching chunks, and generates an answer grounded in the retrieved content — entirely server-side. The client code remains a plain responses.create() call. An important detail: the .vector_store_id file is written to disk during setup and read back during the chat session, so the demo survives process restarts without re-uploading the document. The .gitignore excludes this file from source control. Demo 6: Model Context Protocol Demo 6 connects the agent to a GitHub MCP server, giving it access to repository and issue data via the open Model Context Protocol standard. MCP servers expose tools over a standardised wire protocol; the agent discovers and calls them without any client-side function declarations. The demo also demonstrates human-in-the-loop approval: before executing any MCP tool call, the agent surfaces the proposed action and waits for the user to confirm. This is an important safety pattern for agents that can trigger side effects on external systems. Demo 7: Toolbox — Centralised Tool Governance Where Demo 6 connects to a single MCP server directly, Demo 7 uses a Toolbox — a managed Microsoft Foundry resource that bundles multiple tools into a single, versioned, MCP-compatible endpoint. The Toolbox in this demo exposes both GitHub Issues and GitHub Repos tools, curated into an immutable versioned snapshot. This pattern is significant for production multi-agent systems: Centralised governance — one team owns the tool definitions; all agents consume them via a single endpoint. Versioned snapshots — promoting a new Toolbox version is explicit; agents pin to a version and upgrade intentionally. MCP compatibility — any MCP-capable agent or framework can connect, not just Foundry SDK agents. from azure.ai.projects.models import McpTool toolbox_tool = McpTool( server_label="toolbox", server_url=TOOLBOX_ENDPOINT, allowed_tools=[], # empty = all tools in the Toolbox version headers={"Authorization": f"Bearer {token}"}, ) Demo 8: Self-Hosted Agent with the Responses Protocol The final demo departs from the prompt-agent pattern. Instead of registering a declarative agent in Foundry, Demo 8 implements a custom agent server using the Responses protocol. The server exposes a streaming HTTP endpoint; Foundry's Agent Inspector can connect to it and route user turns to it just as it would to a hosted prompt agent. This demo includes a Dockerfile and an agent.yaml , enabling deployment to Foundry's container hosting service. It uses gpt-4.1-mini directly rather than the model router, because the custom server owns the entire inference path. When to consider this pattern: Your agent requires custom pre- or post-processing logic that cannot be expressed in a system prompt. You need to integrate with infrastructure that is not reachable through MCP or built-in tools. You want to own the inference call for cost control, A/B testing, or compliance reasons. You are building a multi-agent orchestrator that needs to expose itself as an agent to other orchestrators. Getting Started The lab requires Python 3.10 or higher, an Azure subscription with a Microsoft Foundry project, and the Azure CLI. 1. Clone and set up the virtual environment git clone https://github.com/microsoft-foundry/Foundry-Agent-Lab.git cd Foundry-Agent-Lab # Create and activate the virtual environment python -m venv .venv # Windows Command Prompt .venv\Scripts\activate.bat # Windows PowerShell .venv\Scripts\Activate.ps1 # macOS / Linux source .venv/bin/activate pip install -r requirements.txt 2. Configure a demo copy hello-demo\.env.sample hello-demo\.env # Edit hello-demo\.env and set PROJECT_ENDPOINT Your PROJECT_ENDPOINT is on the Overview page of your Foundry project in the Azure portal. It takes the form https://your-resource.ai.azure.com/api/projects/your-project . 3. Run the demo az login 0-hello-demo Each numbered batch file at the root activates the virtual environment, runs create_agent.py , and launches chat.py . Append log to capture the full session transcript: 0-hello-demo log Reset between runs hello-demo\reset.bat Every demo includes a reset.bat that deletes the registered agent and any associated resources (vector stores, uploaded files). Demos are fully repeatable. Architecture Principles Demonstrated Across the nine demos, the lab illustrates a set of design principles that apply directly to production agent systems: Keyless authentication throughout Every demo uses DefaultAzureCredential . No API keys appear anywhere in the code. Locally, az login provides credentials. In production, managed identity takes over automatically — same code, no secrets to rotate. Server-side conversation state The Responses API stores conversation history server-side. Your application passes a conversation ID; Foundry maintains the thread. This eliminates the common bug of truncating history due to local list management and makes multi-process or multi-instance deployments straightforward. Client-side vs server-side tool execution The lab makes the distinction explicit. Function tools execute in your process — you control the code, the external call, and the error handling. Built-in tools (WebSearch, CodeInterpreter, FileSearch) execute inside Foundry — you get results without managing execution infrastructure. MCP tools (Demo 6, 7) fall between these: they execute in a separately deployed server, with the protocol mediating the call. Progressive tool introduction Each demo's create_agent.py registers the agent once. The chat.py file handles the conversation loop. These two responsibilities are always separate, making it easy to update agent definitions without modifying conversation logic, and vice versa. Security Considerations When building agents for production, keep the following in mind: Never commit .env files. The .gitignore excludes them, but verify this before pushing. Use Azure Key Vault or environment variable injection in CI/CD pipelines. Use managed identity in production. DefaultAzureCredential automatically picks up managed identity when deployed to Azure, eliminating the need for any stored credentials. Apply human-in-the-loop for side-effecting tools. Demo 6 demonstrates this pattern for MCP tool calls. Any agent that can modify external state (create issues, send emails, write files) should surface proposed actions for confirmation. Validate tool outputs before use. Treat data returned by external tools (weather APIs, search results, document retrieval) as untrusted input. Prompt injection through tool results is a real attack surface; grounding instructions in your system prompt reduce but do not eliminate this risk. Scope Toolbox permissions narrowly. When using a Toolbox (Demo 7), use allowed_tools to restrict which tools the agent can call, rather than granting access to all tools in a Toolbox version. Key Takeaways Start with the minimum. A prompt agent with no tools requires fewer than 30 lines of code using the Foundry SDK. Add tools only when the use case demands them. Use model-router unless you have a specific reason not to. The empirical data in the lab shows the router selects appropriate models across all task types — factual, creative, tool-calling, RAG, and code generation. Understand the client/server tool boundary. Function tools give you control; built-in tools give you simplicity. MCP and Toolbox give you governance and interoperability. Choose based on where you need control and where you need scale. Conversation state belongs on the server. Do not maintain conversation history in application memory if you can avoid it. The Responses API conversation object is designed for this. The hosted-demo pattern is for when you need to own the inference path. For most use cases, a declarative prompt agent is sufficient and far simpler to operate. Next Steps Explore the repo: github.com/microsoft-foundry/Foundry-Agent-Lab Microsoft Foundry SDK documentation: learn.microsoft.com/azure/ai-studio/ Responses API quickstart: Prompt agent quickstart Model Router conceptual documentation: Model Router for Microsoft Foundry Model Context Protocol: modelcontextprotocol.io Azure Identity SDK (DefaultAzureCredential): azure-identity Python SDK The Foundry Agent Lab is open source under the MIT licence. Contributions, bug reports, and feature requests are welcome through GitHub Issues. See CONTRIBUTING.md for guidelines.How to Visualize Your Azure AI Workloads Usage for Observability
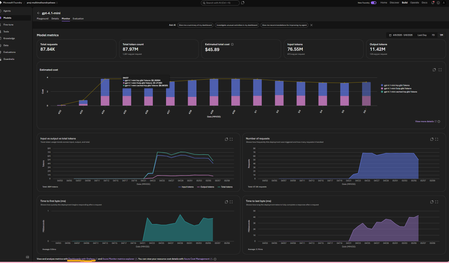
This article assumes you already have an Azure Foundry project and resource deployed in Microsoft Foundry. The options referenced here are documented in detail in the linked articles; this post serves as a consolidated step by step guide bringing them all together and explaining where each option is most useful. A Summary: Need Best Option Quick day-over-day visual, minimal setup Grafana Dashboard (Option 3) Custom growth % calculations App Insights + KQL in Log Analytics (Option 4) Shareable, interactive report Azure Workbooks (Option 5) Per-user/per-agent granularity APIM + App Insights (Option 6) Quick one-off chart, export to Excel Microsoft Foundry Monitor tab or App Insights Metrics Explorer (Option 1 and 2) Option 1. Within the Microsoft Foundry Portal (Quickest, No Setup) If you have models deployed in Microsoft Foundry and would like to monitor its usage, go to the New Foundry Portal → Build → Models → Monitor tab. View metrics such as: Estimated cost Total token usage Input vs. output tokens Number of requests This is the simplest way to monitor both model and agent usage. For PAYG plans: You can also view your total allocated quota (and figure out which Tier you are on) using the Quota Management Screen (New Foundry Portal → Operate → Quota tab). This screen shows how much your total allocated quota is, per model in a given subscription + region + Deployment Type (Global, Data Zones or Regional). For eg., in the image below, for gpt-4o, I am allocated 7M total TPM in my subscription. I am only using 150K TPM of the allocated 7M TPM amount. Which means, my requests will get throttled if I exceed the 150K TPM limit. To avoid throttling, I would need to increase my shared allocation limit. NOTE: you are charged for usage, so if you allow more capacity, you use more, so you pay more. Option 2: Azure Monitor Metrics Explorer This is already built into the Azure Portal and gives you time-series charts out of the box. Go to Azure Portal → your Azure OpenAI / Foundry resource → Monitoring → Metrics Select a metric like AzureOpenAIRequests or TokenTransaction Set Aggregation to Sum (total) or Max and Time granularity to 1 day Split by ModelDeploymentName to see per-model trends Adjust the time range (e.g., last 30 days) — you'll see day-over-day bars/lines Tip: You can pin these charts to an Azure Dashboard for a persistent view, or click Share → Download to Excel to get the raw data for your own analysis. Option 3: Azure Managed Grafana (Best Pre-Built Dashboard) This is the best option for a polished, real-time, day-over-day dashboard with no custom code. There's a pre-built AI Foundry dashboard ready to import. [grafana.com], [Create a M...ed Grafana] How to set it up: Create an Azure Managed Grafana workspace (if you don't have one) In Grafana, go to Dashboards → New → Import → enter dashboard ID 24039 (for Foundry) Select your Azure Monitor data source and point it to your Foundry resource Tip: You can also import this directly from the Azure Portal: Monitor → Dashboards with Grafana → AI Foundry. That's it — the dashboard gives you (per model deployment): Token trends over time (inference, prompt, completion — day over day) Request trends over time (AzureOpenAIRequests as a time series) Latency trends (bonus) NOTE: Default time range is 7 days — adjust to 30/60/90 days for growth trends Option 4: Application Insights + KQL Queries (Most Flexible, Custom Reports) If you want fully custom day-over-day growth calculations (e.g., % change day-to-day), this is the way. [azurefeeds.com] Setup: Ensure your Foundry project is connected to an Application Insights resource (Foundry → Settings → Connected Resources). Open up App Insights resource → Logs → New Query or choose a sample query. In the images below, we simply ran 'requests' and set the time range to 24 hours. There is also a Kusto Query Language (KQL) mode or Simple mode on the right-hand side: Simple mode will let you run out of the box samples. KQL mode will open up a query window for you to enter custom queries. Below are the results in grid view. Same view but showing a chart: Export options: Another way to get the above graphs are via Log Analytics. Simply enable Diagnostic Settings on your Azure OpenAI resource → send to a Log Analytics workspace. Open Log Analytics → Logs and try our your sample queries. Sample KQL for day-over-day token usage (adjust to your needs): AzureMetrics | where MetricName in ("TokenTransaction", "ProcessedPromptTokens", "GeneratedTokens") | where TimeGenerated > ago(30d) | summarize DailyTokens = sum(Total) by bin(TimeGenerated, 1d), MetricName | order by TimeGenerated asc | render timechart Result: Sample KQL for day-over-day growth % (adjust to your needs): AzureMetrics | where MetricName == "TokenTransaction" | where TimeGenerated > ago(30d) | summarize DailyTokens = sum(Total) by Day = bin(TimeGenerated, 1d) | sort by Day asc | extend PrevDay = prev(DailyTokens) | extend GrowthPct = round((DailyTokens - PrevDay) / PrevDay * 100, 2) | project Day, DailyTokens, GrowthPct Option 5: Azure Monitor Workbooks (Custom Dashboards, Shareable) Workbooks let you build interactive, parameterized dashboards that combine metrics and KQL logs. What's more, you can select resources from multiple subscriptions and visualize them all in one place using Workbooks! Go to Azure Portal → Monitor → Workbooks → New Add a Metrics query panel → select your Log Analytics or App Insights or Foundry resource -> Enter the same query you used in Option 4. Do a test run and view the graphs (this can be viewed as charts or a list (grid view)): 4. Save and share with your team. Option 6: APIM + Application Insights (Granular Per-Caller/Per-Agent Tracking) 1. If your app routes requests through Azure API Management, you can use the azure-openai-emit-token-metric policy to send per-request token metrics to Application Insights with custom dimensions (User ID, Subscription ID, Agent, etc.). [Azure API...osoft Docs] This is ideal for scenarios like: "Which agent consumed the most tokens last week?" "What's the token usage per API consumer/team?" NOTE: Microsoft Foundry resources do not track usage by users. So, fronting your Foundry resource with an APIM could be a way to track users provided you pass the username/id in the request context. How you implement this is upto your app design. Ref: AI-Gateway/labs/token-metrics-emitting/token-metrics-emitting.ipynb at main · Azure-Samples/AI-Gateway · GitHub Bonus: Check out all other APIM + AI related policies here: AI-Gateway/labs/semantic-caching at main · Azure-Samples/AI-Gateway AI-Gateway/labs/token-rate-limiting at main · Azure-Samples/AI-Gateway AI-Gateway/labs/token-metrics-emitting/token-metrics-emitting.ipynb at main · Azure-Samples/AI-Gateway · GitHub1.6KViews0likes0CommentsFrom Prompt to Production: Open in VS Code for Terraform in Azure Copilot
We’re excited to introduce a new step in the Terraform on Azure experience: Open in VS Code, now available directly from Azure Copilot in the Azure Portal. This capability helps you move seamlessly from AI‑generated Terraform code to real Azure deployments - within a connected, guided workflow designed for enterprise scenarios. Why This Matters Infrastructure as Code with Terraform is powerful, but moving from generated configuration to a deployed environment typically involves multiple tools and handoffs. Teams need to understand Terraform state, work with remote backends, and integrate their code into version‑controlled CI/CD pipelines - often backed by Terraform Cloud or Azure‑native backends in enterprise environments. Open in VS Code brings these steps together. It bridges the gap between AI‑assisted authoring in the Azure Portal and the real‑world workflows required to validate, manage state, and deploy infrastructure with confidence. Continue Your Workflow in VS Code With Azure Copilot, you can describe your infrastructure in natural language and generate Terraform configurations in seconds. For example: “Create an Azure Container App using Terraform with a managed environment, Log Analytics enabled, and a system‑assigned managed identity to securely pull images from Azure Container Registry.” Copilot generates the Terraform configuration for you. From there, you can select Open full view to enter a full‑screen Terraform editor, and then choose Open in VS Code to launch the configuration in an Azure‑hosted VS Code environment. There’s no need to download files or set up a local development environment. VS Code for the web opens with Azure authentication already configured, along with commonly used extensions, so you can immediately focus on refining, validating, and preparing your infrastructure for deployment. Built‑in Guidance for Real Deployments Beyond editing, the VS Code experience includes built‑in, step‑by‑step guidance to help you deploy your Terraform configuration into your own Azure environment - whether you’re experimenting or preparing for production. Because Terraform relies on state management, the workflow starts by helping you choose and configure a backend. Backend Options Option 1: Azure Storage Account as a remote backend A natural fit for Azure‑native and enterprise environments. The experience guides you through creating or selecting a storage account and configuring Terraform to store state securely in Azure. Option 2: HCP Terraform (Terraform Cloud) as a remote backend Ideal for teams already using Terraform Cloud. The guided flow helps you authenticate, connect to an existing organization and workspace, and generate the required backend configuration directly into your Terraform files. Option 3: Temporary workspace for quick validation Designed for learning and experimentation. You can run terraform plan and terraform apply directly in the Azure workspace with temporary state, without committing to a long‑term backend - ideal for quick validation, but not intended for production use. Each option includes an end‑to‑end walkthrough, so you can complete backend setup and run Terraform commands without leaving the VS Code environment or searching through external documentation. Connecting Code, State, and Deployment This experience connects three essential parts of the Terraform workflow: AI‑assisted code generation in Azure Portal Copilot Interactive editing and guided execution in VS Code for the web Flexible backend options for managing Terraform state Together, these pieces make it easier to move from idea to infrastructure in a structured, supported way—whether you’re new to Terraform or managing production workloads with established CI/CD pipelines. Available Now - and What’s Next The Open in VS Code experience for Terraform is now public preview in Azure Portal Copilot. We’re continuing to invest in this workflow, including clearer deployment guidance, future integration with GitHub Actions and other CI/CD pipelines, and deeper enhancements to the full‑screen Terraform editor experience. If you haven’t tried it yet, generate a Terraform configuration with Azure Copilot and open it in VS Code to go from prompt to production end to end in one connected workflow.1.4KViews0likes0Comments
Dev Containers for .NET in VS Code: A Beginner‑Friendly Guide That Actually Works
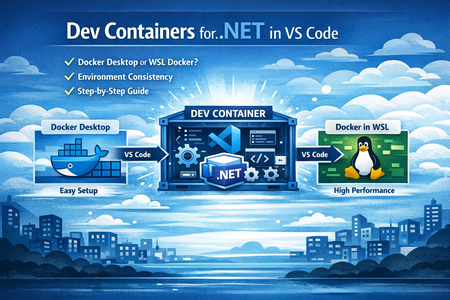
What Dev Containers are really about At a high level, Dev Containers let you use a Docker container as your development environment inside VS Code. But the real idea is not “Docker for development”. The real idea is this: Move all environment complexity out of your laptop and into version‑controlled configuration. With Dev Containers: Your laptop becomes just a VS Code client Your tools, SDKs, runtimes, and dependencies live inside the container Your project defines its own development environment, not your machine This means: You can switch projects without breaking anything You can delete and recreate your environment safely New developers get the same setup without tribal knowledge Why Dev Containers are so useful for .NET projects .NET development often looks simple at first until it doesn’t. Common pain points: Different developers using different .NET SDK versions One project needs .NET 6, another needs .NET 8 Native dependencies work on one machine but not another CI runs on Linux but developers run on Windows Dev Containers solve this by: Locking the SDK version and OS used for development Running everything in a Linux container (close to CI/production) Keeping developer machines clean and stable Making onboarding almost instant: clone → reopen in container → run Once the .devcontainer folder is committed to the repo, the environment becomes part of the codebase, not a wiki page. How Dev Containers work in VS Code You don’t need deep Docker knowledge to use Dev Containers. Here’s the mental model that helped me: Your repository contains a .devcontainer folder Inside it, devcontainer.json describes the development environment VS Code reads that file and starts a container VS Code connects to the container and runs extensions inside it Your source code stays on your machine, but: the terminal runs inside the container the debugger runs inside the container the SDKs live inside the container If something breaks, you rebuild the container, not your laptop. When Dev Containers are a great choice (and when they’re not) Dev Containers are a great fit when: You work on multiple projects with different requirements Your team struggles with environment consistency You want Linux parity for CI and containerized deployments You value reproducibility over ad‑hoc local setup They may not be ideal when: You’re working on very small throwaway scripts You rely heavily on Windows‑only tooling You cannot use Docker at all in your environment For most professional .NET teams, the benefits far outweigh the cost. Docker on Windows: a choice you must make early When starting with Dev Containers on Windows, one of the first decisions you must make is how Docker runs on your machine. Both Docker Desktop and Docker Engine inside WSL work well with Dev Containers but they serve slightly different needs. Using Docker Desktop Docker Desktop is the easiest and most beginner‑friendly way to get started with Dev Containers. Pros Very quick setup with minimal configuration Comes with a graphical dashboard for containers, images, and logs Integrates smoothly with VS Code and WSL2 Easier to troubleshoot when you’re learning Cons Uses more system resources in the background Runs additional services even when you’re not actively developing May be restricted or licensed differently in some enterprise environments When to use Docker Desktop You are new to Docker or Dev Containers You want the simplest and fastest setup You value ease of use over fine‑grained control You are working on personal projects or in environments where Docker Desktop is allowed For most developers starting out with Dev Containers, Docker Desktop is the recommended entry point. Using Docker Engine inside WSL This approach installs Docker Engine directly inside a Linux distribution (like Ubuntu) running on WSL2, without Docker Desktop. Pros Lower resource usage compared to Docker Desktop Linux‑native behavior (closer to CI and production) No dependency on Docker Desktop Often preferred in enterprise or restricted environments Cons Requires manual installation and configuration Needs basic Linux and WSL knowledge No graphical UI everything is CLI‑based When to use Docker Engine in WSL Docker Desktop is not allowed or restricted You want a leaner, Linux‑first workflow You already work mostly inside WSL You want tighter control over your Docker setup This approach is ideal once you are comfortable with Docker and WSL. Note : Do not mix Docker Desktop and Docker Engine inside WSL.Pick one approach and stick with it. Running both at the same time often leads to Docker context confusion and Dev Containers failing in unpredictable ways, even when your configuration looks correct. A performance tip that makes a huge difference If you’re using Linux containers with WSL, store your code inside the WSL filesystem. Recommended: /home/<user>/projects/your-repo Avoid: /mnt/c/Users/<user>/your-repo Linux containers accessing Windows files are slower and cause file‑watching issues. Moving the repo into WSL made my Dev Containers feel almost native. First‑time setup: the simplest way to start If you’re trying Dev Containers for the first time, follow this exact order: Install Visual Studio Code Install the Dev Containers extension Install Docker Desktop (or Docker Engine in WSL) Clone your repo inside the WSL filesystem Open the folder in VS Code Run “Dev Containers: Reopen in Container” That’s it. VS Code handles the rest. Your first .NET Dev Container (hands‑on example) Tech Stack .NET 8 Web API PostgreSQL 16 Entity Framework Core + Npgsql VS Code Dev Containers Docker Compose Project Structure my-blog-api/ ├─ .devcontainer/ │ └─ devcontainer.json ├─ docker-compose.yml └─ src/ └─ BlogApi/ ├─ Program.cs ├─ BlogApi.csproj ├─ appsettings.json ├─ Models/ └─ Data/ Step 1: Create the Web API mkdir my-blog-api cd my-blog-api mkdir src && cd src dotnet new webapi -n BlogApi cd BlogApi Step 2: Add EF Core + PostgreSQL packages dotnet add package Npgsql.EntityFrameworkCore.PostgreSQL dotnet add package Microsoft.EntityFrameworkCore.Design Step 3: Docker Compose (API + PostgreSQL) Create docker-compose.yml at the repo root: version: "3.8" services: app: image: mcr.microsoft.com/devcontainers/dotnet:1-8.0 volumes: - .:/workspace:cached working_dir: /workspace command: sleep infinity ports: - "5000:5000" depends_on: - db db: image: postgres:16 environment: POSTGRES_USER: devuser POSTGRES_PASSWORD: devpwd POSTGRES_DB: devdb ports: - "5432:5432" volumes: - pgdata:/var/lib/postgresql/data pgadmin: image: dpage/pgadmin4 environment: PGADMIN_DEFAULT_EMAIL: admin@admin.com PGADMIN_DEFAULT_PASSWORD: admin ports: - "5050:80" depends_on: - db volumes: pgdata: Step 4: Dev Container configuration Create .devcontainer/devcontainer.json: { "name": "dotnet-postgres-devcontainer", "dockerComposeFile": "../docker-compose.yml", "service": "app", "workspaceFolder": "/workspace", "shutdownAction": "stopCompose", "customizations": { "vscode": { "extensions": [ "ms-dotnettools.csdevkit", "ms-dotnettools.csharp", "ms-azuretools.vscode-docker" ] } }, "postCreateCommand": "dotnet restore" } Open the folder in VS Code and run: Dev Containers: Reopen in Container Step 5: Connection string (container‑to‑container) Update appsettings.json: { "ConnectionStrings": { "DefaultConnection": "Host=db;Port=5432;Database=devdb;Username=devuser;Password=devpwd" }, "Logging": { "LogLevel": { "Default": "Information", "Microsoft.AspNetCore": "Warning" } }, "AllowedHosts": "*" } Host=db works because Docker Compose provides internal DNS between services. Step 6: EF Core Model & DbContext Post entity – Models/Post.cs namespace BlogApi.Models; public class Post { public int Id { get; set; } public string Title { get; set; } = string.Empty; public string Content { get; set; } = string.Empty; public DateTime CreatedUtc { get; set; } = DateTime.UtcNow; } DbContext – Data/BlogDbContext.cs using BlogApi.Models; using Microsoft.EntityFrameworkCore; namespace BlogApi.Data; public class BlogDbContext : DbContext { public BlogDbContext(DbContextOptions<BlogDbContext> options) : base(options) { } public DbSet<Post> Posts => Set<Post>(); } Step 7: Program.cs (Minimal CRUD) Replace Program.cs with: using BlogApi.Data; using BlogApi.Models; using Microsoft.EntityFrameworkCore; var builder = WebApplication.CreateBuilder(args); builder.Services.AddDbContext<BlogDbContext>(options => options.UseNpgsql(builder.Configuration.GetConnectionString("DefaultConnection"))); builder.Services.AddEndpointsApiExplorer(); builder.Services.AddSwaggerGen(); var app = builder.Build(); // Apply migrations on startup (dev-only convenience) using (var scope = app.Services.CreateScope()) { var db = scope.ServiceProvider.GetRequiredService<BlogDbContext>(); db.Database.Migrate(); } app.UseSwagger(); app.UseSwaggerUI(); app.MapGet("/posts", async (BlogDbContext db) => await db.Posts.OrderByDescending(p => p.CreatedUtc).ToListAsync()); app.MapPost("/posts", async (Post post, BlogDbContext db) => { db.Posts.Add(post); await db.SaveChangesAsync(); return Results.Created($"/posts/{post.Id}", post); }); app.MapPut("/posts/{id:int}", async (int id, Post input, BlogDbContext db) => { var post = await db.Posts.FindAsync(id); if (post is null) return Results.NotFound(); post.Title = input.Title; post.Content = input.Content; await db.SaveChangesAsync(); return Results.Ok(post); }); app.MapDelete("/posts/{id:int}", async (int id, BlogDbContext db) => { var post = await db.Posts.FindAsync(id); if (post is null) return Results.NotFound(); db.Posts.Remove(post); await db.SaveChangesAsync(); return Results.NoContent(); }); app.Run("http://0.0.0.0:5000"); Step 8: Run migrations (inside Dev Container) cd src/BlogApi dotnet tool install --global dotnet-ef export PATH="$PATH:/home/vscode/.dotnet/tools" dotnet ef migrations add InitialCreate dotnet ef database update Step 9: Run the API dotnet run 🔗 Open: Swagger → http://localhost:5000/swagger Posts API → http://localhost:5000/posts Common mistakes and quick fixes Mistake Symptom Fix Mixing Docker models Random failures Use only one Docker approach Code under /mnt/c Slow builds Move repo to WSL filesystem Docker not running Container won’t start Check docker info Pruning first Issues return Fix daemon/context first Common Challenges Faced Multiple Docker engines active simultaneously Docker Desktop and Docker Engine inside WSL were both present, causing conflicts. Unstable Docker CLI context Docker CLI intermittently pointed to different or broken Docker endpoints. Docker daemon appeared running but was unusable Docker commands failed with API errors despite the daemon seeming active. systemd dependency issues inside WSL Docker Engine depended on systemd, which was not consistently active after WSL restarts. Dev Containers failing during setup VS Code Dev Containers surfaced failures during feature installation and builds. Misleading Docker error messages Errors pointed to API or version issues, masking the real root cause. Cache cleanup ineffective Pruning images and containers did not resolve underlying daemon issues. Container observability confusion PostgreSQL and pgAdmin worked, but container health, volumes, and data locations were unclear. Solutions & Maintainable Settings Enforce a Single Docker Model. Use either Docker Desktop or native Docker Engine inside WSL .never both. docker version docker info Verify only one server is shown No references to dockerDesktopLinuxEngine when using native WSL Docker Explicitly Lock Docker CLI Context. Always verify and set Docker context before running Compose or Dev Containers. docker context ls docker context show docker context use default Context must point to the intended daemon (WSL or Desktop) Validate Docker Daemon Health Before Project Start.Confirm Docker is reachable before Dev Containers or Compose. docker info docker ps Must return without API / 500 / version errors Do not proceed if these fail Ensure systemd Is Enabled in WSL.Docker Engine inside WSL depends on systemd. cat /etc/wsl.conf Expected: [boot] systemd=true If not then apply changes.Restart WSL and re‑verify: wsl --shutdown systemctl status docker Start Docker Explicitly After WSL Restart.WSL restarts silently stop services. sudo systemctl start docker sudo systemctl enable docker Verify: docker ps Use Only WSL Native Filesystem for Projects.Keep project under /home/<user>/... Avoid /mnt/c/... paths. Path starts with /home/ Treat Dev Containers as a Consumer, Not the Fix. Fix Docker issues outside Dev Containers first. Pre‑check Commands docker compose config docker compose up -d Compose works before opening Dev Container Keep Dev Container Features Minimal on First Run Start with base image + required services only Add features after baseline stability docker images docker ps Verify Container Observability Explicitly.Confirm containers are healthy, ports mapped, volumes mounted. docker ps docker inspect <container_name> docker logs <container_name> Port check: ss -lntp | grep <port> Avoid Cache Cleanup as a First Fix. Do not rely on prune to fix daemon issues Only After Daemon Is Healthy docker system prune -f docker volume prune -f Establish a “Known‑Good” Baseline Checklist. Validate sequence before development starts Baseline Flow wsl --shutdown # reopen WSL sudo systemctl start docker docker context show docker info docker compose up -d code . # Only then open Reopen in Container If something breaks in between after running dev container we can stop and clean the containers and rebuild it again docker ps docker stop $(docker ps -q) docker rm -f $(docker ps -aq) docker ps Closing Thoughts Dev Containers shift local development from fragile, machine‑specific setups to reproducible, version‑controlled environments. With Dev Containers, Docker Compose, PostgreSQL, and pgAdmin, your entire .NET development stack lives inside containers.not on your laptop. SDKs, databases, and tools are isolated, consistent, and easy to rebuild. When something breaks, you rebuild containers.not machines. This approach removes onboarding friction, improves Linux parity with CI, and eliminates the classic “works on my machine” problem. Once Docker is stable, Dev Containers become one of the most reliable ways to build modern .NET applications. Key Takeaways Dev Containers treat the development environment as code .NET, PostgreSQL, and pgAdmin run fully isolated in containers pgAdmin provides clear visibility into database state and migrations Docker stability is a prerequisite.Dev Containers are not a Docker fix Onboarding becomes simple: clone → reopen in container → run Rebuild containers, not laptops2.6KViews0likes0CommentsAZD for Beginners: A Practical Introduction to Azure Developer CLI
If you are learning how to get an application from your machine into Azure without stitching together every deployment step by hand, Azure Developer CLI, usually shortened to azd , is one of the most useful tools to understand early. It gives developers a workflow-focused command line for provisioning infrastructure, deploying application code, wiring environment settings, and working with templates that reflect real cloud architectures rather than toy examples. This matters because many beginners hit the same wall when they first approach Azure. They can build a web app locally, but once deployment enters the picture they have to think about resource groups, hosting plans, databases, secrets, monitoring, configuration, and repeatability all at once. azd reduces that operational overhead by giving you a consistent developer workflow. Instead of manually creating each resource and then trying to remember how everything fits together, you start with a template or an azd -compatible project and let the tool guide the path from local development to a running Azure environment. If you are new to the tool, the AZD for Beginners learning resources are a strong place to start. The repository is structured as a guided course rather than a loose collection of notes. It covers the foundations, AI-first deployment scenarios, configuration and authentication, infrastructure as code, troubleshooting, and production patterns. In other words, it does not just tell you which commands exist. It shows you how to think about shipping modern Azure applications with them. What Is Azure Developer CLI? The Azure Developer CLI documentation on Microsoft Learn, azd is an open-source tool designed to accelerate the path from a local development environment to Azure. That description is important because it explains what the tool is trying to optimise. azd is not mainly about managing one isolated Azure resource at a time. It is about helping developers work with complete applications. The simplest way to think about it is this. Azure CLI, az , is broad and resource-focused. It gives you precise control over Azure services. Azure Developer CLI, azd , is application-focused. It helps you take a solution made up of code, infrastructure definitions, and environment configuration and push that solution into Azure in a repeatable way. Those tools are not competitors. They solve different problems and often work well together. For a beginner, the value of azd comes from four practical benefits: It gives you a consistent workflow built around commands such as azd init , azd auth login , azd up , azd show , and azd down . It uses templates so you do not need to design every deployment structure from scratch on day one. It encourages infrastructure as code through files such as azure.yaml and the infra folder. It helps you move from a one-off deployment towards a repeatable development workflow that is easier to understand, change, and clean up. Why Should You Care About azd A lot of cloud frustration comes from context switching. You start by trying to deploy an app, but you quickly end up learning five or six Azure services, authentication flows, naming rules, environment variables, and deployment conventions all at once. That is not a good way to build confidence. azd helps by giving a workflow that feels closer to software delivery than raw infrastructure management. You still learn real Azure concepts, but you do so through an application lens. You initialise a project, authenticate, provision what is required, deploy the app, inspect the result, and tear it down when you are done. That sequence is easier to retain because it mirrors the way developers already think about shipping software. This is also why the AZD for Beginners resource is useful. It does not assume every reader is already comfortable with Azure. It starts with foundation topics and then expands into more advanced paths, including AI deployment scenarios that use the same core azd workflow. That progression makes it especially suitable for students, self-taught developers, workshop attendees, and engineers who know how to code but want a clearer path into Azure deployment. What You Learn from AZD for Beginners The AZD for Beginners course is structured as a learning journey rather than a single quickstart. That matters because azd is not just a command list. It is a deployment workflow with conventions, patterns, and trade-offs. The course helps readers build that mental model gradually. At a high level, the material covers: Foundational topics such as what azd is, how to install it, and how the basic deployment loop works. Template-based development, including how to start from an existing architecture rather than building everything yourself. Environment configuration and authentication practices, including the role of environment variables and secure access patterns. Infrastructure as code concepts using the standard azd project structure. Troubleshooting, validation, and pre-deployment thinking, which are often ignored in beginner content even though they matter in real projects. Modern AI and multi-service application scenarios, showing that azd is not limited to basic web applications. One of the strongest aspects of the course is that it does not stop at the first successful deployment. It also covers how to reason about configuration, resource planning, debugging, and production readiness. That gives learners a more realistic picture of what Azure development work actually looks like. The Core azd Workflow The official overview on Microsoft Learn and the get started guide both reinforce a simple but important idea: most beginners should first understand the standard workflow before worrying about advanced customisation. That workflow usually looks like this: Install azd . Authenticate with Azure. Initialise a project from a template or in an existing repository. Run azd up to provision and deploy. Inspect the deployed application. Remove the resources when finished. Here is a minimal example using an existing template: # Install azd on Windows winget install microsoft.azd # Check that the installation worked azd version # Sign in to your Azure account azd auth login # Start a project from a template azd init --template todo-nodejs-mongo # Provision Azure resources and deploy the app azd up # Show output values such as the deployed URL azd show # Clean up everything when you are done learning azd down --force --purge This sequence is important because it teaches beginners the full lifecycle, not only deployment. A lot of people remember azd up and forget the cleanup step. That leads to wasted resources and avoidable cost. The azd down --force --purge step is part of the discipline, not an optional extra. Installing azd and Verifying Your Setup The official install azd guide on Microsoft Learn provides platform-specific instructions. Because this repository targets developer learning, it is worth showing the common install paths clearly. # Windows winget install microsoft.azd # macOS brew tap azure/azd && brew install azd # Linux curl -fsSL https://aka.ms/install-azd.sh | bash After installation, verify the tool is available: azd version That sounds obvious, but it is worth doing immediately. Many beginner problems come from assuming the install completed correctly, only to discover a path issue or outdated version later. Verifying early saves time. The Microsoft Learn installation page also notes that azd installs supporting tools such as GitHub CLI and Bicep CLI within the tool's own scope. For a beginner, that is helpful because it removes some of the setup friction you might otherwise need to handle manually. What Happens When You Run azd up ? One of the most important questions is what azd up is actually doing. The short answer is that it combines provisioning and deployment into one workflow. The longer answer is where the learning value sits. When you run azd up , the tool looks at the project configuration, reads the infrastructure definition, determines which Azure resources need to exist, provisions them if necessary, and then deploys the application code to those resources. In many templates, it also works with environment settings and output values so that the project becomes reproducible rather than ad hoc. That matters because it teaches a more modern cloud habit. Instead of building infrastructure manually in the portal and then hoping you can remember how you did it, you define the deployment shape in source-controlled files. Even at beginner level, that is the right habit to learn. Understanding the Shape of an azd Project The Azure Developer CLI templates overview explains the standard project structure used by azd . If you understand this structure early, templates become much less mysterious. A typical azd project contains: azure.yaml to describe the project and map services to infrastructure targets. An infra folder containing Bicep or Terraform files for infrastructure as code. A src folder, or equivalent source folders, containing the application code that will be deployed. A local .azure folder to store environment-specific settings for the project. Here is a minimal example of what an azure.yaml file can look like in a simple app: name: beginner-web-app metadata: template: beginner-web-app services: web: project: ./src/web host: appservice This file is small, but it carries an important idea. azd needs a clear mapping between your application code and the Azure service that will host it. Once you see that, the tool becomes easier to reason about. You are not invoking magic. You are describing an application and its hosting model in a standard way. Start from a Template, Then Learn the Architecture Beginners often assume that using a template is somehow less serious than building something from scratch. In practice, it is usually the right place to begin. The official docs for templates and the Awesome AZD gallery both encourage developers to start from an existing architecture when it matches their goals. That is a sound learning strategy for two reasons. First, it lets you experience a working deployment quickly, which builds confidence. Second, it gives you a concrete project to inspect. You can look at azure.yaml , explore the infra folder, inspect the app source, and understand how the pieces connect. That teaches more than reading a command reference in isolation. The AZD for Beginners material also leans into this approach. It includes chapter guidance, templates, workshops, examples, and structured progression so that readers move from successful execution into understanding. That is much more useful than a single command demo. A practical beginner workflow looks like this: # Pick a known template azd init --template todo-nodejs-mongo # Review the files that were created or cloned # - azure.yaml # - infra/ # - src/ # Deploy it azd up # Open the deployed app details azd show Once that works, do not immediately jump to a different template. Spend time understanding what was deployed and why. Where AZD for Beginners Fits In The official docs are excellent for accurate command guidance and conceptual documentation. The AZD for Beginners repository adds something different: a curated learning path. It helps beginners answer questions such as these: Which chapter should I start with if I know Azure a little but not azd ? How do I move from a first deployment into understanding configuration and authentication? What changes when the application becomes an AI application rather than a simple web app? How do I troubleshoot failures instead of copying commands blindly? The repository also points learners towards workshops, examples, a command cheat sheet, FAQ material, and chapter-based exercises. That makes it particularly useful in teaching contexts. A lecturer or workshop facilitator can use it as a course backbone, while an individual learner can work through it as a self-study track. For developers interested in AI, the resource is especially timely because it shows how the same azd workflow can be used for AI-first solutions, including scenarios connected to Microsoft Foundry services and multi-agent architectures. The important beginner lesson is that the workflow stays recognisable even as the application becomes more advanced. Common Beginner Mistakes and How to Avoid Them A good introduction should not only explain the happy path. It should also point out the places where beginners usually get stuck. Skipping authentication checks. If azd auth login has not completed properly, later commands will fail in ways that are harder to interpret. Not verifying the installation. Run azd version immediately after install so you know the tool is available. Treating templates as black boxes. Always inspect azure.yaml and the infra folder so you understand what the project intends to provision. Forgetting cleanup. Learning environments cost money if you leave them running. Use azd down --force --purge when you are finished experimenting. Trying to customise too early. First get a known template working exactly as designed. Then change one thing at a time. If you do hit problems, the official troubleshooting documentation and the troubleshooting sections inside AZD for Beginners are the right next step. That is a much better habit than searching randomly for partial command snippets. How I Would Approach AZD as a New Learner If I were introducing azd to a student or a developer who is comfortable with code but new to Azure delivery, I would keep the learning path tight. Read the official What is Azure Developer CLI? overview so the purpose is clear. Install the tool using the Microsoft Learn install guide. Work through the opening sections of AZD for Beginners. Deploy one template with azd init and azd up . Inspect azure.yaml and the infrastructure files before making any changes. Run azd down --force --purge so the lifecycle becomes a habit. Only then move on to AI templates, configuration changes, or custom project conversion. That sequence keeps the cognitive load manageable. It gives you one successful deployment, one architecture to inspect, and one repeatable workflow to internalise before adding more complexity. Why azd Is Worth Learning Now azd matters because it reflects how modern Azure application delivery is actually done: repeatable infrastructure, source-controlled configuration, environment-aware workflows, and application-level thinking rather than isolated portal clicks. It is useful for straightforward web applications, but it becomes even more valuable as systems gain more services, more configuration, and more deployment complexity. That is also why the AZD for Beginners resource is worth recommending. It gives new learners a structured route into the tool instead of leaving them to piece together disconnected docs, samples, and videos on their own. Used alongside the official Microsoft Learn documentation, it gives you both accuracy and progression. Key Takeaways azd is an application-focused Azure deployment tool, not just another general-purpose CLI. The core beginner workflow is simple: install, authenticate, initialise, deploy, inspect, and clean up. Templates are not a shortcut to avoid learning. They are a practical way to learn architecture through working examples. AZD for Beginners is valuable because it turns the tool into a structured learning path. The official Microsoft Learn documentation for Azure Developer CLI should remain your grounding source for commands and platform guidance. Next Steps If you want to keep going, start with these resources: AZD for Beginners for the structured course, examples, and workshop materials. Azure Developer CLI documentation on Microsoft Learn for official command, workflow, and reference guidance. Install azd if you have not set up the tool yet. Deploy an azd template for the first full quickstart. Azure Developer CLI templates overview if you want to understand the project structure and template model. Awesome AZD if you want to browse starter architectures. If you are teaching others, this is also a good sequence for a workshop: start with the official overview, deploy one template, inspect the project structure, and then use AZD for Beginners as the path for deeper learning. That gives learners both an early win and a solid conceptual foundation.