python
333 TopicsMeet the Hosted Skills Canvas: Build, Run, and Debug in GitHub Copilot
Build, run, and debug event-driven AI apps right inside GitHub Copilot. The new Azure Functions Hosted Skills canvas brings instructions, triggers, and live results into one workspace—so you can spend less time switching tools and more time building. 509Views1like0Comments
Bulletproof agents with the durable task extension for Microsoft Agent Framework
Today, we're thrilled to announce the public preview of the durable task extension for Microsoft Agent Framework. This extension transforms how you build production-ready, resilient and scalable AI agents by bringing the proven durable execution (survives crashes and restarts) and distributed execution (runs across multiple instances) capabilities of Azure Durable Functions directly into the Microsoft Agent Framework. Now you can deploy stateful, resilient AI agents to Azure that automatically handle session management, failure recovery, and scaling, freeing you to focus entirely on your agent logic. Whether you're building customer service agents that maintain context across multi-day conversations, content pipelines with human-in-the-loop approval workflows, or fully automated multi-agent systems coordinating specialized AI models, the durable task extension gives you production-grade reliability, scalability and coordination with serverless simplicity. Key features of the durable task extension include: Serverless Hosting: Deploy agents on Azure Functions with auto-scaling from thousands of instances to zero, while retaining full control in a serverless architecture. Automatic Session Management: Agents maintain persistent sessions with full conversation context that survives process crashes, restarts, and distributed execution across instances Deterministic Multi-Agent Orchestrations: Coordinate specialized durable agents with predictable, repeatable, code-driven execution patterns Human-in-the-Loop with Serverless Cost Savings: Pause for human input without consuming compute resources or incurring costs Built-in Observability with Durable Task Scheduler: Deep visibility into agent operations and orchestrations through the Durable Task Scheduler UI dashboard Click here to create and run a durable agent # Python endpoint = os.getenv("AZURE_OPENAI_ENDPOINT") deployment_name = os.getenv("AZURE_OPENAI_DEPLOYMENT_NAME", "gpt-4o-mini") # Create an AI agent following the standard Microsoft Agent Framework pattern agent = AzureOpenAIChatClient( endpoint=endpoint, deployment_name=deployment_name, credential=AzureCliCredential() ).create_agent( instructions="""You are a professional content writer who creates engaging, well-structured documents for any given topic. When given a topic, you will: 1. Research the topic using the web search tool 2. Generate an outline for the document 3. Write a compelling document with proper formatting 4. Include relevant examples and citations""", name="DocumentPublisher", tools=[ AIFunctionFactory.Create(search_web), AIFunctionFactory.Create(generate_outline) ] ) # Configure the function app to host the agent with durable session management app = AgentFunctionApp(agents=[agent]) app.run() // C# var endpoint = Environment.GetEnvironmentVariable("AZURE_OPENAI_ENDPOINT"); var deploymentName = Environment.GetEnvironmentVariable("AZURE_OPENAI_DEPLOYMENT") ?? "gpt-4o-mini"; // Create an AI agent following the standard Microsoft Agent Framework pattern AIAgent agent = new AzureOpenAIClient(new Uri(endpoint), new DefaultAzureCredential()) .GetChatClient(deploymentName) .CreateAIAgent( instructions: """You are a professional content writer who creates engaging, well-structured documents for any given topic. When given a topic, you will: 1. Research the topic using the web search tool 2. Generate an outline for the document 3. Write a compelling document with proper formatting 4. Include relevant examples and citations""", name: "DocumentPublisher", tools: [ AIFunctionFactory.Create(SearchWeb), AIFunctionFactory.Create(GenerateOutline) ]); // Configure the function app to host the agent with durable thread management // This automatically creates HTTP endpoints and manages state persistence using IHost app = FunctionsApplication .CreateBuilder(args) .ConfigureFunctionsWebApplication() .ConfigureDurableAgents(options => options.AddAIAgent(agent) ) .Build(); app.Run(); Why the durable task extension? As AI agents evolve from simple chatbots to sophisticated systems handling complex, long-running tasks, new challenges emerge: Conversations span multiple days and weeks, requiring persistent state across process restarts, crashes, and disruptions. Tool calls might take longer than typical timeouts allow, needing automatic checkpointing and recovery. High-volume workloads require elastic scaling across distributed instances to handle thousands of concurrent agent conversations. Multiple specialized agents need coordination with predictable, repeatable execution for reliable business processes. Agents sometimes must wait for human approval before proceeding, ideally without consuming resources. The Durable Extension addresses these challenges by extending Microsoft Agent Framework with capabilities from Azure Durable Functions, enabling you to build AI agents that survive failures, scale elastically, and execute predictably through durable and distributed execution. The extension is built on four foundational value pillars, which we refer to as the 4D’s: Durability Every agent state change (messages, tool calls, decisions) is durably checkpointed automatically. Agents survive and automatically resume from infrastructure updates, crashes, and can be unloaded from memory during long waiting periods without losing context. This is essential for agents that orchestrate long-running operations or wait for external events. Distributed Agent execution is accessible across all instances, enabling elastic scaling and automatic failover. Healthy nodes seamlessly take over work from failed instances, ensuring continuous operation. This distributed execution model allows thousands of stateful agents to scale up and run in parallel. Deterministic Agent orchestrations execute predictably using imperative logic written as ordinary code. Define the execution path, enabling automated testing, verifiable guardrails, and business-critical workflows that stakeholders can trust. This complements agent-directed workflows by providing explicit control flow when needed. Debuggability Use familiar development tools (IDEs, debuggers, breakpoints, stack traces, and unit tests) and programming languages to develop and debug. Your agent and agent orchestrations are expressed as code, making them easily testable, debuggable, and maintainable. Features in action Serverless hosting Deploy agents to Azure Functions (with expansion to other Azure computes soon) with automatic scaling to thousands of instances or down to zero when not in use. Pay only for the compute resources you consume. This code-first deployment approach gives you full control over the compute environment while maintaining the benefits of a serverless architecture. # Python endpoint = os.getenv("AZURE_OPENAI_ENDPOINT") deployment_name = os.getenv("AZURE_OPENAI_DEPLOYMENT_NAME", "gpt-4o-mini") # Create an AI agent following the standard Microsoft Agent Framework pattern agent = AzureOpenAIChatClient( endpoint=endpoint, deployment_name=deployment_name, credential=AzureCliCredential() ).create_agent( instructions="""You are a professional content writer who creates engaging, well-structured documents for any given topic. When given a topic, you will: 1. Research the topic using the web search tool 2. Generate an outline for the document 3. Write a compelling document with proper formatting 4. Include relevant examples and citations""", name="DocumentPublisher", tools=[ AIFunctionFactory.Create(search_web), AIFunctionFactory.Create(generate_outline) ] ) # Configure the function app to host the agent with durable session management app = AgentFunctionApp(agents=[agent]) app.run() Automatic session management Agent sessions are automatically checkpointed in durable storage that you configure in your function app, enabling durable and distributed execution across multiple instances. Any instance can resume an agent's execution after interruptions or process failures, ensuring continuous operation. Under the hood, agents are implemented as durable entities. These are stateful objects that maintain their state across executions. This architecture enables each agent session to function as a reliable, long-lived entity with preserved conversation history and context. Example scenario: A customer service agent handling a complex support case over multiple days and weeks. The conversation history, context, and progress are preserved even if the agent is redeployed or moves to a different instance. # First interaction - start a new thread to create a document curl -X POST https://your-function-app.azurewebsites.net/api/agents/DocumentPublisher/threads \ -H "Content-Type: application/json" \ -d '{"message": "Create a document about the benefits of Azure Functions"}' # Response includes thread ID and initial document outline/draft # {"threadId": "doc789", "response": "I'll create a comprehensive document about Azure Functions benefits. Let me search for the latest information... [Document Draft] # Benefits of Azure Functions\n\n## Introduction\nAzure Functions is a serverless compute service that enables you to run event-driven code without managing infrastructure...\n\n## Cost Efficiency\n- Pay only for execution time\n- No charges for idle resources\n- Automatic scaling reduces over-provisioning...\n\n## Developer Productivity\n- Multiple language support (C#, Python, JavaScript, Java)\n- Integrated development tools and CI/CD...\n\n## Scalability\n- Automatic scaling based on demand\n- Handle millions of requests seamlessly...\n\nReferences: [Azure documentation, serverless computing studies]"} # Second interaction - continue the same thread to refine the document curl -X POST https://your-function-app.azurewebsites.net/api/agents/DocumentPublisher/threads/doc789 \ -H "Content-Type: application/json" \ -d '{"message": "Can you add a section about integration with other Azure services?"}' # Agent remembers the Azure Functions document context and adds the requested section # {"threadId": "doc789", "response": "I've added a comprehensive integration section to your Azure Functions document:\n\n## Integration with Azure Services\n\n### Azure Storage\nSeamless triggers and bindings for Blob Storage, Queue Storage, and Table Storage enable event-driven architectures...\n\n### Azure Event Grid & Event Hubs\nProcess real-time event streams and implement publish-subscribe patterns at scale...\n\n### Azure Cosmos DB\nBuilt-in bindings for document database operations with automatic change feed processing...\n\n### Azure Service Bus\nReliable message processing with enterprise messaging features...\n\n### Azure AI Services\nEasily integrate OpenAI, Cognitive Services, and AI Search for intelligent applications...\n\nThe document now includes this section after the Scalability section. Would you like me to add use cases or deployment best practices?"} Deterministic multi-agent orchestrations Coordinate multiple specialized durable agents using imperative code where you define the control flow. This differs from agent-directed workflows where the agent decides the next steps. Deterministic Orchestrations provide predictable, repeatable execution patterns with automatic checkpointing and recovery. Example scenario: An email processing system that uses a spam detection agent, then conditionally routes to different specialized agents based on the classification. The orchestration automatically recovers if any step fails and completed agent calls are not re-executed. # Python app.orchestration_trigger(context_name="context") def document_publishing_orchestration(context: DurableOrchestrationContext): """Deterministic orchestration coordinating multiple specialized agents.""" doc_request = context.get_input() # Get specialized agents from the orchestration context research_agent = context.get_agent("ResearchAgent") writer_agent = context.get_agent("DocumentPublisherAgent") # Step 1: Research the topic using web search research_result = yield research_agent.run( messages=f"Research the following topic and gather key information: {doc_request.topic}", response_schema=ResearchResult ) # Step 2: Generate outline based on research findings outline = yield context.call_activity("generate_outline", { "topic": doc_request.topic, "research_data": research_result.findings }) # Step 3: Write the document with the research and outline document = yield writer_agent.run( messages=f"""Create a comprehensive document about {doc_request.topic}. Research findings: {research_result.findings} Outline: {outline} Write a well-structured, engaging document with proper formatting and citations.""", response_schema=DocumentResponse ) # Step 4: Save and publish the generated document return yield context.call_activity("publish_document", { "title": doc_request.topic, "content": document.text, "citations": document.citations }) Human-in-the-loop Orchestrations and agents can pause for human input, approval, or review without consuming compute resources. Durable execution enables orchestrations to wait for days or even weeks while waiting for human responses, even if the app crashes or restarts. When combined with serverless hosting, all compute resources are spun down during the wait period, eliminating compute costs until the human provides their input. Example scenario: A content publishing agent that generates drafts, sends them to human reviewers, and waits days for approval without running (or paying for) compute resources during the review period. When the human response arrives, the orchestration automatically resumes with full conversation context and execution state intact. # Python app.orchestration_trigger(context_name="context") def content_approval_workflow(context: DurableOrchestrationContext): """Human-in-the-loop workflow with zero-cost waiting.""" topic = context.get_input() # Step 1: Generate content using an agent content_agent = context.get_agent("ContentGenerationAgent") draft_content = yield content_agent.run(f"Write an article about {topic}") # Step 2: Send for human review yield context.call_activity("notify_reviewer", draft_content) # Step 3: Wait for approval - no compute resources consumed while waiting approval_event = context.wait_for_external_event("ApprovalDecision") timeout_task = context.create_timer(context.current_utc_datetime + timedelta(hours=24)) winner = yield context.task_any([approval_event, timeout_task]) if winner == approval_event: timeout_task.cancel() approved = approval_event.result if approved: result = yield context.call_activity("publish_content", draft_content) return result else: return "Content rejected" else: # Timeout - escalate for review result = yield context.call_activity("escalate_for_review", draft_content) return result Built-in agent observability Configure your Function App with the Durable Task Scheduler as the durable backend (what persists agents and orchestration state). The Durable Task Scheduler is the recommended durable backend for your durable agents, offering the best throughput performance, fully managed infrastructure, and built-in observability through a UI dashboard. The Durable Task Scheduler dashboard provides deep visibility into your agent operations: Conversation history: View complete conversation threads for each agent session, including all messages, tool calls, and conversation context at any point in time Multi-agent visualization: See the execution flow when calling multiple specialized agents with visual representation of agent handoffs, parallel executions, and conditional branching Performance metrics: Monitor agent response times, token usage, and orchestration duration Execution history: Access detailed execution logs with full replay capability for debugging Demo Video Language support The Durable Extension supports: C# (.NET 8.0+) with Azure Functions Python (3.10+) with Azure Functions Support for additional computes coming soon. Get started today Click here to create and run a durable agent Learn more Overview documentation C# Samples Python Samples8.9KViews3likes8CommentsMicrosoft Foundry Hosted Agents and MCP in Practice: Building Fibey Field Ops
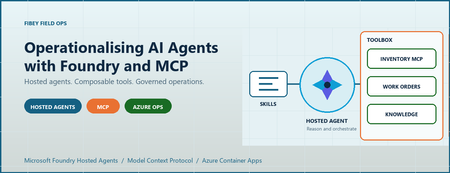
An agent can produce a convincing answer while the system around it is still difficult to deploy, authorize, debug, and recover. For AI engineers and developers, that is often the real gap between a promising prototype and an application people can depend on. Fibey Field Ops makes that gap concrete. It is a synthetic fiber-operations assistant built with Microsoft Foundry Hosted Agents, Model Context Protocol (MCP), and Azure Container Apps. This walkthrough follows one field-service task through the implementation, then examines the deployment and operational decisions behind it. Introduction: the application is more than the model Imagine a technician preparing a fiber work order. Before leaving the depot, they need the job details, available parts, relevant procedures, and network status. Those facts belong to different systems. A useful assistant must retrieve them, combine them, and explain what is missing without inventing an answer. The challenge is not simply selecting a capable model. It is establishing reliable contracts between the model, its tools, the hosting platform, and the application. Fibey demonstrates those contracts with one hosted agent, five instruction skills, eleven operational tools, and five supporting Container Apps. There is an important qualification: Fibey is a protected, synthetic-data demonstration, not a production-ready field-service system. Its gateway mappings and work orders remain in memory, and it does not enforce per-user session ownership or approval of operational writes. Those limitations are useful teaching material rather than details to hide. The Fibey repository contains the implementation, infrastructure, documentation, and presentation deck. Repository access depends on its permissions. 1. Separate reasoning, instructions, and tool execution MCP is a standard interface for discovering and invoking tools. In Fibey, the agent connects to one Microsoft Foundry Toolbox MCP endpoint. The toolbox exposes capabilities backed by an inventory MCP server, a work-orders OpenAPI service, and a Search knowledge base. That common interface does not make the underlying systems identical. OpenAPI still describes an HTTP API, inventory still implements MCP, and knowledge retrieval still depends on indexed documents. The toolbox centralizes the agent-facing integration and connection configuration while preserving those implementation choices. Four terms describe different responsibilities: Concept Responsibility in Fibey Agent Classifies the request, loads instructions, selects tools, and constructs the response Skill An instruction document for a task such as inventory lookup or field briefing Tool An operation with an advertised input schema and a result Toolbox The curated MCP surface and references to downstream connections Fibey's five skills cover inventory lookup, work-order management, knowledge retrieval, work-order preparation, and field briefings. The last two coordinate several tools; they do not create additional agents. The configured toolbox exposes eleven operational tools directly: six inventory/status operations, four work-order operations, and one knowledge-retrieval operation. The agent uses their actual names and schemas. Discovery wrappers such as tool_search and call_tool are relevant only when a toolbox exposes them; they are not mandatory steps before every call. This distinction matters when debugging. A missing wrapper is not necessarily a broken integration. A skill mentioning a capability is also not proof that the runtime can invoke it. The current tool schema is the executable contract. 2. Follow the hosted Azure architecture Microsoft Foundry hosts the agent container and exposes its endpoint. Azure Container Apps (ACA) hosts the application services around it. The deployment source of truth is azure.yaml , which declares the GPT-5.4-mini model deployment and the hosted agent's Responses 2.0.0 protocol. The design keeps the browser-facing application separate from agent execution and backend integration. That makes it easier to inspect each boundary, but it does not make the whole deployment private or remove the need for application authorization. Treat GPT-5.4-mini as the sample's configured baseline, not a claim that it is optimal for every workload. When evaluating another model, measure tool-selection accuracy, schema compliance, grounded answers, latency, and cost per completed task rather than choosing from a fluent demo response alone. The engineering architecture expands this presentation view with resource ownership, identities, configuration, and telemetry paths. The application request path The browser signs in through Microsoft Entra ID at the UI's ACA authentication boundary. An explicit allowlist restricts access to the intended user. Nginx serves the React application and proxies chat requests to the internal FastAPI gateway. The gateway invokes the Foundry-hosted agent using its managed identity. Server-sent events (SSE), a streaming HTTP format, carry answer text, tool activity, citations, failures, and completion back to the UI. Gateway and dashboard ingress are internal to the ACA environment. Inventory and work orders have external ingress so the toolbox can reach them, but their operational endpoints require separate API keys. External accessibility is not anonymous access, and internal ingress is not a complete network-isolation strategy. The knowledge and status paths The knowledge pipeline starts with eight Markdown documents in the repository. A setup script uploads them to a private Blob Storage container, configures a Search data source and indexer, verifies ingestion, and creates the knowledge source and knowledge base used by Foundry IQ. This is not an embedding pipeline assembled implicitly by the chat application. The current configuration uses minimal reasoning and extractive retrieval, with defaults of three output documents and 6,000 output tokens. Its knowledge-base configuration and MCP endpoint use preview APIs, which need lifecycle and support review before production adoption. Network status takes a different path. Inventory's get_network_status tool reads the configured internal HTML dashboard. It is a narrow HTTP fetch, not browser automation, arbitrary website navigation, or a real operational clearance. Azure Container Registry supplies container images. ACA logs go to Log Analytics. Hosted code enables OpenTelemetry, the standard instrumentation framework for traces and metrics, but the repository does not provision Application Insights. The project's linked trace destination must be configured and verified separately. 3. Trace a work-order briefing through the implementation The most useful demonstration starts with one concrete request: prepare a technician for a job. The field-briefing skill provides the instructions for combining work-order data, inventory, procedures, and status without pretending that one backend contains everything. Use a request such as the following in a prepared synthetic environment. The exact wording and tool order may vary; the important evidence is which operations succeeded and which facts support the answer. Brief me on WO-007, including stock, relevant procedures, safety, and network status. The intended flow is: Load the field-briefing instructions and retrieve WO-007. Identify required parts and use a batch stock check when several parts need checking. Combine procedure and safety questions into one focused knowledge retrieval. Read the configured synthetic status dashboard through inventory MCP. Produce a briefing grounded in successful results, with source references and explicit gaps. Batching is a useful engineering choice, not a claim of a measured performance improvement. One batch stock call avoids unnecessary repeated requests. Combining related retrieval questions can also reduce duplicate context and tool traffic. This screenshot was captured from an authenticated deployment. The displayed briefing identifies an unavailable connector kit and available test equipment. It illustrates a specific synthetic response, not current stock or a benchmark. Use the supported hosted integration The relevant implementation is the hosted entrypoint. It uses FoundryToolbox from agent_framework_foundry_hosting , a FoundryChatClient , a skills provider, and ResponsesHostServer.run_async() . The hosting helper does more than attach a bearer token. It authenticates MCP requests and forwards the hosted runtime's per-request call ID. Replacing it with a generic transport can lose context that the platform expects. The entrypoint also closes credentials and clients when execution exits. Hosted skill discovery prefers published skills when available and retains bundled instructions as a fallback in auto mode. Explicit mcp mode fails if published skills cannot be loaded; file mode uses the bundled documents. This makes the fallback intentional rather than silently running without the task instructions. Distinguish history from compute affinity The gateway maintains two hosted mappings. previous_response_id links conversation history, while agent_session_id preserves affinity to the hosted compute session. Losing one is not equivalent to losing the other. Both mappings are held in gateway memory, which is why it remains at one replica. A UUID (universally unique identifier) is a conversation handle, not proof of ownership. Reset clears the local mappings but does not reset work orders or delete the old remote compute session. There is also a privacy distinction between storage and telemetry. Gateway requests use stored Responses history, while the agent's model-call options use store: false . Sensitive tracing being disabled does not mean all conversation persistence is disabled. 4. Run locally without confusing development and cloud boundaries Local development is useful for inspecting the gateway and agent without rebuilding the hosted image. It still calls a real Foundry project, model, and toolbox. It is not an offline simulation, and tool writes can affect the configured synthetic backend. Use Python 3.12+, uv, Node.js 24 LTS, and an authorized Azure developer identity. The commands below run from the repository root in PowerShell. Keep the existing dependency locks and copy .env.example only when creating a new local configuration. uv sync --frozen Copy-Item .env.example .env Set FOUNDRY_PROJECT_ENDPOINT , FOUNDRY_MODEL , and TOOLBOX_MCP_URL in the ignored .env . Use your environment's actual values. Backend API keys belong in Foundry connections, not in the browser or prompts. Start the gateway: az login uv run --frozen uvicorn fibey.gateway.api_server:app --host 127.0.0.1 --port 8080 In another terminal, start the UI: Set-Location ui npm ci npm run dev Open http://localhost:5173 . Vite forwards /api to the gateway on port 8080. These development servers do not reproduce the cloud Entra boundary, and a cloud toolbox cannot reach your workstation's localhost . Inspect the API progressively With the local gateway running, start with a health request in a separate PowerShell terminal: $base = "http://127.0.0.1:8080" Invoke-RestMethod "$base/api/health" Next, create a UUID conversation and submit one synthetic request: $session = [guid]::NewGuid().ToString() $body = @{ message = "Show me WO-007."; session_id = $session } | ConvertTo-Json -Compress $response = Invoke-WebRequest "$base/api/chat" -Method Post -ContentType "application/json" -Body $body $response.Headers["X-Session-Id"] $response.Content This prints the completed SSE body rather than animating the stream. Reuse the same session for a follow-up by extracting a small helper: function Invoke-FibeyTurn { param([string] $Message, [string] $SessionId) $payload = @{ message = $Message; session_id = $SessionId } | ConvertTo-Json -Compress $result = Invoke-WebRequest "$base/api/chat" -Method Post ` -ContentType "application/json" -Body $payload return $result.Content } Invoke-FibeyTurn -Message "What parts does that work order need?" -SessionId $session The helper uses $base and $session from the preceding examples. It makes continuity explicit without hiding the API contract. The browser remains the better place to watch incremental text and activity. See local development for reset behavior and supporting-service details. 5. Deploy artifacts and infrastructure together Fibey's initial deployment is intentionally staged. A container image, its target port, its health probes, its registry association, and its runtime permissions must agree. Successfully building an image does not establish that agreement. The first supporting-infrastructure pass creates placeholder apps on port 80. Once all five real images have been published, a second pass applies the images with their application ports and probes. Plain azd deploy of a supporting service is not the initial port-switch mechanism for this sample. The deployment guide gives the complete sequence and prerequisites: Select the intended environment and provision the Foundry layer. Configure project aliases, the Entra application, the allowed user, and separate API keys. Provision placeholder supporting apps and verify scoped access and registry identity associations. Publish all five supporting images and confirm every image setting is populated. Provision supporting infrastructure again to apply the matching images, ports, and probes. Run knowledge setup, then toolbox setup. Deploy fibey-agent and perform protected-path acceptance checks. For example, this publication step comes after placeholders and access checks, not at the start of an unconfigured environment: azd publish status-dashboard azd publish inventory-mcp azd publish work-orders-api azd publish gateway azd publish ui Only after all five SERVICE_*_IMAGE_NAME settings exist should the next azd provision infra apply them. Keep those settings: an empty value selects a placeholder again. This is where DevOps becomes tangible. Review source, Bicep, locks, schemas, skills, and configuration together; record accepted image references, model configuration, toolbox version, and hosted-agent version. GitOps adds controlled reconciliation of reviewed desired state. The repository supplies the ingredients, not an existing CI/CD pipeline or GitOps controller. Toolbox promotion deserves the same discipline. The unversioned consumer endpoint follows the published default version. A version-specific developer endpoint can test a candidate before promotion. Updating a shared connection or default can affect consumers without rebuilding their images, so Git history alone is not a rollback mechanism. 6. Treat governance, observability, and scale as separate concerns Role-based access control (RBAC) grants an identity permission at a resource scope. The control plane creates and configures Azure resources; the data plane performs application work such as invoking agents, querying Search, or reading blobs. The identities used across those operations are not interchangeable. In particular, a successful UI login is not automatic end-user identity passthrough to every tool, and resource provisioning permissions do not establish all runtime permissions. Boundary Identity or credential Browser to UI Entra user, application registration, and user allowlist Gateway to Foundry Gateway managed identity with project-scoped invocation access Hosted agent to model and toolbox Foundry-provided runtime agent identity Toolbox to inventory and work orders Separate API keys stored in project connections Toolbox to Search knowledge base Foundry project managed identity Search indexer to documents Search managed identity with Blob reader access Image delivery adds another boundary: each supporting app needs both AcrPull and a registry association selecting its identity. The Foundry project identity used for infrastructure operations is also distinct from the hosted agent's runtime identity. Approval must exist outside the prompt Fibey's synthetic work-order writes run without an enforced human approval round trip. That is appropriate to understand in a disposable demo and inappropriate to conceal when discussing production. The hosted toolbox documentation is explicit: approval metadata alone does not block tools/call . The runtime must pause, collect a decision, and resume or reject the exact proposed operation. A prompt saying "ask first" is not equivalent to that control. Real writes need server-side authorization, approval tied to the arguments, idempotency, and a durable audit record. If a write's response is uncertain, read its state before retrying. Treat tool results as untrusted data rather than instructions. Debug the boundary that failed The activity sidebar makes tool use visible, but it is not a durable audit log or access to the model's hidden reasoning. Combine it with timestamps, request/session identifiers, ACA logs, and configured hosted traces. Keep sensitive message tracing off unless a controlled investigation explicitly requires it. Verify that a synthetic trace reaches the intended sink; enabled instrumentation alone does not prove ingestion. Symptom First checks UI returns 502 Gateway revision, target port, fixed Nginx upstream, SNI, and certificate trust Agent or tool returns 401/403 Identity, token audience, role scope, and downstream connection credential Knowledge retrieval fails Indexer completion, project Search role, API version, and advertised input schema Briefing receives 429 Model quota, concurrency, retrieval budgets, and repeated tool calls Stream ends early Terminal response event, timeout, malformed SSE, and transport failure The gateway must surface failed or truncated streams rather than treating partial text as a completed action. A final stream terminator after an error is not application success. Scale only after identifying state and capacity limits Foundry manages hosted runtime capabilities, but it does not externalize Fibey's gateway mappings or in-memory work orders. Adding replicas before redesigning that state would undermine continuity and consistent updates. Model throughput, hosted compute, downstream API capacity, Search, and ACA are separate constraints. Measure latency, errors, tokens, tool counts, and recovery under concurrent load. Registry storage/builds, model inference, compute, Search, Blob Storage, and telemetry all have costs; using a managed platform does not remove the need for budgets. 7. Evaluate the result before adding more agents The practical result is an inspectable workflow that combines heterogeneous systems into a grounded response. We can demonstrate inventory lookup, a synthetic work order, cited knowledge, a fixed status fetch, and a combined briefing through one agent-facing toolbox. That is functional evidence, not a production certification or benchmark. This post does not establish latency percentiles, cost per successful task, throughput, or availability under load. Those measurements should be acceptance criteria for an adaptation, not numbers inferred from a screenshot. Multi-agent coordination is a possible next design, not deployed Fibey behavior. A coordinator could delegate read-only inventory and procedure tasks while a restricted specialist handles approved writes. Each handoff would need typed inputs/results, correlation IDs, deadlines, cancellation, and budgets. Sharing a toolbox alone does not implement that coordination. Specialists also introduce additional failure paths, identity decisions, and state. Start with them only when task complexity, ownership, or isolation requirements justify the cost. The current five skills already provide modular instructions without creating five independently operated agents. 8. Summary: reuse the engineering boundaries Fibey's reusable pattern is the separation of model reasoning, task instructions, tool contracts, hosted execution, and operational controls. MCP gives the agent a common tool interface; Foundry supplies managed hosting and integration capabilities. The application team remains responsible for the guarantees around its data and actions. Start with one workflow and verify each boundary. Then add durable state, per-user authorization, enforced approvals, secret rotation, appropriate networking, evaluation, and recovery before introducing real operational data or more autonomous behavior. For a practical starting point, use the repository, follow the deployment guide, and reproduce the session walkthrough with synthetic data. The presentation deck provides the same architecture and demo sequence for a team discussion. References The repository describes what this sample implements. Microsoft documentation describes the surrounding platform capabilities, responsibilities, and supported integration contracts. Read both before adapting the solution, especially where preview APIs, identity behavior, or approval enforcement affect your requirements. Fibey Field Ops repository Fibey engineering architecture Fibey deployment guide Fibey toolbox integration Microsoft Foundry hosted agents Use a toolbox with a hosted agent Official Python hosted-agent toolbox sample
Azure function require private git package
At the moment we are deploying our python application to a server-less azure function app. For this we use the kudu config-zip deployment. az functionapp deployment source config-zip -g "xxxx" -n "xxxx" --src "xxxx.zip" --build-remote We also want a remote build, because this will install the correct version of the packages. Because some packages have different versions voor different python versions (e.g. 3.8 vs 3.10) and different environment (windows vs linux). The remote build will make sure the correct packages are installed, cause the build (azure's default oryx) will run in the same environment. Recently we moved some of our code to another package. This package is shared by multiple other applications. To install it, we add it to our requirements.txt: git+ssh://Email address removed/xxxxx/xxxxx.git@f4e2bf2e3dxxxxxxxxx This works perfect on our local machines. But not once we deploy to azure. Unfortunately there are no logs. Well the logs shows "oryx build...." and that's it. There is no way to access the build logs. Anyway, we know the cause of the issue: the build doesn't have access to the repository. We do have a ssh key, which can be used to access the git repo. But we have no clue how to pass it to the orxy builder. We tried to make a work around with the "PRE_BUILD_COMMAND" environment variable, but since there are no logs, we cannot determine what is failing during the build. So we cannot install private python packages with azure serverless functions. We see two ways to solve this issue, but for neither we have a clue how to do it: Make the orxy builder use the ssh key Do a local build and push it to the azure function Did some tried this before or can give someone some pointers how to get started on this?1.6KViews1like1CommentBuilding Autonomous Agents with Microsoft Agent Framework and GitHub Copilot SDK Part 2/5
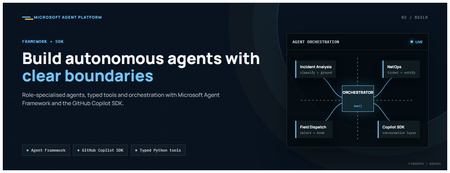
This is the second post in our series on the Microsoft agent platform. Here we dive deep into building autonomous agents, the development experience, the Microsoft Agent Framework, tool design patterns, and how the GitHub Copilot SDK brings conversational AI to your agent system. All examples reference the FibreOps repository, an autonomous fibre outage response system demonstrated at Microsoft Build BRK241. The Microsoft Agent Framework The Microsoft Agent Framework (now GA) provides a unified programming model for building agents. It supports multiple backends through a single .run() contract: Hosted — FoundryAgent connected to a Prompt Agent published to Microsoft Foundry Agent Service. Foundry — Agent + FoundryChatClient with the definition resolved locally (ideal for prompt iteration). Local — Deterministic LocalAgent for offline development and testing. This design means your orchestration code never changes regardless of where the agent runs. The factory pattern in FibreOps selects the backend at startup: # src/fibreops/agents/factory.py — simplified from agent_framework_foundry import FoundryAgent from agent_framework import Agent, FoundryChatClient def build_agent(role: str, backend: str, config: Config): if backend == "hosted": return FoundryAgent(agent_id=config.foundry_agents[role]) elif backend == "foundry": return Agent( instructions=get_instructions(role), chat_client=FoundryChatClient(endpoint=config.endpoint), tools=get_tools(role), ) else: return LocalAgent(role=role) Set FIBREOPS_AGENT_BACKEND to override the backend, or leave it as auto for intelligent detection. Designing Role-Specialised Agents FibreOps demonstrates a key pattern: role specialisation. Rather than one monolithic agent, the system uses three focused agents, each with a clear responsibility boundary: Agent Role Tools Available IncidentAnalysisAgent Classify severity, find root cause, retrieve SOP Knowledge (SOPs + topology), Web IQ, Work IQ NetOpsCoordinatorAgent File D365 incident, post Teams notice Ticketing, Teams, Memory FieldDispatchAgent Select engineer, book resource, update team Dispatch, Teams, Voice Why Role Specialisation? Focused system prompts — Each agent has a tightly scoped instruction set, reducing hallucination and improving reliability. Independent evaluation — You can score each agent separately against role-specific criteria. Parallel development — Teams can iterate on agents independently. Selective upgrade — Swap one agent's model or implementation without touching others. Tool Design: Typed Python Functions Tools in the Microsoft Agent Framework are typed Python functions that the runtime supplies to the hosted agent definition. FibreOps demonstrates several tool categories: Knowledge Tools # src/fibreops/tools/knowledge.py — simplified def sop_lookup(node_id: str, signal_type: str) -> dict: """Retrieve the Standard Operating Procedure for a given signal type. Args: node_id: The fibre node identifier (e.g., FN-LDN-001) signal_type: The type of signal (loss_of_light, high_ber, signal_degradation) Returns: SOP with steps, escalation path, and estimated resolution time. """ # Load from local markdown SOPs or Foundry IQ ... def web_iq_search(query: str, *, limit: int = 5) -> list[dict]: """Search public web for context relevant to the incident. Grounding against roadworks, weather, power outages, splice guidance. Falls back to deterministic fixtures when endpoint is unset. """ ... def work_iq_search(query: str, *, limit: int = 5) -> list[dict]: """Search enterprise knowledge for context relevant to the incident. Site surveys, SLA tiers, competency matrix, MTTR trends. """ ... Integration Tools # src/fibreops/tools/teams.py — simplified def post_outage_notice( incident_id: str, node_id: str, severity: str, summary: str, engineer: str | None = None, ) -> dict: """Post an Adaptive Card outage notice to the configured Teams channel. If TEAMS_WEBHOOK_URL is not set, appends to state/teams_outbox.jsonl for offline review. """ card = build_adaptive_card(incident_id, node_id, severity, summary, engineer) if config.teams_webhook_url: requests.post(config.teams_webhook_url, json=card) else: append_to_outbox(card) return {"status": "posted", "incident_id": incident_id} Design Principles for Agent Tools Typed parameters with docstrings — The runtime uses type hints and docstrings to generate the tool schema for the LLM. Graceful degradation — Every tool works offline by falling back to local fixtures or file-based state. Idempotent where possible — Tools that create resources return existing records if called with the same parameters. Observable — Every tool invocation emits an OpenTelemetry span for tracing and debugging. The Orchestrator Pattern The orchestrator drives signals through the agent pipeline. It is deliberately simple — a linear flow with error handling: # src/fibreops/orchestrator.py — simplified async def handle_signal(signal: TelemetrySignal) -> RunResult: """Process a telemetry signal through the agent pipeline.""" # Stage 1: Incident Analysis analysis = await incident_agent.run( f"Analyse this signal: {signal.model_dump_json()}" ) # Stage 2: NetOps Coordination coordination = await netops_agent.run( f"Coordinate response for: {analysis.summary}" ) # Stage 3: Field Dispatch dispatch = await dispatch_agent.run( f"Dispatch engineer for incident: {coordination.incident_id}" ) return RunResult( signal=signal, analysis=analysis, coordination=coordination, dispatch=dispatch, ) The orchestrator honours the same contract regardless of backend — hosted , foundry , or local — because all backends implement await agent.run(prompt) . GitHub Copilot SDK Integration (GA) The GitHub Copilot SDK enables conversational interaction with your agent system. FibreOps implements FibreOpsCopilotClient with the same interface as github/copilot-sdk : # src/fibreops/sdk/__init__.py — simplified from fibreops.sdk.client import FibreOpsCopilotClient client = FibreOpsCopilotClient() session = client.create_session() # Query agent status response = session.send_and_wait("status") print(response.text) # Human-readable summary print(response.data) # Structured JSON # Inject a telemetry signal via conversation response = session.send_and_wait(json.dumps({ "signal_id": "sig-demo", "node_id": "FN-LDN-001", "signal_type": "loss_of_light", "severity": "critical" })) The adapter routes prompts by shape: JSON signal-shaped dicts — Forwarded to the orchestrator for processing. Free-form text — Answered by a deterministic responder ( help , status , nodes , engineers , optimiser , dispatch ). Drive it from the terminal: python -m fibreops.demo chat "help" python -m fibreops.demo chat "status" python -m fibreops.demo chat '{"signal_id":"sig-demo","node_id":"FN-LDN-001","signal_type":"loss_of_light","severity":"critical"}' Or hit the embedded HTTP endpoint when the NOC console is running: Invoke-RestMethod -Method Post http://127.0.0.1:8800/sdk/chat -Body '{"prompt":"status"}' -ContentType application/json Development Workflow with Foundry Toolkit for VS Code The Foundry Toolkit for VS Code provides an integrated development experience: Author prompts — Edit system instructions with live preview and token counting. Test locally — Run against the foundry backend with FoundryChatClient pointing at your development model. Iterate fast — The foundry backend resolves definitions locally, so prompt changes take effect immediately without republishing. Publish when ready — python -m fibreops.demo publish creates hosted Prompt Agents in Foundry. Multi-Model Support The Microsoft Agent Framework supports multiple models. FibreOps defaults to gpt-4.1-mini (the model available in most demo Foundry accounts), but any chat-completions deployment works: # .env AZURE_AI_MODEL_DEPLOYMENT=gpt-4.1-mini # or gpt-4o-mini, gpt-4o, gpt-4.1 The framework also supports Claude Code connectors and Magentic-One for multi-agent collaboration scenarios. Testing Strategy FibreOps demonstrates a layered testing approach: Unit tests — Test tools in isolation with mocked dependencies. Local backend tests — Run the full pipeline with LocalAgent for deterministic assertions. Integration tests — Run against real Foundry agents with pytest -q . Rubric evaluation — The optimizer scores every run against defined criteria. # Run the test suite .\.venv\Scripts\python.exe -m pytest -q Key Takeaways The Microsoft Agent Framework provides a unified .run() contract across hosted, foundry, and local backends. Role specialisation keeps agents focused, testable, and independently evolvable. Tools are typed Python functions with docstrings — the runtime generates schemas automatically. The GitHub Copilot SDK (GA) enables conversational interaction with any agent system. Graceful degradation means the entire system works offline for development. The factory pattern lets you switch backends without changing orchestration code. Next Steps Clone the FibreOps repository and run python -m fibreops.demo --signals 3 Microsoft Agent Framework documentation Next in this series: Running Hosted Agents in Microsoft Foundry Agent Service
Vector search finds candidates. Reranking decides what your RAG app reads
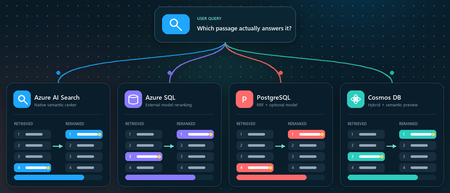
You ask a retrieval-augmented generation (RAG) application a question. Vector search returns ten passages that are clearly related to the topic. The passage that actually contains the answer, however, is ranked seventh, while the language model receives only the first five. Retrieval did not completely fail. It found the evidence, but ordered it below less useful context. Reranking addresses that gap between a passage that is semantically similar and a passage that is relevant to the user's specific question. This article demonstrates that pattern in four Azure services using the Stanford Question Answering Dataset (SQuAD). The goal is not to declare a winning service or publish a quality benchmark. It is to show where retrieval, rank fusion, and model-based reranking run in each architecture, and to illustrate how the position of a known source passage can change. What this demonstration establishes The examples show rank movement for three selected questions. They do not establish that one reranker or service is universally more accurate. A production decision requires a larger, representative query set and aggregate relevance, latency, and cost measurements. Get the full Python implementation: pauldj54/azure-vector-reranking-squad Retrieval and reranking are different stages A production search pipeline commonly uses two stages: Retrieve for recall. Fast retrieval narrows a large corpus to a bounded candidate set. It can use vector search, keyword search, or both. Rerank for precision. A more expensive model evaluates only those candidates against the original query and produces the final order. Reciprocal Rank Fusion (RRF) belongs between those two ideas. RRF is a model-free rank aggregation method that merges independent result lists, usually vector and keyword results. For a document d, a typical score is: RRF(d) = ∑ r ∈ R 1 k + rank r (d) Here, R is the set of ranked lists and k is commonly 60. RRF works with positions rather than raw scores, so it can combine signals such as cosine distance and BM25 without pretending their score scales are comparable. This gives a clearer three-part vocabulary: Stage Purpose Typical mechanism Retrieve Find broad candidate set Vector search, BM25, filters Fuse Combine independent rankings RRF Rerank Reassess query-document relevance Semantic ranker or cross-encoder RRF often improves hybrid retrieval when exact names, dates, identifiers, or terms matter. A learned reranker can then read the query and each candidate together, capturing interactions that separately generated embeddings can miss. The learned stage costs more, so it should operate on tens of candidates rather than the whole corpus. The following image describes the general process: Why use SQuAD for this demonstration? SQuAD 1.1 contains crowd-written questions over more than 500 Wikipedia articles. Its packaged splits contain 87,599 training rows and 10,570 validation rows. Each row includes a question, a context passage, and one or more answer spans inside that passage. That source-context mapping gives this demonstration a useful label: the context associated with a question is treated as its gold passage. We can then inspect whether each search stage moves that passage up or down. This is convenient, but it is not a perfect passage-ranking benchmark. SQuAD was designed for extractive question answering, and another passage in the corpus might also answer a question. The gold context is therefore a reproducible reference, not proof that every other passage is irrelevant. The results shown here use the 2,067 unique contexts in the SQuAD validation split and 1,536-dimensional embeddings. The repository default should be set to the same corpus size before treating the screenshots or rank transitions as directly reproducible. Three illustrative questions Question Expected answer Gold context According to game stats, which Super Bowl 50 quarterback had his worst year since his first NFL season? Peyton Manning 12, Super Bowl 50 What else did Tesla do for work at this time? Various electrical repair jobs 165, Nikola Tesla Who acts as laborer, paymaster, and design team for a renovation project? The property owner 1306, Construction Each notebook selects a seeded demonstration question when it runs. The three saved examples were collected across separate runs; the current notebooks do not execute all three questions in one pass. A benchmark harness should iterate over a fixed question list and save all stage results in one structured output. Capability boundaries at a glance Service Retrieval and Fusion Learned Reranking Boundary to Keep in Mind Azure AI Search Native keyword and vector retrieval with native RRF Built-in semantic ranker Semantic ranking only reorders the retrieved top 50 Azure SQL Database Exact vector retrieval in the current notebook External Cohere model invoked through native REST procedure SQL issues the HTTPS request; Foundry performs inference PostgreSQL Flexible Server pgvector plus hand-written SQL RRF over full-text search Optional external Cohere call from Python Retrieval primitives are native; this RRF query and Cohere path are application code Azure Cosmos DB for NoSQL Native vector search and native hybrid RRF SDK-integrated Semantic Reranker, currently preview Reranking is a separate inference call over at most 50 supplied documents Azure AI Search: native hybrid retrieval and semantic ranking How it works: Azure AI Search provides the most integrated pipeline in this demonstration. A hybrid query runs keyword and vector retrieval, combines the lists with RRF, and passes up to the top 50 results to the built-in semantic ranker. The semantic ranker assigns @search.rerankerScore values from 0 to 4 and can return extractive captions and answers. The semantic configuration identifies the fields that carry the meaning of each document: semantic_search = SemanticSearch( configurations=[ SemanticConfiguration( name=SEMANTIC_CONFIG, prioritized_fields=SemanticPrioritizedFields( title_field=SemanticField(field_name="title"), content_fields=[SemanticField(field_name="content")], ), ) ] ) This tells the semantic ranker which text fields to evaluate. The query then enables semantic ranking after hybrid retrieval: results = search_client.search( search_text=question, vector_queries=[vector_query], query_type="semantic", semantic_configuration_name=SEMANTIC_CONFIG, top=10, ) The important constraint is candidate recall. Semantic ranking does not search the corpus again. If the correct passage is absent from the hybrid top 50, the semantic stage cannot recover it. See 01_azure_ai_search_reranking.ipynb for the complete setup and query path. Test results for Azure AI Search These examples show that semantic reranking improves relevance selectively, not universally. It strongly helps the construction query, moving the correct passage from rank 4 to rank 1, but slightly degrades the Super Bowl and Tesla queries by one position. This reinforces that semantic ranking should be evaluated across a representative query set using aggregate metrics such as MRR or NDCG, rather than judged from a single result. Azure SQL Database: vector retrieval plus external Cohere reranking How it works. The Azure SQL notebook retrieves 20 candidates with exact cosine distance and sends their text to Cohere Rerank v4.0 Fast through sys.sp_invoke_external_rest_endpoint. The vector column and query vector must have the same dimensions. This repository uses 1,536-dimensional embeddings: SELECT TOP (@ candidate_count) context_id, title, content, 1 - VECTOR_DISTANCE( 'cosine', CAST(@ query_vector AS VECTOR(1536)), embedding ) AS similarity FROM dbo.documents ORDER BY similarity DESC; For reranking, we selected Cohere Rerank v4.0 Fast (Cohere-rerank-v4.0-fast), a fast version of Cohere’s fourth-generation relevance-ranking model. The model is deployed in Microsoft Foundry, where its Azure Direct inference endpoint is available in the deployment details within the Foundry portal. Azure SQL can call REST APIs directly using sp_invoke_external_rest_endpoint. Because Azure SQL allowlists Azure AI’s *.cognitiveservices.azure.com domain, we translate the equivalent Foundry endpoint from *.services.ai.azure.com while preserving the Cohere reranking route. from urllib.parse import urlsplit, urlunsplit def sql_compatible_endpoint(endpoint: str) -> str: """Convert an Azure Direct endpoint to Azure SQL's allowed hostname.""" parts = urlsplit(endpoint) if parts.hostname.endswith(".services.ai.azure.com"): resource = parts.hostname.removesuffix(".services.ai.azure.com") hostname = f"{resource}.cognitiveservices.azure.com" elif parts.hostname.endswith(".cognitiveservices.azure.com"): hostname = parts.hostname else: raise ValueError("Expected an Azure AI Services endpoint.") return urlunsplit( (parts.scheme, hostname, parts.path, parts.query, "") ) Then I defined a re-rank with cohere function, starting by loading the endpoint and setting the authentication: def rerank_with_cohere( cursor, question: str, candidates: list[dict], top_n: int = 10, ) -> list[dict]: """ Rerank candidate documents by calling Cohere through Azure SQL. Each candidate must contain a 'content' field. """ if not candidates: return [] sql_endpoint = sql_compatible_endpoint( os.environ["COHERE_RERANK_ENDPOINT"] ) model = os.environ["COHERE_RERANK_MODEL"] access_token = credential.get_token( "https://cognitiveservices.azure.com/.default" ).token headers = json.dumps({"Authorization": f"Bearer {access_token}"}) payload = json.dumps( { "model": model, "query": question, "documents": [row["content"] for row in candidates], "top_n": min(k, len(candidates)), }, ensure_ascii=False, ) cursor.execute( """ DECLARE @url NVARCHAR(4000) = CAST(? AS NVARCHAR(4000)); DECLARE @headers NVARCHAR(4000) = CAST(? AS NVARCHAR(4000)); DECLARE Payload NVARCHAR(MAX) = CAST(? AS NVARCHAR(MAX)); DECLARE Response NVARCHAR(MAX); DECLARE @status INT; EXEC @status = sys.sp_invoke_external_rest_endpoint @url = @url, @method = 'POST', @headers = @headers, Payload = Payload, @timeout = 60, @retry_count = 2, Response = Response OUTPUT; SELECT @status, Response; """, sql_endpoint, headers, payload, ) status, response_text = cursor.fetchone() if status != 0: raise RuntimeError(f"Reranker endpoint returned HTTP status {status}.") response = json.loads(response_text)["result"] You can see the complete implementation in the 02_azure_sql_reranking.ipynb notebook. Test results for Azure SQL Db Across the three sample questions, Cohere reranking consistently moved the correct SQuAD passage closer to the top: from rank 5 to 1 for the Super Bowl question, 3 to 2 for the Tesla question, and 8 to 1 for the construction question. These examples show how vector search provides a strong candidate set, while reranking applies deeper query-document relevance scoring to improve the final ordering. The results are illustrative rather than a complete quality benchmark, so broader evaluation across many queries is still recommended. Azure Database for PostgreSQL flexible server: pgvector, SQL RRF, and an optional model How it works: PostgreSQL makes the pipeline components explicit. The notebook uses pgvector for vector similarity, PostgreSQL full-text search for keyword retrieval, and SQL to implement RRF. Vector retrieval uses cosine distance: SELECT context_id, title, content, 1 - (embedding <= > % (query_vector) s:: vector) AS similarity FROM squad_docs ORDER BY embedding <= > % (query_vector) s:: vector LIMIT % (candidate_count) s; The hybrid query independently ranks vector and keyword hits, then combines positions rather than raw scores: SELECT d.context_id, COALESCE(1.0 / (60 + v.rank), 0) + COALESCE(1.0 / (60 + k.rank), 0) AS rrf_score FROM squad_docs AS d LEFT JOIN vector_hits AS v USING (context_id) LEFT JOIN keyword_hits AS k USING (context_id) WHERE v.context_id IS NOT NULL OR k.context_id IS NOT NULL ORDER BY rrf_score DESC; This is not a built-in PostgreSQL RRF operator. It is transparent, hand-written SQL over native retrieval primitives, which makes weighting and debugging flexible but leaves implementation and tuning with the application team. The notebook's optional learned stage sends the vector candidates from Python to a Foundry deployment of Cohere Rerank v4.0 Fast. This path was chosen because the tested Flexible Server azure_ai extension version expected the older serverless reranking endpoint contract. Microsoft documentation still describes azure_ai.rank() as a preview function whose default model is Cohere Rerank v3.5, even though that model retired on May 14, 2026. Treat this as a version-specific compatibility issue and verify current extension behavior before selecting an architecture. Azure HorizonDB is a different product path. Its AI Model Management feature can provision Cohere Rerank v4.0 Fast as default-reranker, but that management feature is currently a limited preview. It should not be described as a generally available Flexible Server capability. See 03_azure_postgres_reranking.ipynb for the full SQL and optional external model path. Test results for Azure SQL for PostgreSQL Flexible Server The tests show that PostgreSQL vector search provides a useful candidate set, SQL RRF can substantially improve results when keyword evidence is strong, and the Cohere semantic reranker is the most consistent overall: it moved the correct passage to rank 1 in two tests and from rank 3 to rank 2 in the Tesla test. RRF produced the biggest gain for the construction question, moving the correct passage from outside the vector top five to rank 1, but did not improve every query. The scores across stages are not directly comparable because cosine similarity, RRF score, and Cohere relevance use different scales. Azure Cosmos DB for NoSQL: hybrid search with built-in RRF How it works: Azure Cosmos DB for NoSQL supports native hybrid ranking with VectorDistance, FullTextScore, and RRF inside ORDER BY RANK: SELECT TOP K C.context_id, c.title, c.text FROM c ORDER BY RANK RRF( VectorDistance(c.vector, @query_vector), FullTextScore(c.text, @term1, @term2, @term3) ) The notebook extracts distinct terms from the question before building the full-text part of the query. That token selection is application logic and can materially affect the hybrid ranking, so production evaluation should test analyzers, languages, term extraction, and optional RRF weights. Cosmos DB Semantic Reranker is an SDK-integrated preview feature. The application first runs a query, serializes the resulting documents, and submits those documents with the user's context string: result = container.semantic_rerank( context=question, documents=documents, options={ "return_documents": False, "top_k": min(k, len(documents)), "sort": True, "document_type": "json", "target_paths": "title,text", }, ) The service accepts at most 50 documents per rerank call and returns relevance scores from 0 to 1, plus inference latency and token usage. It uses the Microsoft semantic ranking model also used by Azure AI Search. The reranking call requires Microsoft Entra authentication, the appropriate Semantic Reranker role, and an account-linked inference endpoint. The 04_azure_cosmosdb_reranking.ipynb in the shared repo contains and end-to-end implementation. Test results for Azure Cosmos Db The results show that vector search provides a strong baseline, while hybrid RRF and semantic reranking improve different queries in different ways. Hybrid RRF helps when exact keywords matter, moving the construction answer into the top results, while the semantic reranker delivers the strongest overall ordering, promoting the correct construction passage from hybrid rank 3 to rank 1 and improving the Super Bowl answer from rank 5 to rank 2. However, it does not always place the gold passage first, as seen in the Tesla example, confirming that reranking improves relevance but is query-dependent and should be evaluated across a larger test set. What the examples do and do not show The four services expose different ownership boundaries: • Azure AI Search owns hybrid fusion and learned semantic ranking inside the search service. • Azure SQL owns vector retrieval and outbound REST invocation in this example, while Foundry owns model inference. • PostgreSQL supplies vector and full-text primitives; the application owns the RRF SQL and optional Cohere call. • Cosmos DB provides native hybrid RRF and integrates a separate preview inference call through its SDK. Across three selected questions, the known source passage often moved substantially. That supports the practical value of testing a second-stage ranker. It does not prove that semantic reranking always improves top-1 accuracy, that RRF is universally beneficial, or that scores from different stages can be compared directly. Cosine similarity, RRF score, Azure AI Search reranker score, Cohere relevance, and Cosmos DB semantic relevance all have different definitions and scales. Compare rank positions and task-level metrics, not raw values across systems. Turn the demonstration into an evaluation For a production RAG system, convert the notebook pattern into a repeatable evaluation harness: Build a representative labeled query set from real user tasks. Freeze corpus, chunking, embedding model, dimensions, and candidate counts for each run. Record ranks after retrieval, fusion, and learned reranking. Measure Recall@k or Hit@k to verify that retrieval finds relevant evidence. Measure Mean Reciprocal Rank (MRR) when the position of the first relevant result matters. Use NDCG when judgments include multiple passages or graded relevance. Record latency percentiles, inference usage, request cost, and failure rates. Evaluate the generated answer separately for correctness, citation support, and refusal behavior. Also test the operational cases that a three-question demonstration cannot cover: empty keyword results, missing gold passages, long documents, multilingual text, filters, partial outages, token expiration, throttling, model retirement, and low-confidence scores. Practical guidance Retrieve broadly enough that the correct evidence can reach the learned stage. Use RRF when vector and keyword retrieval provide complementary signals. Rerank a bounded candidate set, commonly 20 to 50 passages, and measure the latency cost. Keep citations and source identifiers through every rank transformation. Version the corpus, embedding model, dimensions, query set, and reranker deployment. Do not hard-code assumptions about model endpoints or lifecycle dates. Verify current service documentation and the deployed extension or SDK version. Add thresholds or fallback behavior only after calibrating scores on your own data. Judge the full RAG chain. Better passage order is valuable only when it improves grounded answers for users. Vector search is built to find plausible candidates quickly. Rank fusion can reconcile retrieval signals, and a learned reranker can decide which candidates best address the question. The right architecture depends on where your data lives, which service boundaries you want to operate, and what your evaluation says about quality, latency, and cost. Resources Companion repository Azure AI Search semantic ranker Azure SQL VECTOR_DISTANCE Azure SQL sp_invoke_external_rest_endpoint Azure Database for PostgreSQL AI functions Microsoft Foundry model retirement schedule Azure Cosmos DB hybrid search Azure Cosmos DB Semantic Reranker SQuAD dataset card Dataset attribution Rajpurkar, P., Zhang, J., Lopyrev, K., and Liang, P. (2016). SQuAD: 100,000+ Questions for Machine Comprehension of Text. EMNLP 2016. SQuAD 1.1 is distributed under CC BY-SA 4.0.Learn how to use the four IQs: Web IQ, Work IQ, Fabric IQ, Foundry IQ
We just concluded Microsoft IQ Deep Dive with Python, a three-part livestream series all about Microsoft IQ. We showed how to use the four IQs to ground your AI applications and agents: Work IQ: user-specific retrieval of M365 data, like Teams chats, emails, and calendar events. Fabric IQ: retrieval of data stored in OneLake, via Fabric ontologies, graphs, and data agents. Web IQ: real-time web results with super low latency Foundry IQ: multi-source agentic retrieval on search indexes plus remote sources (including Web IQ, Work IQ, and Fabric IQ) The four IQs are all exposed as MCP endpoints, so you can easily integrate into your own agents, or add to your Foundry agents via the Foundry Toolbox. Check out our code samples for Python notebooks and agents that use each of the MCP servers and APIs. All of the materials from our series are available for you to keep learning from, and linked below: Video recordings of each stream PowerPoint slides that you can use for reviewing or even teaching the material to your own community An annotated write-up of each presentation, so you can quickly read through 🙋🏽♂️ Have follow up questions? Join the weekly Python+AI office hours on Foundry Discord. Microsoft IQ Deep Dive with Python: Foundry IQ 📺 Watch YouTube recording In the first session, we dived into Foundry IQ (Azure AI Search), exploring how it helps agents and applications work with curated knowledge and organizational context. We built knowledge bases in Python and connected them to multiple knowledge sources, including file knowledge sources, search indexes built from ingested data, and the Web IQ MCP server. Then we performed multi-source agentic retrieval on those knowledge bases, which executes queries in parallel and merges the results with state-of-the-art ranking models. Finally, we built agents in Python using Microsoft Agent Framework and grounded their responses in Foundry IQ results three different ways: a custom tool calling the knowledge base API, the knowledge base MCP endpoint, and a Foundry Toolbox. We deployed those agents to Foundry Agent Service as hosted agents and published one to Teams. 🖼️ Slides for this session 📝 Write-up for this session 💻 Code repository with examples: iqdeepdive Microsoft IQ Deep Dive with Python: Work IQ 📺 Watch YouTube recording In the second session, we focused on Work IQ and how it brings workplace context into AI-powered experiences. We compared Work IQ to Microsoft Graph, then explored all three protocols it speaks — A2A, MCP, and REST — with runnable Python notebooks for each. We walked through the 10 generic tools that Work IQ exposes over MCP, including ask, which calls Microsoft 365 Copilot directly, and do_action, the only write path. We also connected Work IQ to a Foundry IQ knowledge base as a knowledge source, so a single query returns a blended answer across indexed HR documents and live work context. Then we wired Work IQ into a Microsoft Agent Framework agent as an MCP tool, and finished with Agent 365 autopilots — agents that get their own Microsoft 365 identity, mailbox, and place in the org chart, and act as themselves rather than on behalf of you. A live demo showed the Work Mate autopilot reading its own mailbox in Teams and emailing a customer directly. 🖼️ Slides for this session 📝 Write-up for this session 💻 Code repository with examples: iqdeepdive Microsoft IQ Deep Dive with Python: Fabric IQ 📺 Watch YouTube recording In the final session, we explored Fabric IQ and how it connects AI experiences to structured business data stored in Microsoft Fabric's OneLake. We introduced the key components of Fabric IQ — ontologies, graphs, semantic models, and data agents — and showed how each one helps describe, organize, and reason over operational data. Ontologies provide a shared business vocabulary that maps entity types, properties, and relationships to actual OneLake data. Graphs offer dedicated graph database capabilities for queries requiring extensive relationship traversal. Semantic models expose Power BI analytics through DAX measures on star-schema tables. Data agents combine all of these behind a single conversational interface that selects the right source and query language automatically. For each component, we demonstrated the Ontology MCP server and Data Agent MCP server for agent integration, and showed how to add each as a knowledge source to Foundry IQ knowledge bases for multi-source retrieval. 🖼️ Slides for this session 📝 Write-up for this session 💻 Code repository with examples: iqdeepdiveLoad testing Copilot Studio agents with Locust and Azure Load Testing
A conversational agent doesn't answer like an API. You send one message. The server returns 200 OK. And then nothing happens. The real answer is still coming, streaming back over a WebSocket as one reply or several. It might take two seconds, or three minutes while the agent thinks, calls a tool, or even builds another agent. So how do you load test an answer that isn't ready when the request says it is? This post builds that test — and one 30-minute run answered it: 253 conversations and 3,212 requests with zero failures, including an agent-creation turn that took 8.68 seconds to reply and 163.71 seconds to finish. Why load test a Copilot Studio agent Conversational agents built with Copilot Studio run on a platform that automatically scales to support increases in demand and load, as documented in Microsoft's performance-testing guidance. That scaling is not infinite. It stays within the environment's capacity, quotas, throttling, and service limits. A turn can also reach custom logic, connectors, and backend services with separate operating limits. Concurrent load can expose latency or failures in either part of the request path. Start by taking a single turn apart. A turn is one user message and everything the agent does to answer it, up to the moment it signals turn.complete. The elapsed time spans several parts of the request path, including the Copilot Studio-managed path and external dependencies. The green zone is the path managed by Copilot Studio: the Direct Line channel that accepts the message, the enhanced orchestration runtime that reasons over the agent's parts (its model, instructions, knowledge, tools, skills, and connected agents), and the reply that streams back one message at a time. The platform automatically scales to support increases in demand and load while coordinating those parts within those same limits. Constraints in this zone can also contribute latency or failures. The amber zone covers everything a turn reaches beyond that managed path. From inside the green zone, the agent's tools call out to these dependencies: custom logic and Power Automate flows; connectors to systems like Salesforce, ServiceNow, SharePoint, and Dataverse; backend APIs and databases; and hosted MCP servers. (A2A connections to remote agents on other platforms existed only for classic agents at the time of this test, so they're out of scope here.) Each dependency has its own configuration and limits. Under load, any part of either zone can add latency or fail; full-agent timings alone do not identify the source. Test each component in isolation Component-level tests help isolate constraints before a full-agent run. Apply representative load directly to the cloud flow, connector, backend API, and MCP server one at a time. The results can show the request rate at which latency rises, throttling appears, or requests begin to fail for that dependency. An isolated run turns a vague "the agent felt slow" into measured component behavior. A full-agent run can then be compared with those results without assuming in advance which part caused the delay. Why test the complete agent under load Testing each component helps find its limit. But users experience the complete conversation, not one component at a time. The agent may take a different path for each message. It may return one reply or several replies. Some steps may also take much longer than others. This is true even when the agent does not call an external system. A load test shows how the complete agent behaves when many users are active. The results help set realistic expectations for response time and reliability: More users can mean slower replies. An agent may respond quickly for one tester but slow down when many conversations run at the same time. Different conversations take different paths. Some work starts only after a user makes a certain choice. A one-message test may never reach that work. The full answer takes longer than the send request. Sending a message is only the start. The response time ends when the agent has returned its last reply for the turn. Real results support better targets. Measured response times and error rates provide a clear baseline for production planning. What this post does This post shows how to build a Python load test for a conversational agent built with Copilot Studio using Locust, a Python load-testing framework that simulates concurrent users. The test communicates with the agent through the Direct Line API, the channel used by the tested client application to exchange messages with the published agent. Direct Line uses HTTP requests to get a token, start a conversation, and send a message. Replies arrive over a WebSocket connection. Each Locust virtual user follows this same path, sends a series of messages, and measures the time until the agent completes each turn. The same Python workload file runs locally and in Azure Load Testing without code changes. Environment-specific settings come from locust.conf locally and locust.azure.conf in Azure. The local validation below uses four virtual users for 15 minutes. The cloud run uses the same two user classes with 16 virtual users for 30 minutes, including text conversations, attachment intake, and selective agent creation. In this post, I: Explain how a conversation works over Direct Line and WebSockets. Build the Locust client one step at a time. Handle complete turns, errors, and file uploads. Run both conversation paths under load: users describing requirements in chat and users submitting requirements as file attachments. Run the same test locally and in Azure Load Testing. The agent under test. The examples use Automatic Agent Creator, a demonstration Copilot Studio agent that reads a business request, asks follow-up questions, and either recommends an integration approach or creates and publishes a new agent. The Direct Line flow can be adapted to other published agents, but conversation behavior, events, and response shapes must be validated for each agent, client, channel configuration, and product version. How a Copilot Studio agent talks over Direct Line The tested agent and client used this shape: open a session, exchange messages while it is alive, and read replies until the agent signals that the turn is done. This load test reproduces that flow end to end so its timings include the reply path, not only the message-send request. Direct Line can deliver replies through a WebSocket stream or HTTP GET polling. Microsoft's performance-testing guidance says to use WebSockets when the client-facing application uses them; HTTP GET remains available when it does not. The tested client used WebSockets, so this harness does too. The base host in every request below is a Direct Line regional endpoint. Get a token Before a client can start a conversation, it needs a conversation token. A Direct Line secret is sent to the token endpoint to request one. Direct Line returns a token for one conversation and an expires_in value that gives the number of seconds until it expires. The client uses this token for the conversation requests that follow. POST {host}/v3/directline/tokens/generate Authorization: Bearer «Direct Line secret» → 200 { "conversationId": "…", "token": "eyJhbGci…", "expires_in": «seconds until expiry» } The tested conversations completed before their returned token expiry. A longer-lived client must use the returned expires_in value and refresh the token before it expires. Start a conversation and open the socket To start a conversation, the client sends the token to Direct Line in an HTTP request. Direct Line returns two important values: a conversationId, which identifies the conversation, and a streamUrl, which is the WebSocket address used to receive replies. The client opens the WebSocket and keeps it open until the conversation ends. POST {host}/v3/directline/conversations Authorization: Bearer «token» → 201 { "conversationId": "…", "streamUrl": "wss://…/stream", "token": "eyJhbGci…" } WS CONNECT wss://…/stream → socket open (HTTP 101) Send a message With the conversation started and the WebSocket open, the client can send the first user message. In Direct Line, a message is represented as an activity. The client sends this activity through an HTTP POST, while the agent's replies return through the open WebSocket. POST {host}/v3/directline/conversations/{id}/activities Authorization: Bearer «token» { "type": "message", "from": { "id": "user-…" }, "text": "…", "locale": "en-US" } → 200 { "id": "…" } The 200 response contains the ID assigned to the activity. It confirms that Direct Line accepted the message, but it does not contain the agent's answer or mean that the agent has finished processing the message. The answer arrives separately through the WebSocket connection. Receive replies until turn.complete After Direct Line accepts the message activity, the agent's replies arrive through the open WebSocket. A turn may contain one agent message or several. When the agent finishes the turn, the stream sends an event named turn.complete. The client ends the read for the current turn when this event arrives. The WebSocket remains open for the next message. Two measurements describe the response time. Although TTFB usually means time to first byte, this harness uses the label for the time to the first complete agent message: TTFB is the time from the start of the send request to the first agent message. ResponseTime is the time from the start of the send request to the last agent message. Note. In this post, TTFB means the time to the first complete agent message, not the first network byte. Typing activities and the turn.complete event are not used as timing endpoints. The first and last agent messages set the measurements. For a turn with one agent message, TTFB and ResponseTime are equal. When the agent first sends an acknowledgment and later sends the completed result, ResponseTime is longer than TTFB. In the Azure run reported later, the agent-creation turn averaged 8.68 seconds to the first message and 163.71 seconds to completion. Note. Direct Line does not provide a general "last message" marker. The standard performance-testing guidance uses replyToId to match replies to the sent message and an inactivity timeout to decide when the response has ended. The new agent experience adds turn.complete as an explicit end-of-turn signal. This client uses that event as the normal stopping point, keeps an overall deadline as a safety check, and uses sender ID because from.role may be missing. Implement one virtual-user conversation One virtual user repeats a small cycle: open a Direct Line conversation, send a turn, receive the replies, record the timing, pause, and close. The excerpts below implement that cycle before Locust adds concurrency. Note. These focused excerpts omit some hardening, debug logging, transcript details, and upload internals. The complete client contains them. The important imports are shown once and reused below: import json # Python standard library: decode WebSocket frames import time # Python standard library: measure turn duration import websocket # websocket-client: open and read the WebSocket from locust import FastHttpUser, between from locust.exception import StopUser json and time come from Python. websocket comes from websocket-client. Locust supplies FastHttpUser, between, and StopUser. Uppercase names such as REPLY_DEADLINE are constants in new_chat_client.py. Open the session: connect() At the top of every task, connect() gives the virtual user a unique id, gets a token, starts a conversation, and opens the WebSocket. The unique id matters later: it's how the client tells the agent's replies apart from its own echoed message. def connect(self): """Get a token, start a conversation, and open the WebSocket.""" self._user_id = "user-" + str(id(self)) self._turn = 0 self._token = self._get_token() if not self._token: raise StopUser() started = self._start_conversation() if not started: raise StopUser() self.conversation_id, stream_url = started self._ws = websocket.create_connection(stream_url, timeout=WS_CONNECT_TIMEOUT) self._ws.settimeout(WS_RECV_TIMEOUT) # each recv() polls for at most a second The token and start calls are ordinary HTTP, wrapped so Locust records each one and marks a bad status as a failure. def _get_token(self): url = self.directline + "/v3/directline/tokens/generate" headers = {"Authorization": "Bearer " + self.direct_line_secret} with self.client.post(url, headers=headers, name=self.label + " token", catch_response=True) as response: if response.status_code != 200: response.failure("token HTTP " + str(response.status_code)) return None body = parse_json(response) if not body or not body.get("token"): response.failure("token response missing 'token'") return None return body["token"] def _start_conversation(self): url = self.directline + "/v3/directline/conversations" with self.client.post(url, headers=self._auth_header(), name=self.label + " start", catch_response=True) as response: if response.status_code not in (200, 201): response.failure("start HTTP " + str(response.status_code)) return None body = parse_json(response) or {} conversation_id = body.get("conversationId") stream_url = body.get("streamUrl") if not conversation_id or not stream_url: response.failure("start response missing conversationId or streamUrl") return None if body.get("token"): self._token = body["token"] return conversation_id, stream_url One turn: say() say() owns one turn: start the clock, send the activity, receive replies, record both timings, and return the last non-empty agent message. metric_name labels the Locust rows, deadline limits the whole turn, and attach selects the upload path. def say(self, text, metric_name=None, deadline=REPLY_DEADLINE, attach=None): """Send one message, wait for the reply, and return the reply text.""" self._turn += 1 start = time.perf_counter() posted_id = self._send(text, attach) if posted_id is None: self._record(start, None, None, metric_name, "", "send failed") raise StopUser() result = self._receive(start, deadline) self._record(start, result.t_first, result.t_final, metric_name, result.text, result.error) if result.error: raise StopUser() return result.text Earlier replies still set the timing boundaries, but result.text contains only the last non-empty message. _send() posts a normal message unless attach selects the upload path explained later. def _send(self, text, attach=None): if attach: return self._send_file(text, attach) # explained in the attachment section activity = {"type": "message", "from": {"id": self._user_id}, "text": text, "locale": "en-US"} url = (self.directline + "/v3/directline/conversations/" + self.conversation_id + "/activities") with self.client.post(url, json=activity, headers=self._auth_header(), name=self.label + " send", catch_response=True) as response: if response.status_code != 200: response.failure("send HTTP " + str(response.status_code)) return None body = parse_json(response) if not body or not body.get("id"): response.failure("send response missing activity id") return None return body["id"] The returned activity ID confirms acceptance, not an answer. The answer arrives on the WebSocket, while Locust records the POST as a separate send row. Read WebSocket frames until the turn ends _receive() reads JSON frames from the open socket. TurnResult keeps the latest text, the first and final message times, and any error: class TurnResult: def __init__(self): self.text = "" # last non-empty agent message self.t_first = None # first agent-message time self.t_final = None # latest agent-message time self.error = "" # non-empty when the turn fails The one-second socket timeout keeps each read responsive; the overall deadline limits the complete turn, including the HTTP send. def _receive(self, start, max_wait=REPLY_DEADLINE): """Read frames until the agent signals 'turn.complete' or the deadline passes.""" result = TurnResult() deadline = start + max_wait while time.perf_counter() < deadline: try: frame = self._ws.recv() except websocket.WebSocketTimeoutException: continue # no data this second; keep waiting if not frame or not frame.strip(): continue payload = json.loads(frame) for activity in payload.get("activities", []): if self._handle_activity(activity, result): return self._finish(result) # saw turn.complete if result.t_final is None and not result.error: result.error = "no final reply (timeout)" return self._finish(result) Each activity has one job: Activity Client action User message echo Ignore it because it came from the virtual user typing Ignore it for response-time measurements Agent message Set the first and latest message times; keep the latest non-empty text trace with an ErrorCode Store the structured turn error event named turn.complete End the read for this turn; keep the WebSocket open _handle_activity() applies the table. _is_bot_reply() filters the user echo and is explained next. def _handle_activity(self, activity, result): activity_type = activity.get("type") if activity_type == "message" and self._is_bot_reply(activity): now = time.perf_counter() if result.t_first is None: result.t_first = now # first reply -> TTFB result.t_final = now # every reply -> ResponseTime result.text = activity.get("text") or result.text return False if activity_type == "trace": code = self._error_code(activity) if code and not result.error: result.error = "bot error: " + describe_error_code(code) return False if activity_type == "event" and activity.get("name") == "turn.complete": return True return False Normally turn.complete ends the read. The deadline is the fallback; a turn with no agent message fails. Record the latency _record() emits TTFB and ResponseTime for a successful turn. A failed turn emits one failed ResponseTime entry instead of a latency value. def _record(self, start, t_first, t_final, metric_name, text, error): name = self.label + " " + (metric_name or ("t" + str(self._turn))) fire = self.environment.events.request.fire if error: fire(request_type="CHAT", name=name + " [ResponseTime]", response_time=None, response_length=0, exception=Exception(error), context={}) return fire(request_type="CHAT", name=name + " [TTFB]", response_time=((t_first or t_final) - start) * 1000, response_length=0, exception=None, context={}) fire(request_type="CHAT", name=name + " [ResponseTime]", response_time=(t_final - start) * 1000, response_length=len(text), exception=None, context={}) Pause between turns and close the conversation The scenario pauses between messages and closes the WebSocket in finally, even when a turn fails. try: self.connect() self.say(requirement, "T01 requirement") self.think(20, 30) self.say("ok", "T02 confirm") finally: self.close() That completes one conversation. Note. This is a trimmed two-turn illustration (T01 requirement then T02 confirm). The demo text scenario reported later runs five turns: T01 requirement, T02 source, T03 target, T04 action (only some conversations reach this branch), and T05 confirm. Assemble the reusable Locust user In new_chat_client.py, the methods above belong to WebSocketChatClient. The class extends FastHttpUser and holds their shared configuration: class WebSocketChatClient(FastHttpUser): """Direct Line WebSocket load client for a new-experience Copilot Studio agent.""" abstract = True host = DIRECTLINE wait_time = between(2, 6) directline = DIRECTLINE direct_line_secret = None # secret mode label = "ws" abstract = True prevents Locust from running the base directly. A scenario subclass supplies the secret, metric label, and messages. wait_time pauses between complete scenario runs, while explicit think() calls pause between turns. Locust can then create many scenario instances that reuse the same conversation methods. Handling the new experience Three behaviors of the new agent experience would quietly break a naive client. Each is a few lines in the methods above. Preview notice. As of July 13, 2026, the Copilot Studio new agent experience is a production-ready preview. Microsoft identifies its documentation as prerelease and subject to change, and states that production-ready previews are subject to the Supplemental Terms of Use for Microsoft Azure Previews. Replies may omit a role In the classic channel, an agent message carries from.role = "bot". In the new experience some replies arrive with only from.id and no role at all. Keying off role == "bot" would drop those messages and report "no reply." The fix treats any message that isn't the client's own echo as a reply: def _is_bot_reply(self, activity): """True if the message is from the agent (role may be missing), not the client's echo.""" sender = activity.get("from") or {} role = sender.get("role") if role == "bot": return True if role == "user": return False return sender.get("id") != self._user_id # role missing -> not the echo -> a reply turn.complete is an explicit end-of-turn event Reading it (rather than waiting out a timeout) is what lets a fast turn finish in a couple of seconds instead of idling. It's the event branch in _handle_activity() above. Errors come back as a structured code When something goes wrong, the agent can send a trace activity carrying a locale-independent ErrorCode. The client maps it against the official code list so a run reports why it failed, not just that a reply never came: def _error_code(self, activity): if activity.get("valueType") != "ErrorCode": return None value = activity.get("value") if isinstance(value, dict) and value.get("ErrorCode"): return value["ErrorCode"] return "error" Attach files with a multipart upload A file-reading turn exercises work that a text-only turn does not. This harness sends one or more files through the Direct Line /upload endpoint as multipart/form-data, with an optional message activity in the same request. The multipart request The request contains one activity part and one file part per attachment: POST {host}/v3/directline/conversations/{id}/upload?userId={from.id} Authorization: Bearer «token» Content-Type: multipart/form-data; boundary=----loadtest-«random» ------loadtest-«random» Content-Disposition: form-data; name="activity" Content-Type: application/vnd.microsoft.activity { "type": "message", "from": { "id": "user-…" }, "text": "" } ------loadtest-«random» Content-Disposition: form-data; name="file"; filename="requirement.csv" Content-Type: text/csv «raw file bytes» ------loadtest-«random»-- → 200 { "id": "…" } (same shape as a normal send) The required userId query parameter identifies the sender. The harness uses the same per-instance ID in userId and activity.from.id, so the echoed activity has the sender ID expected by the reply filter. The activity JSON contains no attachments array. Direct Line adds the separate file parts as attachments to that activity before sending it to the agent. A successful upload returns the same { "id": "…" } shape as a text send, so the existing WebSocket receive and timing path remains unchanged. Building the body by hand Locust's FastHttpUser has no explicit requests-style files= helper. The client therefore assembles the multipart body as bytes. A fresh UUID-based boundary is used for each request, every file is read before the POST begins, and each attachment gets its own file part. The implementation uses four additional standard-library modules: import mimetypes import os import urllib.parse import uuid def _send_file(self, text, attach): """Upload one or more files (optionally with a message) via Direct Line /upload.""" paths = attach if isinstance(attach, list) else [attach] files = [] # read every file first for path in paths: with open(path, "rb") as handle: data = handle.read() name = os.path.basename(path) extension = os.path.splitext(path)[1].lower() mime = UPLOAD_MIME.get(extension) or mimetypes.guess_type(path)[0] or "application/octet-stream" files.append((name, mime, data)) activity = json.dumps({"type": "message", "from": {"id": self._user_id}, "text": text or ""}) boundary = "----loadtest-" + uuid.uuid4().hex # fresh boundary per request dash = ("--" + boundary).encode("utf-8") parts = [ dash + b"\r\n", b'Content-Disposition: form-data; name="activity"\r\n', b"Content-Type: application/vnd.microsoft.activity\r\n\r\n", activity.encode("utf-8") + b"\r\n", ] for name, mime, data in files: # one part per file disposition = _content_disposition("file", name) parts.append(dash + b"\r\n") parts.append(("Content-Disposition: " + disposition + "\r\n").encode("utf-8")) parts.append(("Content-Type: " + mime + "\r\n\r\n").encode("utf-8")) parts.append(data + b"\r\n") parts.append(dash + b"--\r\n") url = (self.directline + "/v3/directline/conversations/" + self.conversation_id + "/upload?userId=" + self._user_id) headers = self._auth_header() headers["Content-Type"] = "multipart/form-data; boundary=" + boundary with self.client.post(url, data=b"".join(parts), headers=headers, name=self.label + " upload", catch_response=True) as response: if response.status_code != 200: response.failure("upload HTTP " + str(response.status_code)) return None posted = parse_json(response) if not posted or not posted.get("id"): response.failure("upload response missing activity id") return None return posted["id"] The media type comes from a small known-types table, then Python's mimetypes, then application/octet-stream. This labels unknown extensions without claiming that every file type or size can be processed by the agent. The client sends the basename in the multipart header; exact preservation of non-ASCII filenames is not assumed. Use the same turn API Scenarios continue to call say(...). _send() chooses the ordinary message endpoint or multipart /upload: def _send(self, text, attach=None): if attach: return self._send_file(text, attach) # multipart /upload # … otherwise the ordinary text Send Activity from earlier Text only — the ordinary Send Activity. Text and a file — a message plus one attachment. A file with no message — pass text="" with an attachment. Several files — pass a list, and each becomes its own file part in one upload. Because /upload returns the same activity-ID shape as a text send, an upload turn is received and timed by the same say() path: # A conversation that hands the agent a requirements file instead of typing it self.say("Here is my requirement", "T01 requirement", attach="requirement_intake.csv") Validate the workload locally first Before running the larger test in Azure, the workload ran locally in one Python process with locust.conf: four virtual users for 15 minutes, starting one user every 30 seconds. This verified both conversation paths, file uploads, pacing, transaction names, and diagnostics. Azure Load Testing then used the same Python workload with locust.azure.conf, increasing the profile to 16 virtual users for 30 minutes and omitting local result paths. The Python environment used three dependencies beyond the standard library: python -m pip install "locust==2.42.6" "python-dotenv>=1.0,<2.0" "websocket-client==1.9.0" The Direct Line secret came from an environment variable in a local .env file, which kept it out of source control: DL_IA_SECRET=<Direct Line secret> The local run-time included the ramp period. The complete profile lived in locust.conf: locustfile = locustfile_discovery_demo.py headless = true users = 4 spawn-rate = 0.0333333333 run-time = 15m stop-timeout = 1200 only-summary = true csv = results/local-15m html = results/local-15m.html The local launch was then two lines: New-Item -ItemType Directory -Force results | Out-Null python -m locust --config locust.conf The 1,200-second stop timeout was an upper bound, not a fixed extension. When the 15-minute window closed, Locust allowed an in-flight conversation to complete instead of interrupting a turn. This mattered because the optional agent-creation turn had a 300-second reply deadline. Each completed conversation wrote a readable transcript under transcripts/; frame-level JSONL was written under transcripts/directline-debug/ because DL_DEBUG_LOG was enabled. Locust reported the token, conversation-start, send, and upload HTTP calls alongside the [TTFB] and [ResponseTime] chat measurements. Transaction names described logical steps rather than individual system combinations, which kept route variants in the same result rows. The local validation completed successfully. Both conversation paths, file uploads, and optional agent creation finished with zero failures or exceptions. Scale the test in Azure Load Testing The Azure test used one engine to run 16 virtual users for 30 minutes. Eight users followed the text conversation scenario and eight followed the file-attachment scenario. Locust started one user every 30 seconds and kept the configured 20–30 second pause between messages. Upload the test files to an Azure Load Testing resource. The YAML disables client-generated transcripts and JSONL files because Azure Load Testing publishes only its supported artifacts: engine logs, raw result CSV, and a dashboard report. version: v0.1 testId: copilot-studio-directline-load displayName: Copilot Studio Direct Line load test description: Load test with text and file conversation scenarios testPlan: locustfile_discovery_demo.py testType: Locust engineInstances: 1 configurationFiles: - new_chat_client.py - requirements.txt - test_attachment/high_route_requirement.docx - test_attachment/high_route_requirement.pdf - test_attachment/high_route_requirement.png properties: userPropertyFile: locust.azure.conf env: - { name: LOCUST_USERS, value: "16" } - { name: LOCUST_SPAWN_RATE, value: "0.0333333333" } - { name: LOCUST_RUN_TIME, value: "1800" } - { name: LOCUST_STOP_TIMEOUT, value: "1200" } - { name: TEXT_USERS, value: "8" } - { name: FILE_USERS, value: "8" } - { name: ATTACHMENT_DIR, value: "." } - { name: DL_TRANSCRIPT, value: "0" } - { name: DL_DEBUG_LOG, value: "0" } failureCriteria: - percentage(error) > 0 Before creating the test, store the Direct Line secret in Azure Key Vault, enable the Azure Load Testing resource's system-assigned managed identity, and grant that identity permission to read the secret. The Azure Load Testing secret guidance covers the identity and Key Vault access steps. In the current Azure CLI, the literal value null (not an omitted or empty argument) tells --keyvault-reference-id to use the load-testing resource's own system-assigned identity. Azure CLI preview. The az load test and az load test-run commands need the load extension and Azure CLI 2.66.0 or later (currently in preview). Check the current Azure CLI load test reference before running them. Create the test definition from the YAML and set that Key Vault reference identity: az load test create ` --load-test-resource "<load-test-resource>" ` --resource-group "<resource-group>" ` --test-id copilot-studio-directline-load ` --load-test-config-file azure-loadtest.yaml ` --keyvault-reference-id null For a new run, pass the Key Vault secret identifier through Azure Load Testing's dedicated --secret parameter. Locust receives a configured secret as an environment variable with the same name, so the Python workload can continue to read DL_IA_SECRET without code changes: $runId = "copilot-azure-$(Get-Date -Format 'yyyyMMdd-HHmmss')" $directLineSecretUri = "https://<key-vault-name>.vault.azure.net/secrets/<secret-name>" $runEnv = @( "LOCUST_USERS=16" "LOCUST_SPAWN_RATE=0.0333333333" "LOCUST_RUN_TIME=1800" "LOCUST_STOP_TIMEOUT=1200" "TEXT_USERS=8" "FILE_USERS=8" "ATTACHMENT_DIR=." "DL_TRANSCRIPT=0" "DL_DEBUG_LOG=0" ) $runSecrets = @("DL_IA_SECRET=$directLineSecretUri") az load test-run create ` --load-test-resource "<load-test-resource>" ` --resource-group "<resource-group>" ` --test-id copilot-studio-directline-load ` --test-run-id $runId ` --env $runEnv ` --secret $runSecrets ` --only-show-errors ` --output none Azure's test-run debug mode was deliberately left off. Debug-mode runs are capped at 10 minutes regardless of the configured Locust duration. After the run command completes, download the engine logs, raw results, and dashboard report: az load test-run download-files ` --load-test-resource "<load-test-resource>" ` --resource-group "<resource-group>" ` --test-run-id $runId ` --path "results/azure/$runId" ` --log --result --report --force The download command creates logs.zip, csv.zip, and reports.zip in the target directory. Security note. The command passes a Key Vault secret identifier, not the Direct Line secret value. Azure Load Testing stores the identifier, retrieves the secret with the configured managed identity for each run, and exposes it to the Locust process as DL_IA_SECRET. Keep --env for non-sensitive settings only. The 2026-07-12 Demo Run passed the secret through --env, which can expose it in run metadata; the recommended command above avoids that. In CI/CD, the Azure Load Testing task or action can instead receive the value through its secrets input from the pipeline's secret store. What the 30-minute Demo Run produced The completed Azure execution is referred to below as the Demo Run. It ran on 2026-07-12 using a single Azure Load Testing engine, with 16 virtual users split evenly between the text and file paths. Treat the Demo Run as a baseline at this load, not a capacity ceiling. The Demo Run completed with a PASSED verdict and no service error details. The Locust engine ran its configured 30-minute window, then allowed in-flight conversations to finish. It reached all 16 users after 7 minutes 30 seconds, then held exactly 16 for the rest of the run. It hit the run-time limit at 10:23:22Z, a steady window of about 22 minutes 30 seconds, and exited cleanly about 1 minute 50 seconds later. Measure Result Virtual users 16: 8 text and 8 file Locust run-time window 30 minutes Full-load window About 22 minutes 30 seconds Completed conversations 253 Text conversations 98 File conversations 155 Recorded request samples 3,212 Failed samples 0 Completed agent-creation turns 5 The 3,212 samples include Direct Line HTTP calls plus the custom [TTFB] and [ResponseTime] entries emitted for chat turns. Every text conversation that started reached T05 confirm, and every file conversation reached T03 confirm. Path Conversations Recorded samples Failures Text discovery 98 1,507 0 File attachment 155 1,705 0 Total 253 3,212 0 Azure Load Testing packages an offline dashboard with per-minute charts, sampler statistics, and error details. The download command in the previous section saves it as reports.zip. Extract the archive and open reports/index.html. For the Locust-based Demo Run, the downloaded dashboard is also published as the Demo Run report and can be viewed directly. The two cards below summarize latency for the text and file scenarios. Teal shows average TTFB, blue shows average ResponseTime, and orange extends from the average ResponseTime to p90. Text conversation latency re within a section, not across sections. Observation. The regular text path peaked at 18.93 seconds p90 for the requirement turn, while agent creation returned its first message in 8.68 seconds on average but needed 163.71 seconds on average, and 202.37 seconds at p90, to complete. File conversation latency Observation. Attachment processing was the slowest file turn at 22.19 seconds average and 27.80 seconds p90; token, conversation-start, send, and upload calls remained at or below 220 milliseconds p90. What the numbers suggest Agent work dominated the measured latency During the Demo Run, Direct Line token, conversation-start, send, and upload operations all stayed below 220 milliseconds p90. Complete chat turns took seconds, while the agent-creation branch took minutes. This shows that most of the measured end-to-end time accumulated after Direct Line accepted the message. The results do not separate orchestration, model, tool, or downstream-service time. TTFB did not describe the complete answer Some turns returned one message, so TTFB and ResponseTime were equal. Others acknowledged the request and kept working. The target turn averaged 3.08 seconds to first reply and 6.62 seconds to completion. The conditional action turn averaged 3.29 seconds to first reply and 9.46 seconds to completion. Agent creation widened that gap to more than two and a half minutes on average. Measuring only the first reply would hide the expensive part of those turns. Equal users did not produce equal conversation totals The user allocation was eight and eight, but the file path completed 155 conversations while the text path completed 98. That difference is consistent with the longer multi-turn text flow and its occasional agent-creation branch. Virtual-user allocation describes concurrency; completed iterations also depend on scenario duration. Assumptions and guardrails A few deliberate choices bound what these numbers mean: Baseline scale, on purpose. The four-user local validation and 16-user Azure profile generate baselines, not a stress test. The guidance warns that load exceeding real user behavior can trigger message-consumption overage and environment throttling, so the Demo Run stayed within confirmed traffic and quota boundaries. WebSocket transport with secret auth. The client uses Direct Line over WebSockets to match the tested client application and exchanges a Direct Line secret for a token. A test for a client that receives activities through HTTP GET should reproduce that transport instead. One agent, one region. The numbers describe a single agent on one Direct Line regional endpoint; a different agent, model, or region will have its own signature. New-experience behavior observed in this run. The client relies on the turn.complete event and role-optional replies observed during the test. Both the product status and response shapes can change while the experience remains in preview. Capacity confirmed first. A larger run requires prior confirmation that the agent, environment, and connected services support the peak throughput, with a limit increase requested when estimates exceed defaults. Limitations Single Azure engine, light load. Sixteen virtual users provide a baseline, not a capacity ceiling. Characterizing saturation needs higher concurrency and multiple Azure Load Testing engines. One Demo Run. The results describe this 30-minute window and should be compared with repeated runs before setting a service-level target. Chat turns only. The harness measures the message turn. It doesn't exercise sign-in cards, adaptive-card submits, or streamed token-by-token rendering. No Azure transcripts. The cloud profile intentionally disabled readable transcripts and client JSONL, so the five agent-creation turns prove completed responses but not an independent resource inventory. One operational note Operational note. Confirm the Copilot Studio environment's quotas and the capacity of every connected dependency before increasing users or engine count. The workload should model expected traffic rather than use production systems as an unrestricted stress target. Wrap-up For the tested Copilot Studio new-experience agent and WebSocket client, a small reusable Locust client captured the observed Direct Line flow. It matched the client's WebSocket transport, treated non-echo messages as replies, stopped on the turn.complete event emitted by the tested product build, and recorded both first-reply and last-reply times so a multi-message turn did not hide behind its acknowledgment. The same Python workload runs unchanged from a laptop and from Azure Load Testing engines. Local settings come from locust.conf; Azure settings come from locust.azure.conf and the test YAML. The Direct Line secret is supplied at run time, and a failureCriteria gate can support a release pipeline. The four-user local run validated the scripts and diagnostics; the Demo Run then held its full steady concurrency with 3,212 samples and zero failures. Further tests can add repeated baselines, more users and engines for saturation, additional attachment types, and a longer soak. Learn more Plan and create a conversational agent performance test — the planning method, workload model, and test-plan structure this post follows. Best practices for improving conversational agent performance — quotas, and the agent-side levers for cutting latency. Agents overview (new experience) — the orchestration model, instructions, knowledge, tools, and connected agents. Locust documentation — the load-testing framework this harness builds on. Azure Load Testing documentation — the managed load-testing service. Get the code The complete runnable example is available in kroy92/copilot-studio-load-testing. The repository contains new_chat_client.py, the two-class locustfile_discovery_demo.py workload, three attachment fixtures, local and Azure Locust configuration files, requirements.txt, and azure-loadtest.yaml. The Direct Line secret stays in the ignored .env file locally. For new Azure Load Testing runs, the recommended command retrieves it from Azure Key Vault through the dedicated secret parameter. The same Python workload runs in both environments, with locust.conf used locally and locust.azure.conf used in Azure.850Views2likes1Comment