power bi
181 Topics
In a Day (xIAD) Partner Program - Train the Trainer Events - Azure Data In a Day Workshops
We invite you to attend an upcoming Train the Trainer session for Microsoft Partners to learn more about the Microsoft In a Day (XIAD) Partner Events Programand how to lead workshops that empower customers to use and adopt Microsoft products. Our Train the Trainer events are designed to provide you with the knowledge and tools necessary to deliver successful Microsoft In a Day (XIAD) sessions. *Please note, participation is restricted to individuals representing a Microsoft Partner organization. You must register using your corporate email address that is associated with your Partner ID. Personal emails will not be approved. ✨ Why Attend? Expert Guidance: Learn from experienced trainers and get your questions answered. Comprehensive Resources: Access all the content and support you need to succeed. Learn more at https://aka.ms/attendTTT 📅 Upcoming Events: Dashboard in a Day This is a one-day, hands-on workshop for business analysts, covering the breadth of Power BI capabilities. November 13 - EMEA - CEST December 2 - APAC - SGT December 15 - AMERICAS - CST Fabric Analyst in a Day This is an intermediate-level training designed for Power BI Data Analysts who have at least one year of experience on Power BI but are new to Microsoft Fabric. November 13 - EMEA - CEST December 2 - APAC - SGT December 15 - AMERICAS - CST Real-Time Intelligence in a Day This is an intermediate-level training designed for Power BI developers looking to extract insights and visualize streaming and time sensitive data. November 13 - EMEA - CEST December 2 - APAC - SGT December 15 - AMERICAS - CST Chat with your Data in a Day This is an intermediate-level training designed for Power BI data analysts and developers to help get their models chat-ready and unlock instant insights using natural language. November 13 - EMEA - CEST December 2 - APAC - SGT December 15 - AMERICAS - CST SQL AI App in a Day This is an intermediate-level, one‑day, hands‑on workshop showing SQL Developers and DBAs how to build the database backbone for modern AI apps using Azure SQL. November 6 - AMERICAS - CST November 20 - EMEA - CEST December 18 - APAC - SGT New Offer Type: Planning in a Day This is an intermediate-level, one‑day, hands‑on workshop for Business Analysts, providing foundational training to build and manage planning, forecasting, and budgeting solutions using Microsoft Fabric Planning. November 5 - AMERICAS - CST New Offer Type: SQL Modernization in a Day This is an intermediate-level, one‑day, hands‑on workshop for DBAs and Data professionals, providing foundational training to modernize SQL environments through assessment, migration, optimization, and AI-ready architectures. November 19 - AMERICAS - CST Partner with us! Are you a Microsoft Partner interested in the opportunity to join the program and deliver Microsoft In a Day (XIAD) events? 🔍 Learn more about the program and review partner eligibility criteria: https://aka.ms/xiadpartneropportunity. 📧 Contact the XIAD Program team: xiadevents@microsoft.com 📤 Submit requests to deliver events: https://aka.ms/xIAD/PartnerEvents9.4KViews5likes3Comments🏨👻 Partners, save the date. Your reservation at the FABRIC HAUNTED HOTEL is waiting...
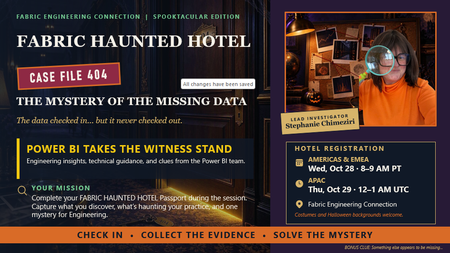
This Halloween, Fabric Engineering Connection is getting a spooky makeover. 🔎 CASE FILE 404: The Mystery of the Missing Data The data checked in... but it never checked out. 👀 And we’re calling in some expert witnesses: the Power BI team will take the witness stand with engineering insights, technical guidance, and answers to your Power BI mysteries. But you won't just be watching: 🔎 Check into the FABRIC HAUNTED HOTEL 🕵️ Collect evidence during the session 🏨 Complete your Haunted Hotel Passport 🎁 And yes... there will be prizes 📅 Americas & EMEA: Oct. 28 | 8–9 AM PT 📅 APAC: Oct. 29 | 12–1 AM UTC 🔑 YOUR KEY TO THE HOTEL This experience is for members of the Fabric Partner Community. Not a member yet? Join the community before the call to participate: https://aka.ms/JoinFabricPartnerCommunity Already a member? Save the date and help us spread the word. Tag a Microsoft partner who should check into the hotel with you. 👇 🎃 Costumes and Halloween backgrounds encouraged. 👓 Curiosity required. 🎁 A little friendly competition may be rewarded. CHECK IN • COLLECT THE EVIDENCE • SOLVE THE MYSTERY39Views0likes0Comments
The hardest part of modernizing enterprise BI is NOT the dashboard
For my team, a whole lotta enterprise BI modernization discussions start with the visualization layer, mostly around: Which dashboard should be rebuilt? Should the reports use Direct Lake? Should the organization move to a Lakehouse? How should Power BI capacity be configured? Those are important questions, but there is another one that tends to surface later: Where should the business logic live? In a multi-source environment, the same KPI can be derived from SAP, operational systems, spreadsheets, or application databases. If each report implements the calculation independently, moving the data into a modern platform doesn't automatically create consistent reporting. A more maintainable pattern is to separate the responsibilities: Ingestion: bring source data into the platform with appropriate batch or event-based patterns. Transformation: clean, conform, and standardize data before it reaches reporting. Business layer: define reusable measures and business rules in the semantic model. Security: apply access rules at the appropriate data or semantic layer rather than duplicating them across individual reports. Visualization: keep reports focused on analysis and user experience rather than embedding large amounts of transformation logic. Microsoft Fabric, in that same environment, makes it feasible to bring several of these capabilities into one unified platform, but the architecture still needs clear boundaries between them. I have found this distinction especially important when upgrading reporting environments that have accumulated years of spreadsheet logic and report-specific calculations. For those working on enterprise BI modernization, where do you draw the line between data transformation logic and semantic-model/business logic? And what has worked best for keeping KPI definitions consistent across multiple Power BI reports?42Views0likes0Comments✨ FabCon + SQLCon Europe 2026: Partner Know Before You Go Guide is Now Live!
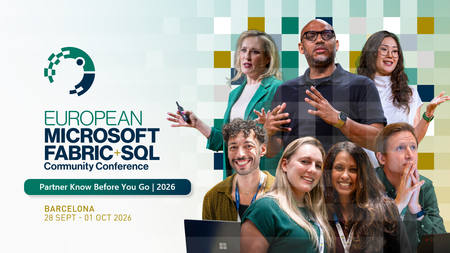
Barcelona is just around the corner, and we're excited to welcome our partner community to the first-ever co-located FabCon + SQLCon Europe experience! To help you make the most of your time onsite, the Partner Know Before You Go Guide is now available. This guide brings together everything partners need to know before arriving, including exclusive partner programming, networking opportunities, important deadlines, and event resources. What You'll Find Inside ✅ Partner Day agenda and key sessions ✅ Partner Happy Hour details ✅ Partner Elevator Pitch Challenge information ✅ Executive Meetings with Fabric & SQL Leadership Team ✅ 1:1 Meetings with the Partner Success Team ✅ AMA Session with the Partner Success Team ✅ Fabric Certification Recognition opportunities ✅ Testimonial Video nominations ✅ Fabric + SQL in the Wild Partner Photo Scavenger Hunt ✅ Cvent Event App guidance and Partner Community information Event Details 📍 Centre de Convencions Internacional de Barcelona (CCIB) 📅 September 28 - October 1, 2026 🌍 Barcelona, Spain Whether you're attending Partner Day, meeting with Microsoft leaders, showcasing your expertise, or connecting with peers from around the world, we've built partner-exclusive experiences to help you learn, connect, and accelerate your Microsoft Fabric business. 📘 Download the Partner Know Before You Go Guide below. ⬇️ We can't wait to see you in Barcelona! #FabConEurope #SQLConEurope #MicrosoftFabric #MicrosoftPartners #DataAndAI #FabCon2026 #PartnerCommunity826Views2likes0Comments2026 FabCon + SQLCon Europe Fabric in the Wild: Photo Scavenger Hunt
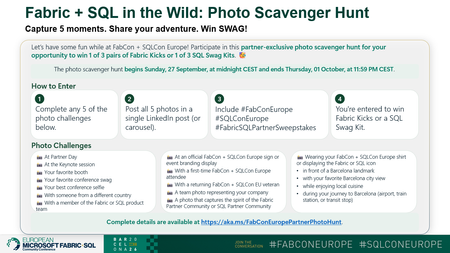
📸 Fabric + SQL in the Wild: Photo Scavenger Hunt at FabCon + SQLCon Europe Heading to FabCon + SQLCon Europe in Barcelona? Get ready to explore, connect, and have some fun with the Fabric community! We're excited to launch the Fabric + SQL in the Wild: Photo Scavenger Hunt, an exclusive experience for Microsoft partners attending the event. Whether you're networking at Partner Day, taking in the keynotes, meeting fellow partners, or discovering Barcelona, you'll have the opportunity to capture your adventure and win some exclusive Fabric swag. 🏆 Win Fabric Kicks or a SQL Swag Kit Complete the challenge by sharing photos from any five scavenger hunt moments and you'll be entered for a chance to win 1 of 3 pairs of Fabric Kicks or 1 of 3 SQL Swag Kits. 📷 How It Works ✅ Complete any 5 photo challenges from the hunt ✅ Share all 5 photos in a single LinkedIn post or carousel ✅ Include: #FabConEurope #SQLConEurope #FabricSQLPartnerSweepstakes That's it. You're in! The scavenger hunt is all about celebrating the people, experiences, and energy that make the Microsoft Fabric partner community special. From Partner Day and keynotes to new connections and iconic Barcelona landmarks, we can't wait to see Fabric in the wild through your lens. Drop your photos, showcase your creativity, and share your FabCon + SQLCon story with the community! 🌍 See you in Barcelona. For more information about FabCon + SQLCon Europe, visit aka.ms/fabconeu #FabConEurope #SQLConEurope #FabricSQLPartnerSweepstakes294Views1like0Comments
Turning Nonprofit Data Into Action: A Technical Guide to Power BI
Nonprofits generate data constantly — but it’s often scattered across Excel files, CRMs, survey tools, and program systems. Power BI provides a unified analytics layer that connects, cleans, models, and visualizes this data in a secure, scalable environment. It is part of Microsoft’s broader analytics stack designed to turn raw data into actionable insight. This guide dives deeper into the technical foundations required to build nonprofit‑ready analytics solutions. Power BI Architecture for Nonprofits Power BI consists of three core components: 1. Power BI Desktop Power BI Desktop is the primary authoring tool used to create data models and interactive reports. These reports are then published to the Power BI Service for sharing and collaboration. Used for: Data modeling (building semantic models) DAX calculations (measures and calculated columns) Visual design (interactive reports) Data transformation using Power Query 👉 Power BI Desktop overview 2. Power BI Service (Cloud) The Power BI Service is the cloud-based platform for collaboration, distribution, and consumption of analytics, enabling teams and stakeholders to securely access and interact with data insights Used for: Publishing reports from Power BI Desktop Sharing dashboards and reports Scheduled data refresh Row-Level Security (RLS) Workspaces, apps, and governance 👉 Get Started Creating in the Power BI Service - Power BI | Microsoft Learn 3. Power BI Gateway (Optional) The gateway ensures secure data transfer between on‑premises systems and Power BI cloud services. Used when connecting to on‑premises data sources (SQL Server, local Excel files, etc.). Acts as a secure bridge between cloud services and on‑premises data Enables scheduled data refresh and live (DirectQuery) connections Keeps sensitive data within your local network while enabling cloud-based analytics 👉 On-premises data gateway - Power BI | Microsoft Learn Core Data Preparation: Power Query Power Query is the data preparation and ETL (Extract, Transform, Load) engine behind Power BI. Capabilities: Connects to multiple data sources Cleans and reshapes data Creates repeatable transformation pipelines Supports hundreds of data transformations 👉 Power Query overview Power Query standardizes data and automates preparation workflows, reducing manual effort. Advanced Nonprofit Use Cases 1. Multi‑Program Outcome Dashboards Nonprofits often manage multiple programs with different metrics. Power BI enables unified reporting through: Star schema modeling Fact tables (attendance, outcomes, surveys) Dimension tables (participants, programs, locations) 👉 Star schema guidance: Understand star schema and the importance for Power BI - Power BI | Microsoft Learn 2. Donor Analytics With Predictive Insights DAX (Data Analysis Expressions) is a formula language used to create dynamic calculations and measures inside Power BI data models. Using DAX, AI visuals, and advanced analytics features, nonprofits can: Identify donor churn Analyze giving trends and likelihood Segment donors by behavior Calculate and track lifetime value 👉 DAX reference 3. Volunteer Workforce Analytics Track and optimize: Volunteer hours by skill Retention trends Training completion and effectiveness Event staffing gaps and workforce allocation 👉 Power BI HR analytics sample (workforce trends & attrition): Human Resources sample – Power BI 4. Grant Reporting Automation Power BI enables nonprofits to automate and standardize grant reporting processes, reducing manual effort and improving accuracy. Capabilities: Automatically refresh data using scheduled refresh in the Power BI Service Standardize reporting through reusable dashboards and report templates Automated export and distribution 👉 Configure scheduled refresh – Power BI 👉 Export and automate report delivery with Power Automate How to Build a Nonprofit Impact Dashboard (Advanced) Step 1: Build a Data Model Import data (Excel, SharePoint, SQL) Create core tables: FactOutcomes DimParticipant DimProgram DimDate Define one‑to‑many relationships between dimension and fact tables This follows a star schema approach, which improves performance, scalability, and reporting clarity. 👉 Power BI data modeling guidance Step 2: Create DAX Measures Example measures: Total Participants = COUNT(DimParticipant[ParticipantID]) Total Outcomes = SUM(FactOutcomes[OutcomeValue]) Outcome Rate = DIVIDE( [Total Outcomes], [Total Participants], 0 ) Active Participants = CALCULATE( DISTINCTCOUNT(DimParticipant[ParticipantID]), FactOutcomes[Status] = "Active" ) 👉 DAX reference Step 3: Build Visuals Use report visuals to present key metrics and patterns, then pin selected visuals to dashboards in the Power BI Service for executive-level monitoring. Cards → KPIs (total participants, outcomes) Line charts → trends over time Maps → geographic impact Matrix tables → structured reporting for funders 👉 Intro to dashboards for Power BI designers - Power BI | Microsoft Learn and Overview of Power BI reports - Power BI | Microsoft Learn Step 4: Publish and Automate Publish to Power BI Service Configure scheduled refresh Apply Row-Level Security Share dashboards with leadership, funders, and board members 👉 Configure scheduled refresh - Power BI | Microsoft Learn and Tutorial: Get Started Creating in the Power BI Service - Power BI | Microsoft Learn Final Thought Power BI gives nonprofits a modern, enterprise-grade analytics platform without requiring a full data engineering team. By combining: Structured data modeling Automated data preparation Strong governance practices nonprofits can transform fragmented data into clear, actionable insight that drives mission impact.568Views0likes1Comment🚀 Join the FY27 Fabric Engineering Connection Kickoff Call
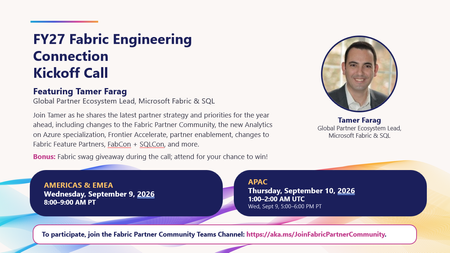
We're excited to kick off FY27 with the first Fabric Engineering Connection call of the year! Join Tamer Farag, Global Partner Ecosystem Lead for Microsoft Fabric & SQL, as he shares the latest strategy, priorities, and opportunities for partners in the year ahead. What we'll cover ✅ Fabric Partner Community updates and upcoming changes ✅ Analytics on Azure Specialization updates ✅ Frontier Accelerate program highlights ✅ Partner enablement plans and resources ✅ Fabric Feature Partner program updates ✅ FabCon and SQLCon insights and opportunities ✅ Open Q&A with the community 🎁 Bonus: Attend live for a chance to win Fabric swag during the call! Event Details Americas & EMEA 📅 Wednesday, September 9, 2026 🕗 8:00 AM – 9:00 AM PT APAC 📅 Thursday, September 10, 2026 🕐 1:00 PM – 2:00 PM UTC (Wednesday, September 9, 5:00 PM – 6:00 PM PT) How to Join To participate, join the Fabric Partner Community Teams channel: 🔗 https://aka.ms/JoinFabricPartnerCommunity Whether you're a long-time community member or just beginning your Microsoft Fabric journey, this is a great opportunity to hear directly from the team, get aligned on FY27 priorities, and connect with fellow partners around the world. We look forward to seeing you there!423Views1like2Comments🎉 Save the Date: FY26 Fabric Partner Community Year‑End Celebration
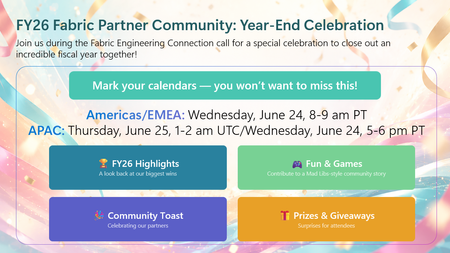
As we prepare to wrap up FY26, we’re closing the year the same way we built it — together. This year‑end celebration will be held as part of the final Fabric Engineering Connection calls of FY26, giving us space to pause, look back on what we built together, and celebrate the partners who make this community what it is. 🌎Americas & EMEA Wednesday, June 24 | 8:00–9:00 AM PT 🌍APAC Thursday, June 25 | 1:00–2:00 AM UTC / Wednesday, June 24 | 5:00–6:00 PM PT) ✨ What to expect: A look back at the moments that defined FY26 along with partner updates to take you into FY27 Fun & games — including a Mad Libs–style community story built live by partners A community toast and a few surprises along the way 👉 Important: This call is open to members of the Fabric Partner Community on Microsoft Teams. If you’re not already a member, you can join here: https://aka.ms/JoinFabricPartnerCommunity This isn’t just a year‑end recap. It’s a thank‑you to the partners who showed up, shared openly, asked great questions, and helped each other grow real Microsoft Fabric practices. Mark your calendars. We can't wait to celebrate with you! 🥳 🥂190Views1like0CommentsOn the Next Fabric Engineering Connection
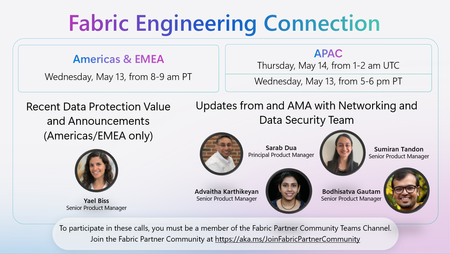
Coming up on the next Fabric Engineering Connection calls, we’re focusing on one of the most important areas for partners right now: data protection, networking, and security in Microsoft Fabric. 🔐 What to expect 🎤 Recent Data Protection Value and Announcements (Americas & EMEA) presented by Yael Biss Covering the latest data protection capabilities in Fabric—designed to help partners meet security, compliance, and governance requirements while enabling customers to scale with confidence. 🎤 Updates + AMA with Networking and Data Security Team (Americas/EMEA & APAC) presented by Sarabjit D., Sumiran Tandon, Advaitha Karthikeyan, PMP®, and Bodhisatva Gautam This is a great opportunity to engage directly with the engineering team working on key scenarios including: ✅ Private Links ✅ Managed Private Endpoints (MPEs) ✅ Outbound Access Protection ✅ Customer Managed Keys (CMK) If you're advising customers on secure Fabric deployments, networking isolation, or enterprise‑grade governance, this session is definitely one to join. 🔒 Note: Fabric Engineering Connection calls are hosted exclusively in the Fabric Partner Community. Microsoft partners can join here the Community by submitting the form at https://aka.ms/JoinFabricPartnerCommunity. Looking forward to the discussion next week!155Views1like0CommentsThis Week on the Fabric Engineering Connection
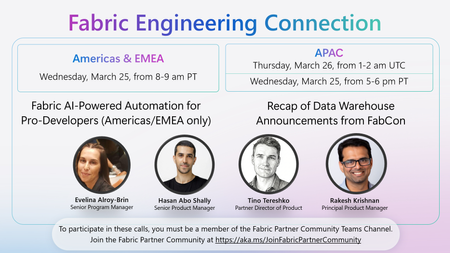
After a two‑week pause for FABCON & SQLCON - The Microsoft Fabric & SQL Community Conferences, we’re excited to welcome partners back for our first Fabric Engineering Connection call since the conference. Welcome back—and what a great way to restart the conversation! 🙌 This week’s sessions bring partners closer to the people building Microsoft Fabric, with timely insights and takeaways straight from FabCon. 🎙 What’s on the agenda: Fabric AI‑Powered Automation for Pro‑Developers (Americas & EMEA) presented by Evelina Alroy-Brin and Hasan Abo-Shally Recap of Data Warehouse announcements from FabCon presented by Rakesh Krishnan and Tino Tereshko 🇺🇦 🌍 Session times: Americas & EMEA: Wednesday, March 25 | 8–9 AM PT APAC: Thursday, March 26 | 1–2 AM UTC / Wednesday, March 25 | 5–6 PM PT These calls are a great opportunity to reconnect after FabCon, hear directly from engineering, and dig deeper into what’s new—and what’s next—for Microsoft Fabric. 👉 Participation is open to members of the Fabric Partner Community. Join here: https://aka.ms/JoinFabricPartnerCommunity162Views1like0Comments