postgresql monitroing
2 TopicsAnnouncing new security, maintenance and analytics features for PostgreSQL at Microsoft Build 2026
At Microsoft Build 2026, we’re announcing a major wave of PostgreSQL innovation across Azure. Alongside the public preview of Azure HorizonDB, we’re delivering a broad set of enhancements for our fully managed open-source PostgreSQL service: Azure Database for PostgreSQL flexible server. These updates span performance, analytics, security, operations, resilience and migration - helping you build faster, operate with more control, secure your workloads, and modernize with confidence. Here’s a quick tour of the top flexible server announcements at Build 2026. Feature Highlights pg_ivm Extension Defender Security assessments temporal_tables Extension Cross-tenant CMK Automatic Entra token refresh libraries New Powershell module: Az.PostgreSQLFlexibleServer More control over planned maintenance Pre-Upgrade validation checks New Built-in Grafana dashboards Chaos Studio supports Azure Database for PostgreSQL AI-assisted Oracle to PostgreSQL migration Migration Service for Azure Database for PostgreSQL improvements (EDB, AlloyDB) Performance, Scale & Analytics pg_ivm Extension Generally Available Materialized views are a useful way to optimize performance for queries that run regularly, but if underlying data becomes stale the result set needs to be recomputed. With the pg_ivm extension you can automatically maintain materialized views as the underlying data changes. This is particularly valuable for large datasets with small incremental changes that need real-time freshness, like dashboards, catalog analytics and SaaS usage reporting. We are pleased to announce the pg_ivm extension is now generally available in Azure Database for PostgreSQL. Learn more: pg_ivm. Security, Auditing & Identity Defender security assessments Preview Microsoft Defender Security Assessments for Azure Database for PostgreSQL enables continuous evaluation of your database security posture, helping identify vulnerabilities and misconfigurations across server and database configurations. Previously limited to reactive threat detection, in the latest preview release, Defender now provides proactive, risk-based insights through assessments tailored to PostgreSQL-specific best practices, delivering more relevant and actionable guidance. This helps you strengthen your security baseline, prioritize remediation, and align with best practices and compliance requirements. Learn more: https://aka.ms/Defender-Assessments-for-PG-Preview temporal_tables Extension Generally Available We’ve had many customer requests to support the temporal_tables extension, which provides built-in support for tracking and querying historical changes to data over time. Temporal tables are now generally available in Azure Database for PostgreSQL. With this extension enabled you can easily perform time-based queries, audit data changes, and maintain historical records without building custom tracking logic, simplifying application development and compliance scenarios. Learn more: temporal_tables Cross-tenant CMK Preview Azure Database for PostgreSQL now supports cross-tenant customer-managed keys (CMK) in public preview, allowing you to encrypt your data at rest using an Azure Key Vault key that resides in a separate Microsoft Entra tenant from the database service. This feature is designed for SaaS providers and enterprises that need to maintain strict separation of duties and ownership of encryption keys, enabling you to retain full control over key lifecycle management while PostgreSQL runs in a service provider’s tenant. Learn more: Data encryption at rest in Azure Database for PostgreSQL Automatic Entra token refresh libraries Preview We’re making it easier to use Entra ID authentication with Azure Database for PostgreSQL throughout the application stack by introducing new token refresh libraries for .NET, JavaScript, and Python. With Entra ID, access tokens are short-lived which can make managing their lifecycle complex in real-world applications. Developers need to be aware of token refresh and build additional handling around token expiration, connection retry, and session continuity. These new libraries remove that friction. By handling Entra token refresh seamlessly in the background, they allow applications to stay connected without interruption and with no custom logic required. The result is a simpler development experience and more resilient applications, especially for long-running or connection-heavy workloads. Across languages, the libraries provide a consistent and streamlined way to adopt secure, passwordless authentication, helping teams focus more on building their applications and less on managing authentication. Learn more: .NET, JavaScript, and Python. Operations, Maintenance & Monitoring New Powershell module: Az.PostgreSQLFlexibleServer Generally Available We’re excited to introduce the newly renamed Az.PostgreSQLFlexibleServer PowerShell module, delivering a streamlined experience for managing Azure Database for PostgreSQL with PowerShell. Building on the capabilities of the previous Az.PostgreSql module, the updated module aligns with the new features in the 2026-01-01 preview REST API. This module brings support for PostgreSQL 18, elastic clusters for scalable workloads and a range of enhancements designed to simplify management and improve performance. Whether you're provisioning new deployments or managing complex environments, this module ensures you can take full advantage of the latest platform capabilities directly from PowerShell. To learn more, visit our official documentation on PowerShell: Az.PostgreSql Module | Microsoft Learn More control over planned maintenance Generally Available We’ve seen many requests to provide more control when a maintenance update is applied to Azure Database for PostgreSQL. Sometimes when a critical workload is running you want to apply the maintenance when you’re ready. Announcing general availability this week, we’re building on the existing System and Custom maintenance window options and adding new self-service maintenance capabilities to the Azure portal. You can now reschedule upcoming maintenance updates for up to two weeks and apply maintenance on demand at a time that suits you. You can also view scheduled maintenance and review your server’s maintenance history after updates are complete. These options help you better align maintenance with your business schedules, reduce disruption during critical workload periods, and minimize the need for support-driven deferral requests. CLI and API support are coming soon. Learn more: https://aka.ms/azure-postgres-reschedule-maintenance Pre-Upgrade validation checks Preview Major version upgrades are critical for staying current with PostgreSQL features, security updates, and performance improvements, but you often discover blockers only after starting the upgrade workflow. Pre-Upgrade Validation Checks lets you validate upgrade readiness before initiating the actual upgrade by running Azure-specific upgrade checks and PostgreSQL pg_upgrade --check validations independently. The shift is simple: you can identify and fix upgrade blockers before the upgrade window begins. The feature surfaces actionable issues across configurations, extensions, dependencies, replication slots, event triggers, and other upgrade-sensitive objects. You can fix blockers, re-run validation until all checks pass, and proceed with the upgrade with greater predictability. Learn more: https://aka.ms/pg-flex-upgrade-checks New Built-in Grafana dashboards Generally Available Grafana dashboards are now built directly into the Azure portal for Azure Database for PostgreSQL - no setup, no extra cost, and no separate service to manage. You can open your PostgreSQL resource in the portal and immediately access prebuilt dashboards for key health and performance signals such as CPU, memory, storage, IOPS, connections, transactions, and availability. The key value is metrics + logs in one place. You can quickly correlate performance spikes with PostgreSQL logs, understand what changed, and troubleshoot faster using the familiar Grafana experience. Dashboards can also be customized, saved to your subscription, and shared across teams for ongoing operations. Learn more: https://aka.ms/azure-postgres-dashboards-grafana Resilience & Business Continuity Chaos Studio supports Azure Database for PostgreSQL Preview No matter how much you prepare, you only really know how good your database disaster recovery plan is when something breaks. With Chaos Studio support for Azure Database for PostgreSQL, you can simulate zone-down scenarios on PostgreSQL HA-enabled instances and validate the resilience of your mission-critical workloads. With Chaos Studio integration, you can proactively test failover behavior and gain confidence in how your applications respond to real-world zonal failures. This feature is currently available through a gated private preview. To get started, submit your subscription details using the form. Once reviewed, our team will enable the feature for your subscription, with guidance to help you begin testing. Getting started is simple: Create a Chaos Studio workspace via the Chaos Studio portal and configure your subscription, resource group, and region. Define the scope and assign the required managed identity and permissions. Review and verify your workspace setup. Browse available scenarios and select the PostgreSQL zone-down scenario. Configure the test (name, duration), then run it from My Library to begin validating failover behavior. With just a few steps, you’ll be able to simulate real-world failure conditions and gain confidence in your application’s resilience. To get started, please submit your details using this link: Private Preview Support for Chaos Studio Migration & Modernization AI-assisted Oracle to PostgreSQL migration Generally Available AI-assisted migration tooling has dramatically lowered the bar for moving between different databases and is changing the way people look at the return on investment for migration. The VS Code PostgreSQL extension comes with AI-Assisted migration tooling which converts Oracle schema and application code to Azure Database for PostgreSQL. This tooling uses GitHub Copilot, Microsoft Foundry, and custom Language Model tools to convert Oracle schema, database code and client applications into the PostgreSQL equivalents, and validates every change against a running flexible server instance. Learn more: Schema conversion, App conversion. Migration Service for Azure Database for PostgreSQL improvements (EDB, AlloyDB) Generally Available We’ve added AlloyDB and EDB Extended Server as new sources for migrating to PostgreSQL in the Azure Database for PostgreSQL Migration Service, with support for both online and offline migration support. Learn more: Migrate from AlloyDB, Migrate from EDB. Looking ahead That wraps up the Build 2026 announcements for Azure Database for PostgreSQL flexible server. There are also many great PostgreSQL technical sessions at Build this week, covering cloud-native app & AI development and migration. To find out more, here's a link to the Build session catalog for PostgreSQL sessions: https://aka.ms/Postgres-on-Azure_Build-2026. We'll continue to build out our roadmap over the coming months to deliver on your asks to improve the performance, security and stability of your PostgreSQL workloads. Check the Microsoft Blog for PostgreSQL for a regular monthly recap where we share the latest enhancements and product updates.1.7KViews2likes0Comments
Native Database/Query Monitoring with Azure Database for PostgreSQL
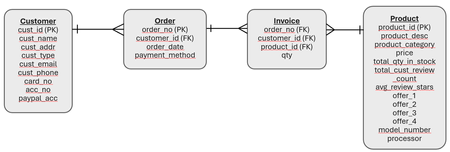
Monitoring PostgreSQL Database Engine The PostgreSQL database engine provides multiple administrative views, which can be leveraged to capture metrics of activities inside of the database engine including, but not limited to, database activities, query activities, execution time, database resource locks etc for initial and deep analysis on database & query performance. Database Administrators should use these views and their corresponding metrics to perform initial level analysis. Critical insights can be gathered around database activity, performance and system activity for reactive and proactive analysis. In this blog, I am going to show the important administrative views and their corresponding SQL statements for capturing database and query details. The following section provides details about the statistics views and their usage. It contains the most important and mostly used statistics views, there are other views available that can be used to get into further details. NOTE: The queries and flows provided below are a few of the ways for each scenario. Eventually, the final approach will depend on and be dictated by the issue at hand or its symptoms. Pre-requisites The following parameters should be enabled in Azure Database for PostgreSQL “Server parameters” before using the statistics views: track_activities track_counts track_io_timing pg_stat_statements.track = ALL The following extensions should be installed before using the stats: create extension pg_stat_statements; create extension pgstattuple; NOTE: All SQL queries mentioned below are as per PostgreSQL version 18. Schema & Data for Analysis All the "Example Scenario" mentioned in the analysis queries are based on the following schema and corresponding volumetrics: Table Name No. of rows customer 993,814 invoice 20,229,119 orders 4,497,292 product 2,818,000 Statistics Views and SQL Queries for Analysis The following SQL statements can be used to perform 1 st level monitoring on the database, tables and queries. Note that the output counters and metrics from the SQL statements represent cumulative data since the last server restart. The statistics should be reset to zero before performing troubleshooting or performance tuning exercises. Use the below mentioned SQL statements to reset statistics at database, table and IO level. Database level stats reset SELECT pg_stat_reset(); IO level stats reset. SELECT pg_stat_reset_shared('io'); Reset pg_stat_statements metrics per user, query and database id or for the entire database - pg_stat_statements contain query level metrics for a database, user or a single query. We can reset the statistics at these individual levels. If any of the parameters are not specified, the default value 0 is used for each of them and the statistics that match with other parameters will be reset. "userid", "dbid" (Database ID), "queryid" can be fetched from pg_roles (column - oid), pg_stat_database (column - datid) and pg_stat_activity (column - query_id) respectively. SELECT pg_stat_statements_reset(userid, dbid, queryid); SELECT pg_stat_statements_reset(); SQL Activity Monitoring: This query uses pg_stat_activity statistics view, which contains details of current activities in the database server. It can be used to track queries in transactions, transaction execution time, wait event details if any etc. The WHERE clause can be used to filter activities based on client IP address (client_addr), application name (application_name), user (usename) who has submitted the query and text of the SQL statement. SELECT datname AS dbname, pid, usename as username, application_name, client_addr as client_ip_addr, xact_start AS transaction_start_time, query_start AS query_start_time, wait_event_type AS db_waitign_on, wait_event AS waiting_activity, CAST(query AS varchar(100)) AS sql_query, backend_type AS db_operation FROM pg_stat_activity WHERE <conditions>; Interpreting output: This output should be used to find overall activity in your database. username, application_name, client_ip_addr - The user, application and client IP address from where the query is being executed. transaction_start_time - When transaction started (using BEGIN keyword or corresponding API). query_start_time - Start time of currently active query in the transaction. wait_event and wait_event_type columns output the events on which the query is waiting, if applicable. Refer to the official links for details on wait events and wait event types. db_operation - Type of database operation that is being performed by the application. E.g. autovacuum, parallel worker, client backend, etc. Example Scenario: Application team is complaining about higher load in "retail_db" database and it is causing multiple SQL statements to run slow, team wants to know whether ad-hoc SQL statements are being run using "psql" client by application developers. As a DBA, you want to look at the entire database activity - no. of SQL statements, who are running to SQLs and which client are they coming from. Above mentioned SQL can be used with filters on "application_name" (value = "psql") and "dbname" (value = "retail_db"). It generates the following output: Analysis: From the above output, it can be seen that "psql" client is indeed getting used from a few IP addresses. Next Step: pg_terminate_backend(<pid>) can be used to kill the applications with pid 22210, 22209 and 21993. Similarly, the same SQL statement can be used to look at overall SQL activities in individual database. SQL Statement Level monitoring This is one of the most important SQL statements that describes operations at query level. It provides execution time detail of queries, read time, write time, disk read and disk write. Output of this query should serve as one of the starting point of query troubleshooting and query optimization. SELECT queryid , CAST(query AS varchar(100)) AS sql_stmt, calls AS no_of_executions, total_exec_time, min_exec_time, max_exec_time, mean_exec_time AS avg_exec_time, rows AS rows_fetched, shared_blks_hit AS blocks_read_from_buffer, shared_blks_read AS blocks_read_from_disk, shared_blks_written AS blks_written_to_disk, shared_blk_read_time, shared_blk_write_time FROM pg_stat_statements WHERE query LIKE '%<sql-stmt>%'; Interpreting output: Output of this query can be used to dive deeper into SQL performance issues. sql_stmt - Provides the SQL statement that is being run. This is the query that is being analyzed for tuning. no_of_executions - How many times this SQL statement has been executed so far (since the reset of pg_stat_statements). total_exec_time - This is the execution time for the query combining all runs. e.g. if the query was run 10 times and each time took 1.5s, then total_exec_time would be 15s. min_exec_time - Min. time the query took to execute. This can be considered as the benchmark execution time for this query. max_exec_time - Max. time the query took to execute. avg_exec_time - Avg. execution time of the query. This time should fall within the query SLA. rows_fetched - No. of rows needed by application (SQL query) blocks_read_from_buffer & blocks_read_from_disk - Data blocks (8KB size) read from PostgreSQL shared memory and from disk respectively. shared_blk_read_time & shared_blk_write_time - Total time spent in reading from and writing to disk. This time is included in total_exec_time. If ratio of shared_blk_read_time or shared_blk_write_time or both with total_exec_time is higher, then IO is causing high execution time in this query. If the ratio is less then other complex SQL operations like join, order by, group by, functions etc. are taking longer to execute. Example Scenario: We will be using the same SQL statement that was used in the example scenario of "3. Application-wise IO Activities". But in this case, using "SQL Statement Level monitoring" we will look at the execution details of the query rather than IO usage. Following is the output of first execution (after server restart - shared memory was empty) of the SQL statement Analysis: Here is the observation, execution time of the query was 154.81 seconds. Total rows needed by application was 4,497,292 out of which 341 8KB blocks were read from shared memory (PostgreSQL bufferpool) and 58504 8KB blocks were read from disk. Following is the output after 2nd execution (after resetting pg_stat_statements): Analysis: The query was executed 4 times. Execution time got reduced to 95 seconds, but it is still high. Even though all rows (4497292 x 4) were read from shared memory (buffer pool) as blocks_read_from_disk was zero, execution time is very high. Next Step: Even if the execution time is found to be within SLA, the query needs to be analyzed for its execution plan. Use EXPLAIN ANALYZE command to analyze the access plan or execution path of the query. Query optimization must be done for this SQL statement. Table-level Bloat Statistics PostgreSQL uses MVCC (Multi Version Concurrency Control) to avoid read and write conflicts, which means one application can read rows while they are being modified by another application. This is done by storing multiple versions of the same row. But over time older versions, which are not needed by applications, become overhead as they occupy space. This is known as "Bloating". It can cause both storage and performance issue. The query mentioned below provides bloating percentage on a table, which should be monitored on a regular basis and DBAs should decide on the autovaccuum settings. SELECT (table_len/1024/1024) AS table_size_mb, tuple_count AS no_of_live_rows, (tuple_len/1024/1024) AS live_row_size_mb, dead_tuple_count AS no_of_dead_rows, (dead_tuple_len/1024/1024) AS dead_row_size_mb, tuple_percent AS live_rows_percent, dead_tuple_percent AS dead_rows_percent, free_percent AS free_space_percent, (((table_len – tuple_len)/table_len)*100) AS bloat_percent FROM pgstattuple('<table-name>'); Interpreting output: table_size_mb - This is the total table size, including bloating. no_of_live_rows - No. of actual usable rows in the table. live_row_size_mb - This is the actual size of the table. This is the amount of data in this table that can be used by applications. no_of_dead_rows - No. of irrelevant rows in the table. dead_row_size_mb - Size of irrelevant rows in the table. This is the amount of data that is not needed by any application, but is still there in the table and occupying storage. This is the data that has to be removed from the table. bloat_percent - Percentage of dead rows occupying the table. If it goes beyond 25-30%, manual VACUUM should be used to remove bloating. Example Scenario: invoice_history table contains more than 20 M rows and has a size of 1630 MB. Deleting records from a table does not reduce the size in PostgreSQL because of MVCC support to keep multiple versions of the same row. The deleted rows still occupy storage space, it is known as bloating as shown below. "Table level Bloat Statistics" can be used to find the bloat percentage of a table. Next Step: Aggressive AUTOVACUUM has to be configured to remove bloating on time. As AUTOVACUUM does not free up storage space, manual FULL VACUUM has to be executed to reclaim storage space. Note that full vacuum takes exclusive lock on tables. Bloat percentage changed after executing full vacuum. Table Bloat using Stat table Table bloating information using statistics table. SELECT schemaname, relname AS tblname, n_live_tup AS live_rows, n_dead_tup AS dead_rows, ((n_dead_tup - n_live_tup)/100) AS tbl_bloat_percent, last_vacuum AS last_manual_vacuum, last_autovacuum FROM pg_stat_all_tables WHERE relname = '<tblname>'; Interpreting output: Same as "Table-level Bloat Statistics". Database Activity Monitoring This SQL statement provides row level counters of DML statements for a database. SELECT datname AS dbname, blks_read AS total_no_of_read_ops, blks_hit AS no_of_blks_read_from_bufferpool, tup_returned AS no_of_rows_scanned, tup_fetched AS no_of_rows_fetched, tup_inserted AS no_of_rows_inserted, tup_updated AS no_of_rows_updated, tup_deleted AS no_of_rows_deteled, deadlocks AS no_of_deadlocks, (blk_read_time/1000) AS blk_read_time_s, (blk_write_time/1000) AS blk_write_time_s FROM pg_stat_database; Interpreting output: Output shows the impact of DML operations in a database. total_no_of_read_ops - This is the total block read request executed by the database engine. no_of_blks_read_from_bufferpool - Out of total read requests, how many blocks were already there in memory or shared_mem. no_of_rows_scanned & no_of_rows_fetched - Total no. of rows read from the database and the total no. of rows actually needed by application. Higher difference in the two metrics should call for query tuning using better indexes, join strategies etc. blk_read_time_s & blk_read_write_s - Time taken in seconds, to perform read and write operations. no_of_deadlocks - Higher no. of deadlocks should be investigated. Execution of application SQL queries might have to be re-looked if higher deadlocks create performance or application issues. Index-level Bloat Statistics – Live rows, dead rows, bloat This is similar to query no. 8, but it provides bloating information at index level. SELECT (index_size/1024/1024) AS idx_size_mb, (index_size/8192) AS index_pages, empty_pages, deleted_pages, ((index_pages - deleted_pages)/index_pages) * 100 AS idx_bloat_percent FROM pgstatindex('<idx-name>'); Interpreting output: The output is similar to table-level bloat statistics, but it is for indexes. Monitor IO activities Output of the following SQL statement shows the overall IO (Input/Output) activities for a database. It can be used to infer whether database workload is read heavy or write heavy. For read workloads, database level bufferpool_hit_ratio metrics can be used to increase or decrease shared memory configuration parameter. SELECT backend_type , object, context AS reason_for_io, reads AS no_of_reads, (read_bytes/1024) AS read_data_kb, read_time AS read_time_ms, writes AS no_of_writes, (write_bytes/1024) AS write_data_kb, write_time AS write_time_ms, writebacks AS no_of_blocks_to_storage, writeback_time AS block_to_storge_write_time_ms , hits AS no_of_reads_from_bufferpool, 100 * (hits / (hits + reads)) AS bufferpool_hit_ratio FROM pg_stat_io; Interpreting output: The output showcases database level IO metrics. backend_type - Type of database operation that is being performed by the application. E.g. autovacuum, parallel worker, client backend, etc. reason_for_io - corresponding IO operation. Following are the possible output values to look out for. normal - Read from or write to shared buffers. vacuum - IO used by VACUUM operation. bulkread & bulkwrite - Disk read and write operations. no_of_reads - Total read operations. read_data_kb - Amount of data read (in KB) across all operations. no_of_writes - Total write operations. write_data_kb - Amount of data written (in KB) across all operations. read_time_ms & write_time_ms - Duration of all read & write operations. Example Scenario: Extending the previous example, application team is complaining about overall performance of the database. As a DBA you want to find out the overall read and write operations to confirm whether it is causing slowness in the database. It will give an idea about how busy the database has been. "Monitor IO Activities" SQL can be used to find out the trigger of higher IO activities in the database. Following is the output: Analysis: Output above shows that most of the read and write operations are emanating from applications ("backend_type" = "client backend"). This gives an idea of database usage by the applications. Next Step: If resource utilization of this database is high, we can create read replica to offload the reads and increase server memory and CPU to handle the load. Or else, if possible, application throttling can be infused by reducing the no. of max connections or using application level throttling. Application-wise IO Activities Query no. 2 above provides database level IO, the following SQL statement can be used to track application level IO summary. As there is to one-to-one mapping between application id in pg_stat_activity and pg_stat_io, backend_type is the only way to relate these two admin views. SELECT psa.datname AS dbname, pid, psa.usename AS username, psa.application_name, psa.client_addr as client_ip_addr, psa.xact_start AS transaction_start_time, psa.query_start AS query_start_time, psa.wait_event_type AS db_waitign_on, psa.wait_event AS waiting_activity, CAST(psa.query AS varchar(100)) AS sql_query, state as current_state, psa.backend_type AS db_operation, psi.context AS reason_for_io, psi.reads AS no_of_reads, psi.writes AS no_of_writes FROM pg_stat_activity psa JOIN pg_stat_io psi ON psa.backend_type = psi.backend_type WHERE psa.query LIKE '%<sql-stmt>%'; Interpreting output: username, application_name and client_ip_addr column output can be used to track user who submitted the query, application from where the query was submitted and IP address of the application server from where query was executed. transaction_start_time & query_start_time show the execution start time of transaction and currently active query inside of the transaction. These metrics should be used to find the execution time of transaction and queries inside of the transaction. wait_event and wait_event_type columns output the events on which the query is waiting, if applicable. Refer to the official links for details on wait events and wait event types. reason_for_io column outputs corresponding IO operation. Following are the possible output values to look out for. normal - Read from or write to shared buffers. vacuum - IO used by VACUUM operation. bulkread & bulkwrite - Disk read and write operations. no_of_reads & no_of_writes - Total no. of read and write operations by the query. Example Scenario: So far we have been looking at database-level activities. In most of the cases, we need to track application level activities like read, write operations, application elapsed time (how long the query is getting executed for). These are some of the critical information that DBA should use while troubleshooting query performance or application slowness issue. Whereas pg_stat_statements should be the go to place to look at SQL or application-level statistics, above SQL statement can be used to monitor application level IO operations. Executed SQL statement : SELECT c.cust_id, c.cust_email, c.cust_type, o.order_no, o.order_date FROM customer c, orders o WHERE c.cust_id = o.cust_id ORDER BY o.order_date DESC; Output of the query can be filtered using partial SQL statement in the WHERE clause or using PID of the SQL statement as shown below. Following is the output of the query above (showing only relevant columns): Analysis: Highlighted output above shows 3 types of IO operations - normal, bulkwrite and bulkread. "normal" means that client is reading from buffer, but "bulkread" and "bulwrite" indicates read from disk and write to disk (temporary file write for sorting!). Next Step: SQL statement should to be analysed further for index usage, high disk read and write IO. EXPLAIN (with ANALYZE) statement can be used to understand query behaviour. Other monitoring SQL statements should be used to dig deeper into the execution details. Table & Index Operations The following SQL statement can be used to capture table-level DML operations and its corresponding index read operations. Output of this query can be used to create index if sequential scans on a table is high, also, how an application is impacting the table rows using INSERT, UPDATE, DELETE statements. SELECT t.schemaname AS tabschema, t.relname AS tabname, t.seq_scan AS no_of_seq_scan, t.seq_tup_read AS seq_scan_rows_read, t.n_tup_ins AS rows_inserted, t.n_tup_upd AS rows_updated, t.n_tup_del AS rows_deleted, t.n_live_tup AS total_active_rows, t.n_dead_tup AS total_dead_rows, i.schemaname AS idxschema, i.indexrelname AS idxname, i.idx_tup_read AS idx_rows_read, i.idx_tup_fetch AS idx_rows_fetched FROM pg_stat_all_tables t JOIN pg_stat_all_indexes i ON t.relid = i.relid AND t.relname = i.relname ; Interpreting output: It is almost similar to database activity monitoring except for the following columns. total_dead_rows - Total no. of rows that are not relevant for any transaction in PostgreSQL. total_active_rows - Total no. of actual rows in the table. If the ratio of dead rows vs active rows is higher, it shows VACUUM is not working properly. It can be fixed by running manual vacuum or changing the configuration of AUTOVACUUM. Table level Read IO This SQL statement provides critical metrics on read operations for all or individual tables. heap_blks_read and heap_blks_hit should be used to find out the disk read vs memory read in tables. Higher disk read indicates memory crunch and can be a factor in deciding whether to increase shared memory size. SELECT schemaname AS tabschema, relname AS tabname, heap_blks_read AS no_of_tab_blks_read, heap_blks_hit AS no_of_buffer_blks_read, idx_blks_read AS no_of_idx_blks_read, idx_blks_hit AS no_of_buffer_idx_blks_read FROM pg_statio_all_tables WHERE relname = '<table-name>'; Lock Information Data modification by applications or system commands locks rows and tables. Other application trying to modify the same row will get into waiting state thereby increasing the response time. Following SQL statement can be used to find out what type of locks is being held by applications on all or specific tables. SELECT db.datname AS dbname, tbl.relname AS tblname, lck.pid, lck.locktype , mode AS lock_mode, CASE lck.granted WHEN True THEN 'lock_held' WHEN False THEN 'lock_waiting' ELSE 'not_known' END AS lock_status, lck.waitstart AS lock_wait_start_time FROM pg_database db JOIN pg_locks lck ON lck.database = db.oid JOIN pg_class tbl ON lck.relation = tbl.oid WHERE tbl.relname NOT LIKE '%pg_%' AND tbl.relname = '<tablename>'; Interpreting output: Output rows contain database name, table name, process id of the query and the following fields. locktype - Object of the lock. E.g. table, page, row (tuple) etc. lock_status - Whether the lock has been granted to this application or application is waiting for lock. lock_wait_start_time - If lock waiting state, then when the wait was started. Example Scenario: Following SQL statement takes a lock on "orders" table as it is getting executed inside of a transaction which has not been either committed or rolled back. "Lock Information" SQL can be used to find out who is holding lock on a table as shown below: Next Step: If lock needs to be released then the application with pid 15505 must be terminated using pg_terminate_backend(15505). Who is Holding and who is Waiting for Locks If locks are being held long enough to block a critical application, it becomes imperative to terminate the application holding the lock. Following SQL statement provides information about applications waiting for locks and applications holding those locks so that necessary actions can be taken by DBA. WITH lock_holder AS (SELECT db.datname AS dbname, tbl.relname AS tblname, pid, locktype , mode AS lock_mode FROM pg_database db JOIN pg_locks lck ON lck.database = db.oid JOIN pg_class tbl ON lck.relation = tbl.oid WHERE granted = true), lock_waiter AS (SELECT db.datname AS dbname, tbl.relname AS tblname, pid, locktype , mode AS lock_mode FROM pg_database db JOIN pg_locks lck ON lck.database = db.oid JOIN pg_class tbl ON lck.relation = tbl.oid) SELECT lh.pid AS pid_holding, lh.locktype AS holding_lock_type, lh.lock_mode AS holding_lock_mode, lh.tblname AS holding_lock_table, lw.pid AS pid_waiting, lw.locktype AS waiting_lock_type, lw.lock_mode AS waiting_lock_mode, lw.tblname AS waiting_lock_table FROM lock_holder lh JOIN lock_waiter lw ON lh.tblname = lw.tblname WHERE lw.tblname='<tbl-name>'; Interpreting output: This is an extension of query 11 above. Following are the output columns: pid_holding - Application that is holding lock. holding_lock_type - Object (table, page, row) that has been locked. holding_lock_mode - Lock mode that is being held. holding_lock_table - Table that is being locked. pid_waiting - Application that is waiting for lock. waiting_lock_type - Object (table, page, row) that is waiting for lock. waiting_lock_mode - Lock mode that is needed. waiting_lock_table - Lock on table that is waiting. Example Scenario: There can be scenarios where multiple applications can take write lock on the same rows at the same time. Depending on lock_timeout, one of the applications has to wait for that duration. Criticality of an application might dictate the terms of waiting on locks and DBAs have to terminate application holding the lock. Following is an application that is updating rows in a transaction, but has not released the lock. And following application has timed out because of lock wait. Next Step: Using above query we can find out which application is waiting and who is holding lock on a table as shown below. Depending on priority one of the applications can be terminated by DBA. Diagnostic Flow: The following chart can be used to decide which admin view to use and when. It also shows how Azure Monitor and PostgreSQL admin views work in tandem at any analysis scenarios. Summary: PostgreSQL provides helpful administrative views that can be used by DBAs (Database Administrators) to perform initial level of analysis at engine side before looking at any infrastructure level issues. The initial analysis can be useful in relating infrastructure issues with database performance as well, if there is any.512Views1like0Comments