microsoft sentinel
847 Topics
Defender streaming setup and integration with private event hub
Hey team, Do we know Defeneder supports private endpoint only event hubs to ingest data - I think only public is supported Configure Azure Event Hubs for Microsoft Defender XDR event ingestion - Microsoft Defender XDR | Microsoft Learn Could anyone please clarify?6Views0likes0CommentsMigrate Sentinel to Defender - Why It Is a Security Architecture Decision, Not Just a Portal Change
Microsoft will retire the Sentinel experience in Azure on March 31, 2027. Most of the conversation around this transition focuses on cost optimization and portal consolidation. That framing undersells what is actually happening. The unified Defender portal is not a new interface for the same capabilities. It is the platform foundation for a fundamentally different SOC operating model — one built on a 2-tier data architecture, graph-based investigation, and AI agents that can hunt, enrich, and respond at machine speed. Partners who understand this will help customers build security programs that match how attackers actually operate. This document covers four things: What the unified experience delivers — the security capabilities that do not exist in standalone Sentinel and why they matter against today’s threats. What the transition really involves - is not data migration, but it is a data architecture project that changes how telemetry flows, where it lives, and who queries it. Where the partner opportunity lives — a structured progression from professional services (transactional, transition execution, and advisory) to ongoing managed security services. Why does the unified experience win competitively — factual capability advantages that give partners a defensible position against third-party SIEM alternatives. The Bigger Picture: Preparing for the Agentic SOC Before getting into transition mechanics, partners need to understand where the industry is headed — because the platform decisions made during this transition will determine whether a customer’s SOC is ready for what comes next. The security industry is moving from human-driven, alert-centric workflows to an operating model built on three pillars: Intellectual Property — the detection logic, hunting hypotheses, response playbooks, and domain expertise that differentiate one security team from another. Human Orchestration — the judgment, context, and decision-making that humans bring to complex incidents. Humans set strategy, validate findings, and make containment decisions. They do not manually triage every alert. AI Agents - built agents that execute repeatable work: enriching incidents, hunting across months of telemetry, validating security posture, drafting response actions, and flagging anomalies for human review. The SOC of 2027 will not be scaled by hiring more analysts. It will be scaled by deploying agents that encode institutional knowledge into automated workflows — orchestrated by humans who focus on the decisions that require judgment. This transformation requires a platform that provides three things: Deep telemetry — agents need months of queryable data to analyze behavioral patterns, build baselines, and detect slow-moving threats. The Sentinel data lake provides this at a cost point that makes long-retention feasible. Relationship context — agents need to understand how entities connect. Which accounts share credentials? What is the blast radius of a compromised service principle? What is the attack path from a phished user to domain admin? Sentinel Graph provides this. Extensibility — partners and customers need to build and deploy their own agents without waiting for Microsoft to ship them. The MCP framework and Copilot agent architecture provide this. None of these exist in Azure experience for Sentinel. All three ship with the Defender experience. The urgency goes beyond the March 2027 deadline. Organizations are deploying AI agents, copilots, and autonomous workflows across their businesses — and every one of those creates a new attack surface. Prompt injection, data poisoning, agent hijacking, cross-plugin exploitation — these are not theoretical risks. They are in the wild today. Defending against AI-powered attacks requires a security platform that is itself AI Agent-ready. The new experience in Defender unlocks this experience. What Unified SIEM and XDR Actually Delivers The original framing — “single pane of glass for SIEM and XDR” — is accurate but insufficient. Here is what the unified platform delivers that standalone Sentinel does not. Cross-Domain Incident Correlation The Defender correlation engine does not just group alerts by time proximity. It builds multi-stage incident graphs that link identity compromise to lateral movement to data exfiltration across SIEM and XDR telemetry — automatically. Consider a token theft chain: an infostealer harvests browser session cookies (endpoint telemetry), the attacker replays the token from a foreign IP (Entra ID sign-in logs), creates a mailbox forwarding rule (Exchange audit logs), and begins exfiltrating data (DLP alerts). In standalone Sentinel, these are four separate alerts in four different tables. In the unified platform, they are one correlated incident with a visual attack timeline. 2-Tier Data Architecture The Sentinel data lake introduces a second storage tier that changes the economics and capabilities of security telemetry: Analytics Tier Data Lake Purpose Real-time detection rules, SOAR, alerting Hunting, forensics, behavioral analysis, AI agent queries Latency Sub-5-minute query and alerting Minutes to hours acceptable Cost ~$4.30/GB PAYG ingestion (~$2.96 at 100 GB/day commitment) ~$0.05/GB ingestion + $0.10/GB data processing (at least 20x cheaper) Retention 90 days default (expensive to extend) Up to 12 years at low cost Best for High-signal, low-volume sources High-volume, investigation-critical sources The architecture decision is not “which tier is cheaper.” It is “which tier gives me the right detection capability for each data source.” Analytics tier candidates: Entra ID sign-in logs, Azure activity, audit logs, EDR alerts, PAM events, Defender for Identity alerts, email threat detections. These need sub-5-minute alerting. Data lake candidates: Raw firewall session logs, full DNS query streams, proxy request logs, Sysmon process events, NSG flow logs. These drive hunting and forensic analysis over weeks or months. Dual-ingest sources: Some sources need both tiers. Entra ID sign-in logs are the canonical example — analytics tier for real-time password spray detection, Data Lake for graph-based blast radius analysis across months of authentication history. Implementation is straightforward: a single Data Collection Rule (DCR) transformation handles the split. One collection point, two routing destinations. The right framing: “Right data in the right tier = better detections AND lower cost.” Cost savings are a side effect of good security architecture, not the goal. Sentinel Graph Sentinel graph enables SOC teams and AI agents to answer questions that flat log queries cannot: What is the blast radius of this compromised account? Which service principals share credentials with the breached identity? What is the attack path from this phished user to domain admin? Which entities are connected to this suspicious IP across all telemetry sources? Graph-based investigation turns isolated alerts into context-rich intelligence. It is the difference between knowing “this account was compromised” and understanding “this account has access to 47 service principals, 3 of which have written access to production Key Vault.” Security Copilot Integration Security Copilot embedded in the defender portal helps analysts summarize incidents, generate hunting queries, explain attacker behavior, and draft response actions. For complex multi-stage incidents, it reduces the time from “I see an alert” to “I understand the full scope” from hours to minutes. With free SCUs available with Microsoft 365 E5, teams can apply AI to the highest-effort investigation work without adding incremental cost. MCP and the Agent Framework The Model Context Protocol (MCP) and Copilot agent architecture let partners and customers build purpose-built security agents. A concrete example: an MCP-enabled agent can automatically enrich a phishing incident by querying email metadata, checking the sender against threat intelligence, pulling the user’s recent sign-in patterns, correlating with Sentinel Graph for lateral risk, and drafting a containment recommendation — in under 60 seconds. This is where partner intellectual property becomes competitive advantage. The agent framework is the mechanism for encoding proprietary detection logic, response playbooks, and domain expertise into automated workflows that run at machine speed. Security Store Security Store allows partners to evolve from one‑time transition projects into repeatable, scalable offerings—supporting professional services, managed services, and agent‑based IP that align with the customer’s unified SecOps operating model As part of the transition, the Microsoft Security Store becomes the extension layer for the Defender —allowing partners to deliver differentiated agents, SaaS, and security services natively within Defender and Sentinel, instead of building and integrating in isolation The 4 Investigation Surfaces: A Customer Maturity Ladder The Sentinel Data Lake exposes four distinct investigation surfaces, each representing a step toward the Agentic SOC — and a partner service opportunity: Surface Capability Maturity Level Partner Opportunity KQL Query Ad-hoc hunting, forensic investigation Basic — “we can query” Hunting query libraries; KQL training Graph Analytics Blast radius, attack paths, entity relationships Intermediate — “we understand relationships” Graph investigation training; attack path workshops Notebooks (PySpark) Statistical analysis, behavioral baselines, ML models Advanced — “we predict behaviors” Custom notebook development; anomaly scoring Agent/MCP Access Autonomous hunting, triage, response at machine speed Agentic SOC — “we automate” Custom agent development; MCP integration The customer who starts with “help us hunt better” ends up at “build us agents that hunt autonomously.” That is the progression from professional services to managed services. What the Transition Actually Involves It is not a data migration — customers’ underlying log data and analytics remain in their existing Log Analytics workspaces. That is important for partners to communicate clearly. But partners should not set the expectation that nothing changes except the URL. Microsoft’s official transition guide documents significant operational changes — including automation rules and playbooks, analytics rule, RBAC restructuring to the new unified model (URBAC), API schema changes that break ServiceNow and Jira integrations, analytics rule transitions where the Fusion engine is replaced by the Defender XDR correlation engine, and data policy shifts for regulated industries. Most customers cannot navigate this complexity without professional help. Important: Transitioning to the Defender portal has no extra cost - estimate the billing with the new Sentinel Cost Estimator Optimizing the unified platform means making deliberate changes: Adding dual-ingest for critical sources that need both real-time detection and long-horizon hunting. Moving high-volume telemetry to the Data Lake — enabling hunting at scale that was previously cost-prohibitive. Retiring redundant data copies where Defender XDR already provides the investigation capability. Updating RBAC, automation, and integrations for the unified portal’s consolidated schema and permission structure. Training analysts on new investigation workflows, Sentinel Graph navigation, and Copilot-assisted triage. Threat Coverage: The Detection Gap Most Organizations Do Not Know They Have This transition is an opportunity to quantify detection maturity — and most organizations will not like what they find. Based on real-world breach analysis — infostealers, business email compromise, human-operated ransomware, cloud identity abuse, vulnerability exploitation, nation-state espionage, and other prevalent threat categories — organizations running standalone Sentinel with default configurations typically have significant detection gaps. Those gaps cluster in three areas: Cross-domain correlation gaps — attacks that span identity, endpoint, email, and cloud workloads. These require the Defender correlation engine because no single log source tells the complete story. Long-retention hunting gaps — threats like command-and-control beaconing and slow data exfiltration that unfold over weeks or months. Analytics-tier retention at 90 days is too expensive to extend and too short for historical pattern analysis. Graph-based analysis gaps — lateral movement, blast radius assessment, and attack path analysis that require understanding entity relationships rather than flat log queries. The unified platform with proper log source coverage across Microsoft-native sources can materially close these gaps — but only if the transition includes a detection coverage assessment, not just a portal cutover. Partners should use MITRE ATT&CK as the common framework for measuring detection maturity. Map existing detections to ATT&CK tactics and techniques before and after transition — a measurable, defensible improvement that justifies advisory fees and ongoing managed services. Partner Opportunity: Professional Services to Managed Services This transition creates a structured progression for all partner types — from professional services that build trust and surface findings, to managed security services that deliver ongoing value. The key insight most partners miss: do not jump from “transition assessment” to “managed services pitch.” Customers are not ready for that conversation until they have experienced the value of professional services. The bridge engagement — whether transactional, transition execution, or advisory — builds trust, demonstrates the expertise, and surfaces the findings that make the managed services conversation a logical next step. Professional Services (transactional + transition execution + advisory) → Managed Security Services (MSSP) The USX transition is the ideal professional services entry point because it combines a mandatory deadline (March 2027) with genuine technical complexity (analytics rule, automation behavioral changes, RBAC restructuring, API schema shifts) that most customers cannot navigate alone. Every engagement produces findings — detection gaps, automation fragility, staffing shortfalls — that are the most credible possible evidence for managed services. Professional Services Transactional Partners Offer Customer Value Key Deliverables Transition Readiness Assessment Risk-mitigated transition with clear scope Sentinel deployment inventory; Defender portal compatibility check; transition roadmap with timeline; MITRE ATT&CK detection coverage baseline Transition Execution and Enablement Accelerated time-to-value, minimal disruption Workspace onboarding; RBAC and automation updates; Dual-portal testing and validation; SOC team training on unified workflows Security Posture and Detection Optimization Better detections and lower cost Data ingestion and tiering strategy; Dual-ingest implementation for critical sources; Detection coverage gap analysis; Automation and Copilot/MCP recommendations Advisory Partners Offer Customer Value Key Deliverables Executive and Strategy Advisory Leadership alignment on why this transition matters Unified SecOps vision and business case; Zero Trust and SOC modernization alignment; Stakeholder alignment across security, IT, and leadership Architecture and Design Advisory Future-ready architecture optimized for the Agentic SOC Target-state 2-tier data architecture; Dual-ingest routing decisions mapped to MITRE tactics; RBAC, retention, and access model design Detection Coverage and Gap Analysis Measurable detection maturity improvement Current-state MITRE ATT&CK coverage mapping; Gap analysis against 24 threat patterns; Detection improvement roadmap with priority recommendations SOC Operating Model Advisory Smooth analyst adoption with clear ownership Redesigned SOC workflows for unified portal; Incident triage and investigation playbooks; RACI for detection engineering, hunting, and platform ops Agentic SOC Readiness Preparation for AI-driven security operations MCP and agent architecture assessment; Custom agent development roadmap; IP + Human Orchestration + Agent operating model design Cost, Licensing and Value Advisory Transparent cost impact with strong business case Current vs. future cost analysis; Data tiering optimization recommendations; TCO and ROI modeling for leadership The conversion to managed services is evidence-based. Every professional services engagement produces findings — detection gaps, automation fragility, staffing shortfalls. Those findings are the most credible possible case for ongoing managed services. Managed Security Services The unified platform changes the managed security conversation. Partners are no longer selling “we watch your alerts 24/7.” They are selling an operating model where proprietary AI agents handle the repeatable work — enrichment, hunting, posture validation, response drafting — and human experts focus on the decisions that require judgment. This is where the competitive moat forms. The formula: IP + Human Orchestration + AI Agents = differentiated managed security. The unified platform enables this through: Multi-tenancy — the built-in multitenant portal eliminates the need for third-party management layers. Sentinel Data Lake — agents can query months of customer telemetry for behavioral analysis without cost constraints. Sentinel Graph — agents can traverse entity relationships to assess blast radius and map attack paths. MCP extensibility — partners can build agents that integrate with proprietary tools and customer-specific systems. Partners who build proprietary agents encoding their detection logic into the MCP framework will differentiate from partners who rely on out-of-box capabilities. The Securing AI Opportunity Organizations are deploying AI agents, copilots, and autonomous workflows across their businesses at an accelerating pace. Every AI deployment creates a new attack surface — prompt injection, data poisoning, agent hijacking, cross-plugin exploitation, unauthorized data access through agentic workflows. These are not theoretical risks. They are in the wild today. Partners who can help customers secure their AI deployments while also using AI to strengthen their SOC will command premium positioning. This requires a security platform that is itself AI Agent-ready — one that can deploy defensive agents at the same pace organizations deploy business AI. The unified Defender portal is that platform. Partners who position USX as “preparing your SOC for AI-driven security operations” will differentiate from partners who position it as “moving to a new portal.” Cost and Operational Benefits Better security architecture also costs less. This is not a contradiction — it is the natural result of putting the right data in the right tier. Benefit How It Works Eliminate low-value ingestion Identify and remove log sources that are never used for detections, investigations, or hunting. Immediately lowers analytics-tier costs without impacting security outcomes. Right-size analytics rules Disable unused rules, consolidate overlapping detections, and remove automation that does not reduce SOC effort. Pay only for processing that delivers measurable security value. Avoid SIEM/XDR duplication Many threats can be investigated directly in Defender XDR without duplicating telemetry into Sentinel. Stop re-ingesting data that Defender already provides. Tier data by detection need Store high-volume, hunt-oriented telemetry in the Data Lake at at least 20x lower cost. Promote only high-signal sources to the analytics tier. Full data fidelity preserved in both tiers. Reduce operational overhead Unified SIEM+XDR workflows in a single portal reduce tool switching, accelerate investigations, simplify analyst onboarding, and enable SOC teams to scale without proportional headcount increases. Improve detection quality The Defender correlation engine produces higher-fidelity incidents with fewer false positives. SOC teams spend less time triaging noise and more time on real threats. Competitive Positioning Partners need defensible talking points when customers evaluate third-party SIEM alternatives. The following advantages are factual, sourced from Microsoft’s transition documentation and platform capabilities — not marketing claims. No extra cost for transitioning — even for non-E5 customers. Third-party SIEM migrations involve licensing, data migration, detection rewrite, and integration rebuild costs. Native cross-domain correlation across Sentinel + Defender products into multi-stage incident graphs. Third-party SIEMs receive Microsoft logs as flat events — they lack the internal signal context, entity resolution, and product-specific intelligence that powers cross-domain correlation. Custom detections across SIEM + XDR — query both Sentinel and Defender XDR tables without ingesting Defender data into Sentinel. Eliminates redundant ingestion cost. Alert tuning extends to Sentinel — previously Defender-only capability, now applicable to Sentinel analytics rules. Net-new noise reduction. Unified entity pages — consolidated user, device, and IP address pages with data from both Sentinel and Defender XDR, plus global search across SIEM and XDR. Third-party SIEMs provide entity views from ingested data only. Built-in multi-tenancy for MSSPs — multitenant portal manages incidents, alerts, and hunting across tenants without third-party management layers. Try out the new GDAP capabilities in Defender portal. Industry validation: Microsoft’s SIEM+XDR platform has been recognized as a Leader by both Forrester (Security Analytics Platforms, 2025) and Gartner (SIEM Magic Quadrant, 2025). Summary: What Partners Should Take Away Topic Key Message Framing USX is a security architecture transformation, not a portal transition. Lead with detection capability, not cost savings. Platform foundation Sentinel Data Lake + Sentinel Graph + MCP/Agent Framework = the platform for the Agentic SOC. 4 investigation surfaces KQL → Graph → Notebooks → Agent/MCP. A maturity ladder from “we can query” to “we automate at machine speed.” Architecture 2-tier data model (analytics + Data Lake) with dual-ingest for critical sources. Cost savings are a side effect of good architecture. Transition complexity Analytics rules and automation rules. API schema changes. RBAC restructuring. Most customers need professional help. Partner engagement model Professional Services (transactional + transition execution + advisory) → Managed Services (MSSP). Competitive positioning No extra cost. Native correlation. Cross-domain detections. Built-in multi-tenancy. Capabilities third-party SIEMs cannot replicate. Partner differentiation IP + Human Orchestration + AI Agents. Partners who build proprietary agents on MCP have competitive advantage. Timeline March 31, 2027. Start now — phased transition with one telemetry domain first, then scale.3.3KViews4likes5CommentsIntroducing Multi-Account Support for Connectors in Microsoft Sentinel
We're excited to announce that Microsoft Sentinel's data connectors for Auth0, CrowdStrike Falcon, and Salesforce Service Cloud now support multi-account ingestion — enabling you to connect and monitor multiple accounts or tenants from a single, unified connector configuration. The Challenge with Multi-Account Environments Modern enterprises don't run on a single account. Whether it's multiple Salesforce orgs across business units, several CrowdStrike tenants spanning subsidiaries, or Auth0 environments segmented by product line — security teams have long struggled to get unified visibility across all of them in a single SIEM. Until now, connecting multiple accounts from the same platform required painful workarounds: duplicate configurations, custom scripts, or dangerous blind spots in security coverage. Introducing Multi-Account Support for Auth0, CrowdStrike, and Salesforce in Microsoft Sentinel We're excited to announce that Microsoft Sentinel's data connectors for Auth0, CrowdStrike Falcon, and Salesforce Service Cloud now support multi-account ingestion — powered by the Codeless Connector Framework (CCF). You can now connect and monitor multiple accounts or tenants from a single, unified connector configuration — no scripts, no hacks. What's New? 🔑 Auth0 — Multi-Tenant Identity Monitoring Security teams managing multiple Auth0 tenants can now ingest logs from all of them into a single Sentinel workspace. Get complete visibility into authentication events, anomalous login patterns, and policy violations across every tenant without switching contexts. 🦅 CrowdStrike Falcon — Consolidated Endpoint Telemetry Organizations running multiple CrowdStrike tenants (e.g., across M&A entities or regional subsidiaries) can now stream detection alerts, threat intelligence, and endpoint telemetry from all tenants into Sentinel. One workspace. Full coverage. ☁️ Salesforce — Cross-Org Security Insights Enterprises with multiple Salesforce orgs can now centralize audit logs, login history, and API activity across all orgs. Detect insider threats, unauthorized access, and compliance gaps without stitching data together manually. 📖Find relevant connectors at Discover connectors Why It Matters Before After One connector = one account One connector = multiple accounts Manual workarounds for multi-tenant coverage Native, built-in multi-account support Fragmented detection across environments Unified analytics and incident correlation Higher operational overhead Streamlined configuration and management Getting Started Connecting multiple accounts is straightforward: 1. Navigate to Microsoft Sentinel → Data Connectors 2. Search for Auth0, CrowdStrike Falcon, or Salesforce 3. Open the connector and select "Add Account" 4. Authenticate and authorize each additional account 5. Start ingesting — your analytics rules, workbooks, and playbooks apply automatically across all accounts Built for Scale, Built for SOC Teams This update is part of our continued investment in making Microsoft Sentinel the most comprehensive and operationally efficient SIEM for enterprise environments. Multi-account support reduces configuration overhead, closes coverage gaps, and empowers SOC analysts to detect and respond to threats wherever they originate. What's Next? We're actively expanding multi-account support to more connectors. Stay tuned to the Microsoft Sentinel Blog and share your feedback!
How Granular Delegated Admin Privileges (GDAP) allows Sentinel customers to delegate access
Simplifying Defender SIEM and XDR delegated access As Microsoft Sentinel and Defender converge into a unified experience, organizations face a fundamental challenge: the lack of a scalable, comprehensive, delegated access model that works seamlessly across Entra ID and Sentinel’s Azure Resource Manage creating a significant barrier for Managed Security Service Providers (MSSPs) and large enterprises with complex multi-tenant structures. Extending GDAP beyond CSPs: a strategic solution In response to these challenges, we have developed an extension to GDAP that makes it available to all Sentinel and Defender customers, including non-CSP organizations. This expansion enables both MSSPs and customers with multi-tenant organizational structures to establish secure, granular delegated access relationships directly through the Microsoft Defender portal. This is now available in public preview. The GDAP extension aligns with zero-trust security principles through a three-way handshake model requiring explicit mutual consent between governing and governed tenants before any relationship is established. This consent-based approach enhances transparency and accountability, reducing risks associated with broad, uncontrolled permissions. By integrating with Microsoft Defender, GDAP enables advanced threat detection and response capabilities across tenant boundaries while maintaining granular permission management through Entra ID roles and Unified RBAC custom permissions. Delivering unified management of delegated access across SIEM and XDR With GDAP, customers gain a truly unified way to manage access across both Microsoft Sentinel and Defender—using a single, consistent delegated access model for SIEM and XDR. For Sentinel customers, this brings parity with the Azure portal experience: where delegated access was previously managed through Azure Lighthouse, it can now be handled directly in the Defender portal using GDAP. More importantly, for organizations running SIEM and XDR together, GDAP eliminates the need to switch between portals—allowing teams to view, manage, and govern security access from one centralized experience. The result is simpler administration, reduced operational friction, and a more cohesive way to secure multi-tenant environments at scale. How GDAP for non-CSPs works: the three-step handshake The GDAP handshake model implements a security-first approach through three distinct steps, each requiring explicit approval to prevent unauthorized access. Step 1 begins with the governed tenant initiating the relationship, allowing the governing tenant to request GDAP access. Step 2 shifts control to the governing tenant, which creates and sends a delegated access request with specific requested permissions through the multi-tenant organization (MTO) portal. Step 3 returns to the governed tenant for final approval. The approach provides customers with complete visibility and control over who can access their security data and with what permissions, while giving MSSPs a streamlined, Microsoft-supported mechanism for managing delegated relationships at scale. Step 4 assigns Sentinel permissions. In Azure resource management, assign governing tenant’s groups with Sentinel workspaces permissions (in the governed tenant), selecting the governing tenant’s security groups used in the created relationship. Learn more here: Configure delegated access with governance relationships for multitenant organizations - Unified se…6.2KViews2likes25CommentsDefender XDR: Tables not supported for table management
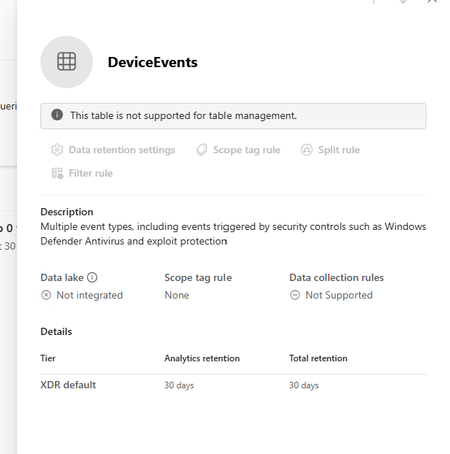
I am trying to extend the table retention of specific tables to allow them to flow to Sentinel Analytics but keep getting the message "This table is not supported for table management" in the Sentinel > Configuration > Tables page. The Sentinel workspace is connected in System > Settings > Microsoft Sentinel. I can see the table type is XDR in the list which seems to be the reason why it can't be managed. Any ideas why this table is not able to be managed.313Views0likes1CommentIntegrating Proofpoint and Mimecast Email Security with Microsoft Sentinel
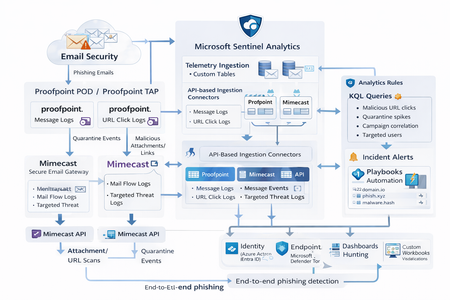
Microsoft Sentinel can ingest rich email security telemetry from Proofpoint and Mimecast to power advanced phishing detection. The Proofpoint On Demand (POD) Email Security and Proofpoint Targeted Attack Protection (TAP) connectors pull threat logs (quarantines, spam, phishing attempts) and user click data into Sentinel. Similarly, the Mimecast Secure Email Gateway connector ingests detailed mail flow and targeted-threat logs (attachment/URL scans, impersonation events). These integrations use Azure-hosted ingestion (via Logic Apps or Azure Functions) and the new Codeless Connector framework to call vendor APIs on a schedule. The result is a consolidated dataset in Sentinel’s Log Analytics, enabling correlated alerting and hunting across email, identity, and endpoint signals. Figure: Phishing emails are processed by Mimecast’s gateway and Proofpoint POD/TAP services. Security logs (delivery/quarantine events, malicious attachments/links, user clicks) flow into Microsoft Sentinel. In Sentinel, these mail signals are correlated with identity (Azure AD), endpoint (Defender) and network telemetry for end-to-end phishing detection. Proofpoint POD (Email Protection) Connector The Proofpoint POD connector ingests core email protection logs. It creates two tables, ProofpointPODMailLog_CL and ProofpointPODMessage_CL. These logs include per-message metadata (senders, recipients, subject, message size, timestamps), threat scores (spamScore, phishScore, malwareScore, impostorScore), and attachment details (number of attachments, names, hash values and sandbox verdicts). Quarantine actions are recorded (quarantine folder/rule) and malicious indicators (URL or file hash) and campaign IDs are tagged in the threatsInfoMap field. For example, each ProofpointPODMessage_CL record may carry a sender_s (sender email domain hashed), recipient list, subject, and any detected threat type (Phish/Malware/Spam/Impostor) with associated threat hash or URL. Deployment: Proofpoint POD uses Sentinel’s codeless connector (an Azure Function behind the scenes). You must provide Proofpoint API credentials (Cluster ID and API token) in the connector UI. The connector periodically calls the Proofpoint SIEM API to fetch new log events (typically in 1–2 hour batches). The data lands in the above tables. (Older custom logic-app approaches similarly parse JSON output from the /v2/siem/messages endpoints.) Proofpoint TAP (Targeted Attack Protection) Connector Proofpoint TAP provides user-click and message-delivery events. Its connector creates four tables: ProofPointTAPMessagesDeliveredV2_CL, ProofPointTAPMessagesBlockedV2_CL, ProofPointTAPClicksPermittedV2_CL, and ProofPointTAPClicksBlockedV2_CL. The message tables report emails with detected threats (URL or attachment defense) that were delivered or blocked by TAP. They include the same fields as POD (message GUID, sender, recipients, subject, threat campaign ID, scores, attachments info). The click tables log when users click on URLs: each record has the URL, click timestamp (clickTime), the user’s IP (clickIP), user-agent, the message GUID, and the threat ID/category. These fields allow you to see who clicked which malicious link and when. As the connector description notes, these logs give “visibility into Message and Click events in Microsoft Sentinel” for hunting. Deployment: The TAP connector also uses the codeless framework. You supply a TAP API service principal and secret (proofpoint SIEM API credentials) in the Sentinel content connector. The function app calls TAP’s /v2/siem/clicks/blocked, /permitted, /messages/blocked, and /delivered endpoints. The Proofpoint SIEM API limits queries to 1-hour windows and 7-day history, with no paging (all events in the interval are returned). (A Logic App approach could also be used, as shown in the Tech Community blog: one HTTP GET per event type and a JSON Parse before sending to Log Analytics.) Mimecast Secure Email Gateway Connector The Mimecast connector ingests the Secure Email Gateway (SEG) logs and targeted-threat (TTP) logs. Inbound, outbound and internal mail events from the Mimecast MTA (receipt, processing, delivery stages) are pulled via the API. Typical fields include the unique message ID (aCode), sender, recipient, subject, attachment count/names, and the policy actions or holds (e.g. spam quarantine). For example, the Mimecast “Process” log shows AttCnt, AttNames, and if the message was held (Hld) for review. Delivery logs include the success/failure and TLS details. In addition, Mimecast TTP logs are collected: URL Protect logs (when a user clicks a blocked URL) include the clicked URL (url), category (urlCategory), sender/recipient, and block reason. Impersonation Protect logs capture spoofing detections (e.g. if an internal name is impersonated), with fields like Sender, Recipient, Definition and Action (hold/quarantine). Attachment Protect logs record malicious file detections (filename, hash, threat type). Deployment: Like Proofpoint, Mimecast’s connector uses Azure Functions via the Sentinel content hub. You install the Mimecast solution, open the connector page, then enter Azure app credentials and Mimecast API keys (API Application ID/Key and Access/Secret for the service account). As shown in the deployment guide, you must provide the Azure Subscription, Resource Group, Log Analytics Workspace and the Azure Client (App) ID, Tenant ID and Object ID of the admin performing the setup. On the Mimecast side, you supply the API Base URL (regional), App ID/Secret and user Access/Secret. The connector creates a Function App that polls Mimecast’s SIEM APIs on a cron schedule (default every 30 minutes). You can optionally specify a start date for backfilling up to 7 days of logs. The default tables are MimecastSIEM_CL (for email flow logs) and MimecastDLP_CL (for DLP/TTP events), though custom names can be set. Ingestion Considerations Data Latency: All these connectors are pull-based and typically run on a schedule (often 30–60 minutes). For example, the Proofpoint POD docs note hourly log increments, and Mimecast logs are aggregated every 30 minutes. Expect a delay of up to an hour or more from event occurrence to Sentinel ingestion. Schema Nuances: The APIs often return nested arrays and optional fields. For instance, the Proofpoint blog warns that some JSON fields can be null or vary in type, so the parse schema should account for all possibilities. Similarly, Mimecast logs come in pipe-delimited or JSON format, with values sometimes empty (e.g. no attachments). In KQL, use tostring() or parse_json() on the raw _CL columns, and mv-expand on any multivalue fields (like message parts or threat lists). Table Names: Use the connector’s tables as listed. For Proofpoint: ProofpointPODMailLog_CL and ProofpointPODMessage_CL; for TAP: ProofPointTAPMessagesDeliveredV2_CL, ProofPointTAPMessagesBlockedV2_CL, ProofPointTAPClicksPermittedV2_CL, ProofPointTAPClicksBlockedV2_CL. For Mimecast SEG/TTP: MimecastSIEM_CL (seg logs) and MimecastDLP_CL (TTP logs). API Behavior: The Proofpoint TAP API has no paging. Be aware of timezones (Proofpoint uses UTC) and use the Sentinal ingestion TimeGenerated or event timestamp fields for binning. Detection Engineering and Correlation To detect phishing effectively, we correlate these email logs with identity, endpoint and intel data: Identity (Azure AD): Mail logs contain recipient addresses and (hashed) sender user parts. A common tactic is to correlate SMTP recipients or sender domains with Azure AD user records. For example, join TAP clicks by recipient to the user’s UPN. The Proofpoint logs also include the clicker’s IP (clickIP); we can match that to Azure AD sign-in logs or VPN logs to find which device/location clicked a malicious link. Likewise, anomalous Azure AD sign-ins (impossible travel, MFA failure) after a suspicious email can strengthen the case. Endpoints (Defender): Once a user clicks a bad link or opens a malicious attachment (captured in TAP or Mimecast logs), watch for follow-on behaviors. For instance, use Sentinel’s DeviceSecurityEvents or DeviceProcessEvents to see if that user’s machine launched unusual processes. The threatID or URL hash from email events can be looked up in Defender’s file data. Correlate by username (if available) or IP: if the email log shows a link click from IP X, see if any endpoint alerts or logon events occurred from X around the same time. As the Mimecast integration touts, this enables “correlation across Mimecast events, cloud, endpoint, and network data”. Threat Intelligence: Use Sentinel’s ThreatIntelligenceIndicator tables or Microsoft’s TI feeds to tag known bad URLs/domains in the email logs. For example, join ProofPointTAPClicksBlockedV2_CL on the clicked url against ThreatIntelligenceIndicator (type=URL) to automatically flag hits. Proofpoint’s logs already classify threats (malware/phish) and provide a threatID; one can enrich that with external intel (e.g. check if the hash appears in TI feeds). Mimecast’s URL logs include a urlCategory field, which can be mapped to known malicious categories. Automated playbooks can also pull Intel: e.g. use Sentinel’s TI REST API or Azure Sentinel watchlists containing phishing domains to annotate events. In summary, a robust detection strategy might look like: (1) Identify malicious email events (high phish scores, quarantines, URL clicks). (2) Correlate these events by user with Azure AD logs (did the user log in from a new IP after a phish click?). (3) Correlate with endpoint alerts (Defender found malware on that device). (4) Augment with threat intelligence lookups on URLs and attachments from the email logs. By linking the Proofpoint/Mimecast signals to identity and endpoint events, one can detect the full attack chain from email compromise to endpoint breach. KQL Query Here are representative Kusto queries for common phishing scenarios (adapt table/field names as needed): Malicious URL Click Detection: Identify users who clicked known-malicious URLs. For example, join TAP click logs to TI indicators:This flags any permitted click where the URL matches a known threat indicator. Alternatively, aggregate by domain: let TI = ThreatIntelligenceIndicator | where Active == true and _EntityType == "URL"; ProofPointTAPClicksPermittedV2_CL | where url_s != "" | project ClickTime=TimeGenerated, Recipient=recipient_s, URL=url_s, SenderIP=senderIP_s | join kind=inner TI on $left.URL == TI._Value | project ClickTime, Recipient, URL, Description=TI.Description This flags any permitted click where the URL matches a known threat indicator. Alternatively, aggregate by domain: ProofPointTAPClicksPermittedV2_CL | extend clickedDomain = extract(@"https?://([^/]+)", 1, url_s) | summarize ClickCount=count() by clickedDomain | where clickedDomain has "maliciousdomain.com" or clickedDomain has "phish.example.com" Quarantine Spike (Burst) Detection: Detect sudden spikes in quarantined messages. For example, using POD mail log:This finds hours with an unusually high number of held (quarantined) emails, which may indicate a phishing campaign. You could similarly use ProofPointTAPMessagesBlockedV2_CL. ProofpointPODMailLog_CL | where action_s == "Held" | summarize HeldCount=count() by bin(TimeGenerated, 1h) | order by TimeGenerated desc | where HeldCount > 100 Targeted User Phishing: Find if a specific user received multiple malicious emails. E.g., for user email address removed for privacy reasons:This lists recent phish attempts targeting Username. You might also join with TAP click logs to see if she clicked anything. ProofpointPODMessage_CL | where recipient has "email address removed for privacy reasons" | where array_length(threatsInfoMap) > 0 and threatsInfoMap_classification_s == "Phish" | project TimeGenerated, sender_s, subject_s, threat=threatsInfoMap_threat_s Campaign-Level Analysis: Group emails by Proofpoint campaign ID to see scope of each campaign:This shows each campaign ID with how many unique recipients were hit and one example subject. Combining TAP and POD tables on GUID_s or QID_s can further link click events back to the originating message/campaign. ProofpointPODMessage_CL | mv-expand threatsInfoMap | summarize Recipients=make_set(recipient), Count=dcount(recipient) by CampaignID=threatsInfoMap_campaignId_s | project CampaignID, RecipientCount=Count, Recipients, SampleSubject=any(subject_s) Each query can be refined (for instance, filtering only within a recent time window) and embedded in Sentinel Analytics rules or hunting. The key is using the connectors’ fields – URLs, sender/recipient addresses, campaign IDs – to pivot between email data and other security signals.1.9KViews8likes1Comment
Building Microsoft Sentinel Connectors in Minutes with the Sentinel Connector Builder Agent
Overview We previously announced the public preview of the Microsoft Sentinel connector builder agent via VS code extension, that helps developers build Microsoft Sentinel codeless connectors faster with low-code and AI-assisted prompts. This post walks through a hands-on lab using a mock Network Log API to demonstrate how the Sentinel connector builder agent simplifies building Codeless Connector Framework (CCF) pull connectors. Instead of manually creating ingestion infrastructure and configuration files, you’ll use a guided, conversational workflow in VS Code to generate connector artifacts, test them against a live API, and deploy them into Microsoft Sentinel. The lab focuses on the end-to-end experience ranging from API setup to validated connector deployment so you can see how quickly a working integration can be produced. For additional guidance beyond this lab, refer to our MS Learn documentation. The Lab Environment This lab is built around a mock Network Log API hosted as an Azure Function App. The purpose of the lab environment is to give us a live API that we can use to build, validate, and test the Sentinel CCF connector builder agent against end to end. The API exposes 50 synthetic network activity records that look and behave like a real product data source, including web traffic, DNS requests, blocked remote access attempts, malware command-and-control blocks, VPN activity, and other common network events. That makes it a useful stand-in for the type of telemetry many teams want to onboard into Microsoft Sentinel. The API is intentionally shaped like the kind of source a customer might expose for telemetry retrieval. It uses API key authentication through the X-API-Key header, returns paginated results through a nextLink model, and provides a predictable response structure that the builder agent can map into a pull connector configuration. The repo contains everything needed for the walkthrough. There is an ARM template to deploy the Function App, reference documentation for the API, and a sample connector package showing the generated polling config, table schema, DCR, and connector definition. The end goal of the lab is straightforward: use the builder agent to generate a CCF pull connector that ingests this API into the custom NetworkLogAPIGetNetworkLogs_CL table in Sentinel. Prerequisites Before starting, make sure you have the following: Azure subscription -- with Contributor access on a resource group (for deploying the Function App) and Microsoft Sentinel Contributor access on a Sentinel-enabled workspace (for deploying the connector) Microsoft Sentinel workspace -- an existing Log Analytics workspace with Sentinel enabled. See Onboard Microsoft Sentinel to a Log Analytics workspace for more information. Azure CLI -- See How to install the Azure CLI for more information. VS Code with the Microsoft Sentinel for Visual Studio Code extension installed. GitHub Copilot -- with access to premium models. The connector builder agent requires Claude Sonnet 4.5 or 4.6, which uses Copilot premium model credits. Lab Repository -- Once the aforementioned prerequisites are met, you can access the lab repository here: Azure-Sentinel/Tools/CCF-Connector-Builder-Agent-Accelerator at master · Azure/Azure-Sentinel Deploying the Mock API The full CLI commands for this section are available in the repo. For a simpler option, you can use GitHub Copilot to handle the deployment. Enter this prompt: Follow the deployment instructions in Sentinel-CCF-Pull-Connector-Builder-Agent-Accelerator/agent-instructions.md. Let’s deploy the Network Log API and build a CCF pull connector. At a high level, the setup is four steps: clone the repo, create a resource group, ensure you have a Sentinel-enabled workspace, and deploy the Function App using the included ARM template. The template takes two parameters: an ApiKey of your choice (the secret the CCF connector will use to authenticate) and your Log Analytics workspace resource ID for Application Insights. Deployment takes about two to three minutes and outputs the FunctionAppName and endpoint URLs you will need later. Once deployed, verify the API is live: curl -s -H "X-API-Key: <your-api-key>" \ "https://<functionappname>.azurewebsites.net/api/GetNetworkLogs?page=1&pageSize=3" </functionappname></your-api-key> You should see a response like this: The API also exposes an /api/RefreshData endpoint that regenerates the 50 sample records with fresh timestamps. This is useful later in the walkthrough when you want to produce new events and trigger an immediate ingestion cycle without waiting for the next polling interval: curl -s -X POST -H "X-API-Key: <your-api-key>" \ "https://<functionappname>.azurewebsites.net/api/RefreshData" </functionappname></your-api-key> Building the Connector with the Sentinel Connector Builder Agent With the Microsoft Sentinel extension installed and GitHub Copilot running in agent mode, open a Copilot chat and enter a single prompt pointing at the API documentation file: That is the entire invocation. The agent takes it from there. It works through a structured seven-step sequence: preparation, polling config, table schema, DCR, connector definition, package validation, and summary. The agent produces four files in a sentinel-connectors/NetworkLogAPI_CCF/ output folder: NetworkLogAPI_PollingConfig.json – This is the API poller configuration. The agent reads the documentation and correctly identifies the GET /api/GetNetworkLogs endpoint, configures API Key authentication via the X-API-Key header, sets up NextPageUrl pagination using $.metadata.nextLink with a $.metadata.hasNextPage stop condition, and wires up the since query parameter for incremental delta pulls using the timestamp field. The RefreshData endpoint is correctly excluded, which the agent recognizes as a maintenance operation, not a security data stream. NetworkLogAPI_Table.json – This is the custom Log Analytics table schema for NetworkLogAPIGetNetworkLogs_CL . All 20 fields from the API response are mapped to the correct column types, with timestamp promoted to TimeGenerated as the standard Sentinel time column. NetworkLogAPI_DCR.json – This is the Data Collection Rule. This defines the stream declaration, the workspace destination, and the KQL transform that maps the raw snake_case API fields ( sourceIp , destinationIp , threatIndicator , etc.) to their PascalCase table columns. NetworkLogAPI_ConnectorDefinition.json – This is the connector UI configuration. This drives what the connector page looks like in Microsoft Sentinel: the title, description, prerequisite instructions, the BaseUrl and ApiKey input fields, sample KQL queries, and the connectivity status logic. The only point where the agent paused for input was to propose a connector description and ask for confirmation before writing it to the file. Everything else such as endpoint selection, auth type, pagination pattern, schema mapping, KQL transform, cross-file consistency was selected autonomously. To put that in perspective: without the agent, a developer building this connector from scratch would need to manually author four JSON files, understand the CCF schema for polling configs, DCRs, and connector definitions, write the KQL transform by hand, and validate that every cross-file reference lines up correctly. The agent compresses that work, typically hours of reading documentation, trial-and-error, and portal debugging, into a single prompt. Testing the Connector Before deploying anything to a Sentinel workspace, the Microsoft Sentinel connector builder agent lets you validate the generated polling config against the live API directly from your editor. Right-click the sentinel-connectors/NetworkLogAPI_CCF folder, select Microsoft Sentinel → Test Connector (Preview), and a Configuration Variables panel opens asking for the two template variables from the polling config: BaseUrl and apiKey . For other API patterns, there may be additional and different inputs. For example, apiKey input could be swapped with clientID and secret if the API supports OAUTH. Enter the Function App base URL and your API key, and the test runner connects immediately. The panel shows a live polling session. Poll #1 returns HTTP 200 with 50 events, and a countdown timer shows when the next poll will fire. Switching to the Events tab displays the ingested records in a tabular view with columns for timestamp , severity , action , bytesIn , bytesOut , category , and the rest of the mapped fields fresh from the API. Additionally, there are tabs for Headers, Payload, and Response, which can be useful for verifying that your pollerconfig.json configuration provides the expected request to your api with a working response. Data Extracted: The Test Connector feature can be used to visualize the response data in a table format to verify that data will land in a Sentinel table based on your configuration. Request from Poller: The Test Connector feature can be used to validate the request and response headers that will go out to the API based on the generated poller configuration. Request Response: The Test Connector feature shows you the live response from the API with respect to the request going to the API based on the poller configuration. This is a meaningful pre-flight check. It confirms that auth is working, the $.data events path resolves correctly, pagination is functional, and the polling interval fires as configured all before a single file is deployed to Azure. The most common connector configuration issues (wrong base URL, incorrect header name, mismatched JSON path) surface here in seconds rather than after a failed deployment and a 20-minute wait for Sentinel to attempt its first ingestion cycle. It is also the fastest way to troubleshoot if something goes wrong after deployment, far quicker than pushing changes to Azure and waiting for the connector to poll again. Deploying and Enabling the Connector With the connector tested and passing, deployment is the same right-click menu: right-click the sentinel-connectors/NetworkLogAPI_CCF folder, select Microsoft Sentinel → Deploy Connector (Preview). If you are not already signed in to Azure, the extension will prompt you to authenticate. The agent will also provide a clickbox in the chat window to invoke a connector deployment. Right Click Deploy Connector: UI Prompt Based Deploy Method: Once signed in, a workspace picker lists all available Log Analytics workspaces across your subscriptions. Select the one with Sentinel enabled and click Deploy. The extension deploys all four files to the workspace in the correct order: table schema first, then DCR, polling config, and connector definition. Once deployed, navigate to your Sentinel workspace via https://security.microsoft.com, go to Data Connectors, and find the Network Log API connector. The connector page shows the description, prerequisite notes, and the two credential fields generated by the agent: API Base URL and API Key. Enter your Function App base URL and API key and click Connect. The status updates to show the connector is connected and the deployment succeeded. Note: Data will appear in the workspace within 5 to 30 minutes depending on the polling interval. Run this query in Log Analytics to confirm ingestion. Note that the agent derives the table name from the vendor name and endpoint, so yours may differ slightly from the example below. Check the agent's summary output or the NetworkLogAPI_Table.json file for the exact name: NetworkLogAPIGetNetworkLogs_CL | sort by TimeGenerated desc | take 10 If you want to generate a fresh batch of events immediately rather than waiting for the next polling cycle, use the RefreshData endpoint to reset the sample records with new timestamps: curl -s -X POST -H "X-API-Key: " \ "https://.azurewebsites.net/api/RefreshData" Next Steps If you want to go further: Try it with your own API. The lab repo includes documentation on adapting the polling config, schema, and KQL transform to a real data source. Review the CCF connector schema documentation to understand the full range of supported configurations: pagination patterns, auth types, incremental pull strategies, and delta filter expressions. Explore the Microsoft Sentinel content hub to see how published connectors are structured and what the certification requirements look like for production submissions. Conclusion Following these steps, you saw how a working Sentinel connector can be generated, tested, and deployed in minutes rather than requiring days of manual configuration and infrastructure setup. If you are an ISV building a Sentinel integration and want hands-on support, Microsoft’s App Assure program is available to help. We partner with ISVs on connector development, validation, and deployment and provide guidance through implementation, testing, and readiness for production. You can get started by reaching out through our intake form. See our other Sentinel connector feature’s hands-on labs Building a CCF Nested API Pull Connector: A Technical Lab Walkthrough913Views0likes0CommentsMonthly News-August 2026
Microsoft Defender Monthly news - August 2026 Edition This is our monthly "What's new" blog post, summarizing product updates and various new assets we released over the past month across our Defender products. In this edition, we are looking at all the goodness from July 2026. We are now including news related to Defender for Cloud in the Defender portal. For all other Defender for Cloud news, have a look at the dedicated Defender for Cloud Monthly News here. 🚀 New Virtual Ninja Show episode: Redefining identity security for the modern enterprise One policy engine to govern them all: Securing agentic AI with Microsoft Purview Building a modern detection pipeline with ContentOps Securing local AI agents with Microsoft Defender Microsoft Defender: Extending critical protection for emerging threats in Team Actionable threat insights (find all of them here) Email threat landscape: Q2 2026 trends and insights Enhancing AI security through global AI red teaming Least privilege for AI agents: Identity, access, and tool binding Microsoft Defender (Public Preview) Microsoft Defender now assesses posture risk for AI agents, including enterprise agents and local agents discovered on endpoint devices. Risk levels are based on active risk indicators, such as configuration, access, runtime activity, endpoint and user context, and active alerts. Security teams can use posture risk and recommendations to prioritize risky agents and improve agent security posture. For more information, see AI agent posture risk in Microsoft Defender. (Generally available) The Domain investigation page allows you to investigate an Active Directory domain. It shows Active Directory domain security, including domain properties, deployment health, identity summary, service account breakdown, sensitive entities, active recommendations, group policies, and trust relationships. For more information, see Investigate a domain . (Generally available) With a Microsoft Agent 365 license, Microsoft Defender provides discovery, security posture, threat detection and investigation, and real-time protection for the AI agents in your tenant. Onboarding includes enabling data collection, connecting the Microsoft 365 app connector, and connecting Copilot Studio for real-time protection of Copilot Studio agents. For more information, see Protect AI agents using Microsoft Defender. (Generally available) Improved access to Playbook Generator: Following the GA release of Playbook Generator May 31st, the team focused on streamlining the onboarding experience and reducing friction related to Security Copilot wallet provisioning. Playbook Generator remains included with Microsoft Sentinel and does not consume SCUs for generating, testing, or running playbooks, yet customer feedback highlighted friction around Security Copilot wallet provisioning and initial setup requirements. The team worked on simplifying access and reducing onboarding barriers so organizations can more quickly take advantage of AI-assisted playbook creation, testing, and automation capabilities. For all other Sentinel News, have a look at the "What's new in Microsoft Sentinel blog post - July edition" Identity Security (Generally available) Migration of Defender for Identity sensors from v2.x to v3.x is now generally available. For more information, see Migrate to Defender for Identity sensor v3.x. Migration readiness reasons on the Sensors page: When a server is marked Not ready for migration on the Sensors page, you can now hover over the status to see a tooltip that lists the specific reasons the server doesn't meet the migration prerequisites. For more information, see Troubleshoot "Not ready for migration" status. (Public Preview) Expanded SaaS app support in Password protection. The Password protection page now includes password risks from SaaS apps connected through Defender for Cloud Apps, in addition to Active Directory, Microsoft Entra ID, and Okta. SaaS apps that support SaaS Security Posture Management (SSPM), such as Salesforce and ServiceNow, appear on the Password Hygiene and Password Policies tabs. Each SaaS app requires a Defender for Cloud Apps app connector. For more information, see Investigate identity password protection. Automatic RPC auditing on domain controllers: Defender for Identity now automatically enables RPC auditing on domain controllers when you upgrade to sensor version 3.0.8 or later. You no longer need to apply a tag manually to enable RPC auditing. For more information, see Configure RPC auditing. Microsoft Defender Experts MDR General Availability of Microsoft Defender Experts MDR P2: Microsoft Defender Experts MDR (formerly Microsoft Defender Experts for XDR) is expanding with new third-party and multi-cloud coverage powered by Microsoft Sentinel, with the launch of Defender Experts MDR P2 service. Defender Experts MDR provides a 24/7 managed detection and response service that reduces noise, adds expert context, and drives action. In addition to the Microsoft Defender products, this new service supports key non-Microsoft sources across cloud (AWS), identity (Okta), email (Proofpoint), network (Palo Alto Networks, Cisco, Fortinet, ZScaler), and endpoint (CrowdStrike) that are ingested in Microsoft Sentinel, providing E2E visibility and protection for customers operating heterogenous environments. Defender Experts will continue expanding our scope to other non-Microsoft products to deliver on this promise. For more information, see the Microsoft Defender Experts MDR documentation. Microsoft Security Exposure Management / Defender Vulnerability Management (Private Preview) Codename MDASH - Agentic code scanner is now available in private preview in Microsoft Security Exposure Management. Codename MDASH uses a multi-model agentic AI system to detect code vulnerabilities with greater depth and accuracy than traditional static analysis. Security teams can run scans from Defender CLI or through a GitHub connector, review findings in the Defender portal, and use results to help prioritize code security risks. For more information, see Agentic code security overview. (Private Preview) Codename MDASH - MAI-Augmented scan profile private preview. The MAI-Augmented scan profile is now available in preview as part of Codename MDASH. The MAI-Augmented profile can be used when triggering a scan through the Defender CLI. It includes MAI-Cyber-1-Flash, a new cyber-specialized model that extends the current agentic scanner in addition to the existing required models. Security teams can choose this profile when triggering a scan from Defender CLI or continue using a scan profile based on the existing models. For more information, see Scan with a scan profile. OT data connectors in Microsoft Security Exposure Management: Microsoft Security Exposure Management now supports operational technology (OT) data connectors for Armis, Dragos, and Forescout. OT data connectors bring OT asset and vulnerability data from supported third-party OT platforms into the Defender portal. This helps security teams view OT devices alongside other assets, enrich device inventory with OT context, and investigate vulnerabilities across IT and OT environments. For more information, see OT data connectors. Microsoft Defender for Endpoint (Public Preview) AI agent runtime protection includes these enhancements: - Vendor-supported agent event interfaces now work with standard platform and engine update channels, so no Beta channel configuration is required. Agent-native event inspection now supports Codex CLI and the GitHub Copilot app. - Network inspection is now supported for agents that don't expose vendor-supported event interfaces, including OpenClaw and similar Node.js-based Claw agents. For more information, see AI agent runtime protection with Defender for Endpoint. (Generally available) Available from Defender for Endpoint on Linux version 101.26042.0011 and later. The Defender Deployment Tool for Linux simplifies deployment by combining installation, onboarding, upgrades, and uninstallation into a single workflow. The tool automates prerequisite validation, supports custom installation paths, enables deployment of specific Defender versions from preferred update channels, and works seamlessly in environments that use local repositories. In addition to a simplified deployment experience, customers can now gain complete visibility into deployment progress through Device Timeline integration, providing step-by-step installation, upgrade, and onboarding status, Advanced Hunting queries for fleet-wide deployment monitoring, and detailed error reporting, including deployment stage, status, exit code, and failure reason to simplify troubleshooting. These capabilities help administrators quickly identify deployment issues, track onboarding progress, and understand deployment outcomes across their Linux estate. Microsoft Defender for Office 365 Unified RBAC is the default permission model for new Defender for Office 365 Plan 2 organizations. Starting July 2026, new Defender for Office 365 Plan 2 organizations use the Microsoft Defender unified role-based access control (Unified RBAC) model by default. For more information, see Configure Unified RBAC for Defender for Office 365 and MC1246006. Microsoft 365 E3 now includes Microsoft Defender for Office 365 Plan 1. For more information about what's included in each plan, see Microsoft Defender for Office 365 Plan 1 vs. Plan 2 cheat sheet. Prompt injection protection: Defender for Office 365 now detects prompt injection attacks hidden in inbound email. For more information, see Prompt injection protection in Defender for Office 365.2.7KViews1like0Comments
Securing Enterprise AI Agents with Microsoft Sentinel
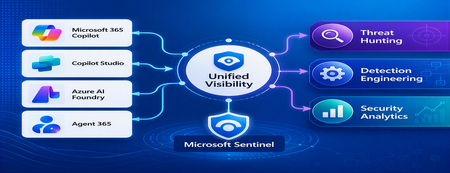
1. Introduction Enterprise adoption of Generative AI is accelerating rapidly through Microsoft 365 Copilot, Copilot Studio, Azure AI Foundry Agents, Security Copilot, and custom AI agents integrated with business applications. Unlike traditional SaaS applications, AI agents can: Access enterprise data Query internal knowledge repositories Invoke APIs and MCP tools Execute workflows Interact with business applications Make decisions on behalf of users While these capabilities improve productivity, they introduce a new attack surface that security teams must monitor and secure. Common AI threats include: Prompt Injection Cross Prompt Injection Attacks (XPIA) Jailbreak Attempts Unauthorized Tool Invocation Data Exfiltration through AI Agents Agent Identity Abuse Excessive Data Access Malicious MCP Tool Execution Traditional SOC monitoring platforms were designed for users, devices, applications and infrastructure—not autonomous AI systems. To address this challenge, Microsoft provides a comprehensive AI security monitoring framework built around: Agent 365 Observability Microsoft Agent Identities Microsoft Copilot Logs Defender XDR Defender for AI Microsoft Sentinel Together these components provide end-to-end observability of: User prompts Agent execution paths Tool invocations Safety signal detections Agent identities Security alerts 2. Reference Architecture AI Security Monitoring Architecture 3. Integration Architecture Microsoft provides multiple telemetry sources that complement one another. 3.1 Agent Runtime Telemetry Sentinel Data Connector Agent 365 Data Connector Table UnifiedAgentObservability Captures runtime behavior of AI agents including: User prompts Session IDs Conversation IDs Agent identities MCP tool invocations Connector invocations Tool arguments Tool responses Request payloads Response payloads Execution errors This dataset provides the forensic trail of everything an AI agent performed. 3.2 Agent Governance and Asset Inventory Sentinel Data Connector Microsoft Agent Identities Provides visibility into: Agent inventory Agent blueprint inventory Ownership Relationships Governance metadata Risk context This allows SOC teams to answer: Who owns this agent? What permissions does it have? Which business unit deployed it? Which related agents exist? 3.3 Copilot Audit and Usage Monitoring Sentinel Data Connector Microsoft Copilot Logs Connector Table CopilotActivity Provides: Copilot usage auditing Operational visibility User interaction tracking Useful for governance, compliance and adoption reporting. 3.4 AI Safety Telemetry Sentinel Data Connector Microsoft Defender XDR Connector Table CloudAppEvents CloudAppEvents provides AI safety signals such as: Prompt Shield detections Prompt Injection attempts Cross Prompt Injection Attacks (XPIA) Jailbreak-related verdicts Unsafe prompt classifications Think of CloudAppEvents as answering: "Was the prompt malicious?" 3.5 AI Security Alerts Sentinel Data Connectors Microsoft Defender XDR Microsoft Defender for Cloud Tables SecurityAlert SecurityIncident Used for: AI attack detections Security incidents Correlated investigation workflows 4. Understanding the Two Most Important AI Tables CloudAppEvents Focuses on AI Safety Questions answered: Was Prompt Shield triggered? Was this a jailbreak attempt? Was XPIA detected? Was the prompt suspicious? UnifiedAgentObservability Focuses on Agent Runtime Behavior Questions answered: What tool was invoked? Which connector executed? What arguments were passed? What data was returned? What actions did the agent perform? 5. Advanced Threat Hunting Scenarios The Agent365 Observability hunting guide contains several investigation scenarios that can be used directly in Microsoft Sentinel. Reference: Agent 365 Observability — AI Agent Telemetry Hunting https://github.com/SCStelz/security-investigator/blob/main/queries/cloud/agent365_observability.md 5.1 Prompt Injection Detection Detect prompts containing indicators such as: Ignore previous instructions Reveal system prompt Developer mode Disregard safety controls Investigation workflow: Review Tool Activity This allows analysts to determine whether a suspicious prompt resulted in downstream actions. 5.2 Session Reconstruction One of the most powerful capabilities of UnifiedAgentObservability is session reconstruction. Analysts can correlate: This creates complete forensic timelines. 5.3 MCP Tool Auditing Monitor all MCP activity including: query_lake Graph API tools ServiceNow connectors SharePoint connectors Custom enterprise tools Questions answered: Which tool was used? Who triggered it? What parameters were supplied? What data was returned? 5.4 Sensitive Data Access Monitoring Monitor AI agent interaction with: Employee records Customer data Financial information SharePoint repositories HR databases Useful for identifying: Data exfiltration attempts Excessive access patterns Sensitive data exposure 5.5 Query Lake Monitoring The GitHub hunting guide introduces monitoring of: query_lake RunAdvancedHuntingQuery Analysts can inspect: Actual KQL submitted Target workspaces Data sources queried Scope of access This provides visibility into AI-driven security investigations. 5.6 New Tool Detection Identify newly observed tool usage. Examples: Unauthorized MCP servers Newly registered connectors Unapproved tools Unexpected integrations This use case is particularly useful for governance programs. 5.7 Tool Failure Monitoring Monitor: Permission failures Connector failures Application errors Access-denied responses A sudden increase in failures may indicate: Reconnaissance activity Misconfiguration Privilege abuse attempts 6. Detection Engineering Opportunities Organizations can create Sentinel Analytics Rules for: 6.1 Prompt Injection Detection Developer Mode prompts Prompt Override attempts System Prompt disclosure requests 6.2 Jailbreak Attempt Detection Safety bypass attempts Role manipulation prompts Instruction override patterns 6.3 Unauthorized Tool Usage New MCP tools High-risk connectors Rare tool executions 6.4 Sensitive Data Access HR data queries Identity information retrieval Large-volume exports 6.5 Agent Identity Abuse Ownership changes Unexpected agent activity Agent-to-agent anomalies 7. Data Lake Exploration and Long-Term Analytics Because agent telemetry resides within Sentinel Data Lake, organizations can perform: Long-term AI investigations Historical AI attack analysis Agent baselining Governance reporting Trend analysis Tool inventory reporting Example dashboards include: Top Prompt Injection Attempts Most Active Agents High-Risk MCP Tools Agent Ownership Analysis AI Security Incidents Sensitive Data Access Trends 8. Summary AI agents represent the next major computing platform, but they also introduce a completely new attack surface. To effectively secure enterprise AI solutions, organizations require visibility across: User interactions Agent execution paths MCP tool usage Prompt safety signals Agent identities Security detections Microsoft Sentinel provides this unified view by integrating: Agent 365 Observability UnifiedAgentObservability Microsoft Agent Identities Microsoft Copilot Logs CloudAppEvents Defender XDR Defender for AI By combining AI runtime telemetry with AI safety signals and Defender detections, security teams can move beyond traditional monitoring and build a modern SOC capability for threat hunting, incident response, governance and forensic investigations across Microsoft 365 Copilot, Copilot Studio, Azure AI Foundry and future AI agent ecosystems. Reference: https://github.com/SCStelz/security-investigator/blob/main/queries/cloud/agent365_observability.mdCustom Detection Rules as Code in Sentinel Repositories: What Your Pipeline Owns Now
While going through the June Sentinel updates I almost scrolled past this one, and I think that would have been a mistake: custom detection rules can now be managed as code in Sentinel Repositories, the same way analytics rules, playbooks, parsers and workbooks already are. You connect a GitHub or Azure DevOps repo, enable the Custom Detection Rules content type, and rules are synced on every commit. There is also a standalone path via the Bicep CLI for teams running their own pipelines. The feature is in preview per the Learn documentation, and in my view it matters more than the low-key rollout suggests. Microsoft has been positioning custom detections as the unified experience for building rules over both Defender XDR and Sentinel data since late 2025. If custom detections are becoming the primary detection type, then this preview is the moment your primary detection type becomes pipeline-managed. I spent some time in the documentation to understand what that actually means, and there is one implication I have not seen anyone talk about yet. How it works Custom detection rules use a different mechanism than every other content type in Repositories. Analytics rules deploy as Microsoft.OperationalInsights/workspaces/providers/alertRules resources, with the Microsoft.SecurityInsights provider sitting in the resource name. Custom detection rules instead use a dedicated Bicep extension. You declare it in a `bicepconfig.json` at the repo root: { "extensions": { "MicrosoftSecurity": "br:mcr.microsoft.com/bicep/extensions/microsoftsecurity:v1.0.1" } } The rule itself is a `Microsoft.Security/detectionRules` resource. This is the structure from the Microsoft documentation: extension MicrosoftSecurity resource detectionRule 'Microsoft.Security/detectionRules@2026-06-01-preview' = { id: 'custom-rule-id' displayName: 'Custom Rule Display Name' status: 'enabled' queryCondition: { queryText: 'DeviceProcessEvents | take 10 | project DeviceId, Timestamp, FileName' } schedule: { frequency: 'PT1H' } detectionAction: { alertTemplate: { title: '<ruleTitle>' description: 'Custom detection rule' severity: 'medium' tactics: [ { tactic: 'Execution' techniques: [ { technique: 'T1059' } ] } ] entityMappings: { hosts: [ { id: 'h' deviceIdColumn: 'DeviceId' } ] } } } } Rules are uniquely identified by the `id` property, which you provide in the template. Deployment is either the automatic Repositories sync or a plain `az deployment group create` against a resource group. That last part is what I like most about the design: any CI/CD system that can run Azure CLI can ship these rules. Prerequisites beyond the standard Repositories setup: a Microsoft 365 E5 license or equivalent that includes Defender XDR, and a Sentinel workspace onboarded to the Defender portal. Two preview limitations are documented: custom frequency for Sentinel-only data is not supported yet, and neither are custom details. The part that made me stop reading and think Repositories are designed as the single source of truth. The documentation is explicit that content in your repo overwrites changes made through the portal. That is the whole point of the feature, and for analytics rules it has been mostly harmless. For custom detections I see a wrinkle. When Microsoft renames tables or columns in the advanced hunting schema, those naming changes are applied automatically to queries saved in Microsoft Defender, including the queries inside custom detection rules. The docs are equally explicit that this automatic migration does not cover queries run via API or saved anywhere outside Defender. A Git repo is outside Defender. Play that forward with a current example. The `AIAgentsInfo` table stopped being accessible on July 1, 2026, replaced by the unified `AgentsInfo` table with a changed column set. A portal-managed custom detection referencing the old table got migrated automatically. The same rule managed as code did not, because the authoritative copy of the query now lives in your repo, and nothing in the sync path rewrites your Bicep files. Your repo is now the thing standing between Microsoft's server-side fix and your production detection. Either the sync starts failing, or the stale query gets reasserted over the migrated rule. The documentation does not say which of the two happens, and honestly, neither is good. No alert fires for either. And if smart deployments, which skip files that have not changed since the last deployment, apply to this content type the same way they do to the rest of Repositories, it gets slightly worse in a way I find almost funny: a stale rule would sit untouched until someone happens to edit it. What I would put in front of the merge To be clear, none of this is an argument against the feature. I want detections in Git, and I suspect most people reading this do too. It is an argument that moving custom detections into a repo moves the schema lifecycle responsibility into your review process, because the portal safety net explicitly does not reach into source control. Concretely, a PR touching detection content should be checked for references to deprecated or transitioning advanced hunting tables, for the result columns the custom detection docs recommend (`Timestamp` or `TimeGenerated`, plus `DeviceId` or `DeviceName` for Defender for Endpoint tables, plus `Timestamp` and `ReportId` from the same event for the other Defender tables), and for complete entity mappings, since entities drive how alerts group into incidents. One more detail from the custom detection docs that I suspect will trip up people coming from analytics rules, because it goes against years of muscle memory: avoid filtering on `Timestamp` or `TimeGenerated` in the query itself. The service prefilters data based on the detection lookback using ingestion time. The scheduled-analytics-rule reflex of always pinning a time window works against you here. Whether you enforce these checks with a homegrown script or a linting step in the pipeline matters less than doing it before merge rather than discovering it in the alert queue. The deployment mechanics are now solved. The content governance is yours. Full transparency: I have worked through the documentation and the sample content, but I have not yet run a retired-table scenario through the sync myself. So if you are testing the preview, I would genuinely like to hear how it behaves in your environment when a repo-managed rule references a table like `AIAgentsInfo`. That failure mode is the one I want to understand before this reaches GA. Beyond that specific case, I am curious where you all stand: are you moving custom detections into Git now, or waiting for GA? And if you already run detections as code for analytics rules, what checks have earned a permanent place in your PR pipeline? My used references: Manage content as code with Microsoft Sentinel repositories: https://learn.microsoft.com/en-us/azure/sentinel/ci-cd-custom-content Advanced hunting schema naming changes: https://learn.microsoft.com/en-us/defender-xdr/advanced-hunting-schema-changes Create custom detection rules in Microsoft Defender XDR: https://learn.microsoft.com/en-us/defender-xdr/custom-detection-rules Custom detections as the unified detection experience: https://techcommunity.microsoft.com/t5/microsoft-defender-threat-protection/custom-detections-are-now-the-unified-experience-for-creating/ba-p/4463875Solved