microsoft playwright testing
21 Topics
Bring managed browser automation to your agent applications
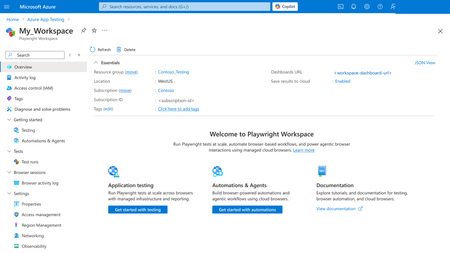
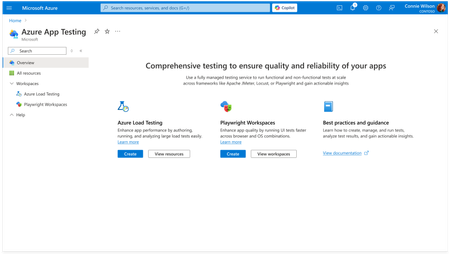
AI agents become more useful when they can move beyond conversation and complete real workflows. Playwright Cloud Browsers provides managed, on-demand browser capacity that agent applications can access through Model Context Protocol (MCP). You can connect Playwright Cloud Browsers to agent applications, including coding agents such as the GitHub Copilot app and Visual Studio Code: when they support custom remote MCP servers. Once connected, an agent can navigate an approved application, complete forms, verify results, capture evidence, and close the managed browser session. Your team gets browser automation without maintaining browsers in every user or agent environment. In this example, we use the GitHub Copilot app to show the connection and workflow. You can extend the same approach to other compatible applications by adding the Playwright workspace endpoint through their custom remote MCP configuration. Example: Follow one registration request from start to finish If your team processes employee registrations for approved training programs, each request can involve several repetitive steps: open the portal, enter employee and course information, check required fields, review the details, submit the form, and retain confirmation evidence. After you connect the workspace MCP endpoint, you can ask your agent application to handle the browser steps. In the GitHub Copilot app, for example, you could use this prompt: "Use Playwright Cloud Browsers to open <approved-registration-portal-url> and process case <number>. Enter the employee and course information I provide, validate all required fields, and show me a structured summary. Do not submit until I approve it. After approval, submit once, verify the confirmation number and success message, capture a screenshot, and close the browser session. If submission times out, inspect the page before deciding whether a retry is safe." The prompt defines the outcome, approved destination, human decision point, evidence, and cleanup expectation. The agent handles repetitive browser interaction while you remain in control of the consequential submission. Connect managed browser capacity in minutes Every Playwright workspace provides a workspace-scoped MCP endpoint: https://<region>.mcp.playwright.microsoft.com/playwrightworkspaces/<workspace-id>/mcp Provision a Playwright workspace in the Azure portal. Open the workspace and copy its MCP endpoint. In the GitHub Copilot app, open Customize, select Add, and then select MCP. Choose HTTP, enter a server name, paste the endpoint, and select Save. For this illustrated setup, only the server name and workspace endpoint are entered. Follow your organization's authentication and access policies for the workspace. Figure 1. Open the Playwright workspace Overview page in the Azure portal Figure 2. Copy the workspace-scoped MCP endpoint Figure 3. Open Customize in the GitHub Copilot app Figure 4. Select 'MCP' Tab, and add the workspace endpoint as a custom HTTP MCP server This article demonstrates Add > MCP in the GitHub Copilot app. Other compatible applications use their own custom remote MCP configuration. Using another compatible application? In Visual Studio Code or another client that supports custom remote MCP servers, add the same workspace endpoint through that application’s MCP configuration. The interface can differ, but the endpoint and connection model remain the same. Features of Playwright Cloud Browsers 1. Watch the agent complete the form When the task begins, the agent creates a managed browser session and uses its browserSessionId throughout the registration flow. Session creation might also return a liveViewUrl; Live View availability depends on the session. When available, Live View lets you watch while the agent opens the portal, finds the registration fields, and enters the supplied information. The agent follows an observe-act-verify loop: inspect the page, enter the required values, wait for validation or dependent fields, and observe the page again. If you need to intervene rather than observe, Playwright Cloud Browsers provides Take Control for supported active sessions. An authorized operator can interact directly with the running browser to address an unexpected page state, complete an action that requires human judgment, or help troubleshoot the flow. Control can then return to automation. 2. Review before the consequential action Before submission, the agent presents a structured summary with the case ID, employee name, selected course, date, contact information, required acknowledgements, and any validation warning. It waits for explicit approval. Automation removes repetitive entry and navigation, while you retain authority over the action that creates the registration. After approval, the agent submits once. It verifies the success message and confirmation identifier, captures a screenshot when evidence is required, and reports the outcome. 3. Investigate errors before retrying A timeout or disconnected caller does not prove that submission failed. Repeating a non-idempotent action can create a duplicate registration. If the result is unclear, the agent first checks the page for a confirmation number, success message, changed status, or validation error. It retries only when the page state shows that repeating the action is safe. Console messages and network activity can explain client-side errors, failed requests, authentication problems, or validation behavior. Playwright Cloud Browsers also provides built-in observability and browser session data, including logs, traces, screenshots, recordings, and execution artifacts. Availability depends on the workflow, session, and configuration. 4. Close the session and monitor the result The agent closes the browser session whether the registration succeeds, fails, or is cancelled. Closed or expired sessions cannot be reopened. Explicit cleanup releases browser capacity promptly and reduces unexpected activity. Figure 5. Review MCP created sessions in the Azure portal Browser activity log Use Browser sessions > Browser activity log to review MCP-created sessions, source, start time, and duration. The result is one connected workflow: your agent application provides the conversational or coding experience, MCP provides the connection, and Playwright Cloud Browsers provides managed execution, visibility, human intervention, evidence, diagnostics, and auditability. Responsible use: Use browser automation only with approved websites, accounts, and data. Retain human review before consequential submissions, and never place workspace credentials, access tokens, or sensitive form data in prompts, source control, screenshots, or logs. Learn more Azure portal: https://portal.azure.com/ What is Playwright Workspaces?: https://learn.microsoft.com/azure/app-testing/playwright-workspaces/overview-what-is-microsoft-playwright-workspaces Create and manage a workspace: https://learn.microsoft.com/azure/app-testing/playwright-workspaces/how-to-manage-playwright-workspace Playwright Workspaces remote MCP server: https://learn.microsoft.com/en-us/azure/app-testing/playwright-cloud-browsers/quickstart-automate-browser-tasks-remote-mcp Manage workspace access tokens: https://learn.microsoft.com/azure/app-testing/playwright-workspaces/how-to-manage-access-tokens Customize the GitHub Copilot app: https://docs.github.com/copilot/how-tos/github-copilot-app/customize-github-copilot-app Add and manage MCP servers in Visual Studio Code: https://code.visualstudio.com/docs/agent-customization/mcp-servers378Views0likes0CommentsIntroducing Reporting in Playwright Workspaces
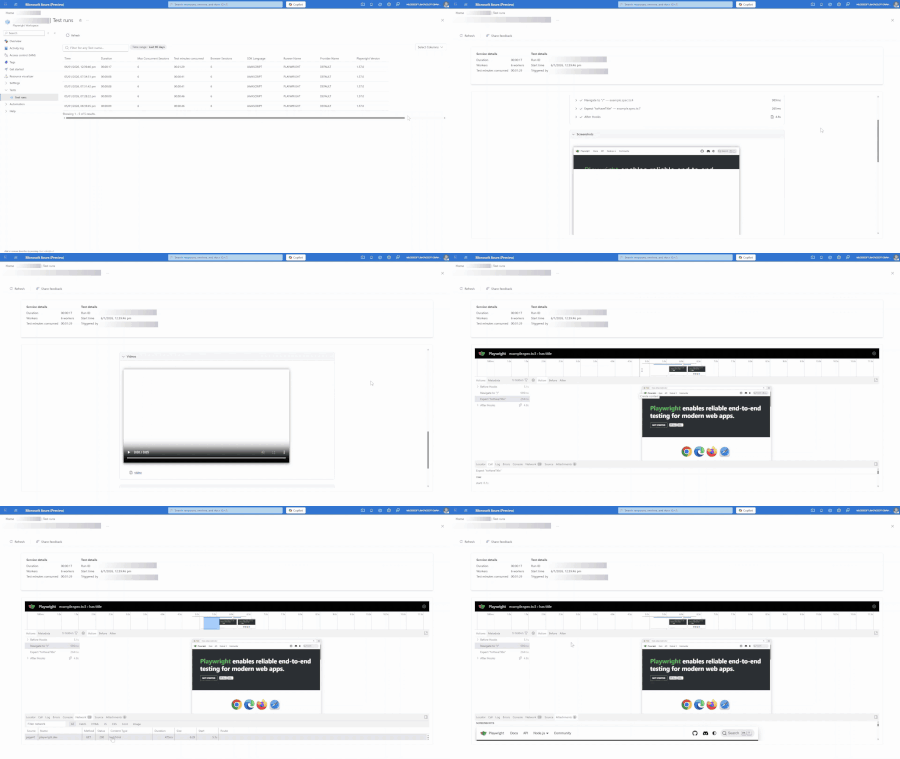
Today, we’re thrilled to announce a powerful new reporting feature in Playwright Workspaces – designed to make debugging Playwright end-to-end tests faster, easier, and more insightful. If you’re using Playwright Workspaces (part of Azure App Testing) to run Playwright tests at scale, this update brings you – Streamlined access to all your test reports through the Azure portal. Greater control over your test artifacts with the bring-your-own-storage capability. Customizable data governance including retention, security, and compliance settings. Easy collaboration with team members using shareable test report URLs. What’s new in Playwright Workspaces Reporting: Integrated Reporting Experience in the Azure Portal All your test reports are accessible in one place, right within the Azure portal. As soon as your Playwright tests finish running, the results and test artifacts are available in the Test Runs page in your Playwright Workspace – no need to pull files from CI or scour different logs. Debugging test failures is now more visual and intuitive. Playwright’s Trace Viewer is integrated directly into the test report, so you can time-travel through a failing test, step by step. Open any failed or flaky test and you’ll see a rich timeline of actions: hover over each step to reveal the page state before and after each action. Detailed logs, DOM snapshots, network activity, errors, and console output are available at each test step for better troubleshooting. Flexible Data Governance with Bring Your Own Storage In this release, you have full control over where your test reports and artifacts live. Playwright Workspaces now lets you link your own Azure Storage account to store test results, traces, videos, and screenshots. With this update, you get to define your data retention, security, and compliance settings. For example, you might plug in an Azure Blob Storage container under your company’s account – all test artifacts will be saved there, under your organization’s preset governance. The bring-your-own-storage approach gives teams flexibility to meet enterprise policies or cost management goals. Once connected, the dashboard will seamlessly pull reports from your storage, so the experience remains smooth. Collaborate Seamlessly with Team Members Using the centralised test report experience enables you to easily manage and share access to your test reports. You can also see the URL to the test report as a part of your CI logs. Share this test report URL with your team members to debug failed or flaky tests faster. Having a single source of truth for test results not only saves time but also reduces miscommunication during crunch times. We’re excited about how the new reporting capability in Playwright Workspaces will empower teams to ship with greater confidence. By combining scalable test execution with a centralised, fully controllable and collaborative test results experience, Playwright Workspaces takes debugging and test results reporting to the next level. Happy Testing and Debugging with Playwright Workspaces Reporting! Get Started with Reporting in Playwright Workspaces Ready to take the new reporting feature for a spin? Playwright Workspaces Reporting is now available for all Playwright Workspace users. Use the following links to get started – Quickstart Guide Troubleshooting FAQs Share your feedback As always, we welcome feedback: let us know what works great for you and what you’d love to see next.1.5KViews1like4CommentsWhy Cloud Browsers Are Becoming Enterprise Infrastructure for AI Agents and Automation
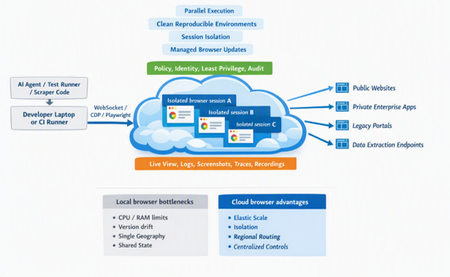
The browser is becoming a new execution environment Over the last decade, enterprises moved compute from desktops to the cloud. Applications that once depended on individual machines now run on scalable, managed infrastructure. A similar shift is beginning to happen with browser automation. Browsers were originally designed for humans. A person opened a browser, navigated through websites, completed transactions, submitted forms, and consumed information. Today, a growing number of those same activities are being performed by automated systems. Test suites validate critical business applications before every release. Business workflows interact with legacy web portals that lack APIs. Most recently, AI agents have begun using browsers to access information and complete tasks on behalf of users. This creates a new question for enterprises: "Where should those browser interactions run?" Running a browser on a developer's laptop may be sufficient for experimentation and small-scale automation. However, it becomes increasingly difficult when hundreds of automated workflows, thousands of test executions, or fleets of AI agents require secure, isolated, observable, and governed browser environments. As organizations operationalize browser automation, the browser itself is evolving from a desktop application into enterprise infrastructure. Enterprise cloud browsers solve a different problem than local browsers Initially browser automation focused primarily on helping developers automate repetitive tasks and run tests. Today's enterprise requirements are significantly broader. Organizations need environments that can safely support autonomous execution while maintaining visibility, compliance, and operational control. Cloud-hosted browsers are changing the landscape for browser automation. Instead of treating the browser as something attached to one machine, they are turning it into an elastic, isolated, observable runtime. Modern automation is no longer about running one script. It is many agents, scrapers, workflows, and tests operating in parallel across websites, regions, identities, and environments. Some real-world problems that enterprises want to solve with the help of browser automation: "We have 300 employees doing thousands of data transcription operations each day, need an alternate for RPA on legacy websites" "I want to get pricing of my SKUs across hundreds of websites, across devices, across geographies, daily & almost real time" "We want to run E2E tests on our app across varied scenarios, geographies so that the quality is always very high for our customers" Security and governance by design Security is often the first concern enterprises raise when evaluating browser-based automation and AI agents. Browsers routinely execute untrusted code, render external content, download files, interact with third-party services, and handle sensitive information. When autonomous agents begin operating those browsers, the risk profile becomes even more significant. Cloud-hosted browsers provide a controlled environment where organizations can apply governance consistently across browser sessions. This includes: Isolated browser sessions Role-based access controls Data residency and compliance controls Network controls Audit logging and activity tracking A governed cloud environment provides a more practical foundation for these controls than unmanaged browser instances running on individual devices. Secure automation on enterprise portals: Finance, procurement, and operations teams can execute transactions on legacy ERP, supplier, and line-of-business applications using managed browser sessions, centralized credentials, and policy controls rather than maintaining dedicated desktops for each workflow. Customer support operations: Service teams can update accounts, process requests, and interact with multiple internal and external systems through individual browser sessions with centralized logging, replay, and live-view capabilities for troubleshooting. Observability becomes critical One of the most significant differences between experimentation and production automation is operational visibility. When a test fails, a workflow breaks, or an AI agent performs an unexpected action, organizations need to understand exactly what happened. This requires more than simply knowing whether the automation succeeded or failed. Key observability features that cloud browser platforms are offering: Live view Screenshots and recordings Audit records Network traces Execution logs Browser console output These capabilities help engineering teams troubleshoot failures, allow operations teams to investigate incidents, and provide governance teams with accountability for automated actions. As browser-based agents become part of critical business processes, observability is becoming a foundational requirement to move to production. KYC and compliance verification: Financial institutions can automate identity checks across registries, verification services, and compliance portals while maintaining isolated customer sessions, auditability, and human review for high-risk decisions. Checkout and payment validation: E-commerce teams can validate end-to-end purchasing journeys using session recordings, traces, screenshots, and live browser visibility to quickly diagnose checkout failures, flaky tests, payment gateway issues, and abandoned transactions. Reproducibility and environment consistency Local browsers often fail due to incorrectly setting up environments to complete the task at hand. One runner may have a different browser version; another may have a stale driver or a missing system package. The browser states from one local browser environment to another may be different due to leftover cookies or cached state. Cloud-hosted browsers move that surface area into a managed environment. They handle the underlying infrastructure setup and complexity, and provide consistent browser versions, dependencies, and clean starting states. This standardization ensures cleaner browser sessions and predictable states, making it easier to reproduce and debug errors. Testing web application workflows: Each run starts with the expected browser version and state, improving consistency and reducing failures caused by stale cookies, cached data, missing packages, or machine-specific configuration. Debugging support incidents: An automated support workflow can replay the same customer journey in a known environment, preserving session artifacts and making intermittent defects easier to reproduce. Geographic distribution and network realism Local browsers originate from one machine and one network. That is a poor match for globally used applications, regional pricing, localized content, and compliance-sensitive traffic paths. Cloud-hosted browsers provide regional execution, IP controls, or geo-targeting. For scraping and data extraction, geography can determine what data is visible. For test automation, geography can expose latency and localization issues. For enterprise workflows, region and network path can affect compliance and access-control requirements. With cloud browsers, all of the above becomes easily configurable. Web data collection at scale: Organizations can gather competitor pricing, product availability, market intelligence, and localized content across thousands of websites by distributing workloads across concurrent browser sessions in multiple geographies. Travel, commerce, and purchasing workflows: Agents can compare offers, inventory, pricing, taxes, and payment options across regions before completing bookings or purchases, with approval checkpoints for consequential actions. Cross-border business processes: Logistics, trade, and operations teams can submit forms, declarations, and regulatory filings through region-specific carrier and government portals while adhering to network, residency, and compliance requirements. Testing digital customer experiences: Engineering and QA teams can validate signup, purchase, and service workflows from multiple regions to identify localization, performance, compliance, and geo-routing issues before they impact customers. Scale and parallel execution Historically, scale was often the primary reason organizations adopted cloud-based automation. Scale remains important. Browser automation benefits largely from scaled execution and parallelism because most automation tasks are independent test cases, page crawls, price checks, form submissions, document downloads, and agent evaluations, that can all run concurrently. Scraping competitor or vendor data: Running web scraping tasks across thousands of websites can be distributed crawls across concurrent browser sessions. RPA transactions: Operations teams can process hundreds of spreadsheet records through a legacy supplier portal in parallel, no need of dedicated desktop infrastructure. Customer onboarding: AI agents running on websites that incur seasonal surge in customer applications can complete form filling without having to worry about scaling their infrastructure. When local browsers still make sense The case for cloud-hosted browsers is strong, but it is not absolute. Local browsers remain useful in a few situations. Debugging automation scripts: Developers debugging one-flow, stepping through script or iterating on selectors, local execution may be fast and simple. Specialized browser modifications: Deep customizations that require patched browser binary, specialized extensions, direct file-system access, GPU behaviour, or unusual OS-level dependencies, local or self-managed infrastructure may be easier. Workloads with very limited scale requirements: If the scale is very small and frequency is occasional, running locally may be cheaper and simpler. The transition point typically occurs when requirements expand beyond a single user and begin involving multiple teams, environments, agents, regions, or when concurrency, reliability, observability, security, or maintenance becomes more important than initial setup simplicity. What customers should look for in a cloud-hosted browser platform A managed cloud browser platform is not just about connecting to browser instances from anywhere. Customers should evaluate: Isolation: Are sessions cleanly separated? Can state be controlled, persisted, or discarded intentionally? Scale: Can the platform handle bursty traffic and parallel execution automatically without having to worry about the scale? Reproducibility: Are browser versions, OS environments, and artifacts consistent and standard across the platform? Observability: Are live view, logs, traces, screenshots, videos, network data, and audit records available? Security: Are the browsers updates managed and kept up-to-date with the latest security patches? Are least privilege, identity, network boundaries, domain controls, and human approval patterns supported? Geography: Can workloads run from relevant regions or network paths? Cost visibility: Is pricing tied to minutes, sessions, data transfer, or concurrency and does that match the expected workload? Looking ahead The browser is now an execution environment. AI agents use browsers to interact with the parts of the web that do not have APIs. Test suites use browsers to validate releases. Data teams use browsers to extract information from the web. Operations teams use browsers to bridge legacy systems that will not be replaced soon. While local browsers helped get the automation started and they will continue to remain useful for prototyping, debugging, and small-scale work, the future of serious production-grade browser automation is cloud-hosted: elastic, isolated, observable, governed, and integrated into the rest of the enterprise platform. To know more: What is Playwright Workspaces? Playwright Workspaces free trial803Views0likes0CommentsGive Your AI Agent Eyes: Browser-Harness Meets Playwright Workspaces Remote Browsers
What happens when you hand a coding agent a real browser — not a mock, not an API wrapper, but a full Chromium instance running in the cloud? It fills form for you. It does research for you. It navigates JavaScript-heavy SPAs that would make any REST-based scraper weep. And it does it across 10+ parallel sessions without touching your local machine. This is the story of combining two tools that were built for different worlds — and discovering they're a perfect fit. The Problem Today's coding agents — Codex, Claude Code, Copilot — are extraordinary at reading and writing code. But ask one to product availability on an web site, and it hits a wall. Modern websites are JavaScript-rendered, authentication-gated, geolocation-aware, and hostile to simple HTTP requests. The agent needs a real browser. Not requests.get(). Not a headless puppeteer script you wrote last Tuesday. A browser that renders CSS, executes JavaScript, handles cookies, and lets the agent see what a human would see. Enter Browser-Harness Browser-harness is an open-source tool that gives AI agents direct control over a Chrome browser via the Chrome DevTools Protocol (CDP). It exposes a clean Python API: ● agent: wants to upload a file │ ● agent-workspace/agent_helpers.py → helper missing │ ● agent writes it agent_helpers.py │ + custom helper ✓ file uploaded One websocket to Chrome, nothing between. The agent writes what's missing during execution. The harness improves itself every run. But there's a catch. Where does this browser run? The Infrastructure Gap If the browser runs locally, you've got problems: Your machine is busy. Running Chrome while the agent works eats RAM and CPU. No parallelism. One browser per machine. Want to scrape 10 sites simultaneously? Buy 10 machines. No consistency. Different OS, different Chrome versions, different results. No isolation. Letting the agent run amock on autopilot with your local browser can be risky, it can reuse your creds, stored cookies and sessions No observability. The agent is clicking around in a browser you can't see. What you really want is a browser that runs somewhere else — managed, scalable, observable — and your agent just connects to it over a WebSocket. Enter Playwright Workspaces Playwright Workspaces provides exactly this: remote browser endpoints on Azure. You make an HTTP request, a Chromium instance spins up in the cloud, and you get back a WebSocket URL (wss://...) to connect via CDP. The key insight: browser-harness speaks CDP. Playwright Workspaces serves CDP. They snap together like LEGO. Your Agent → browser-harness → CDP WebSocket → Playwright Workspaces → Cloud Chromium No local Chrome needed. No browser installation. No display server. Just a WebSocket connection to a fully managed browser. The Two-Step Connection Flow Connecting them is surprisingly simple: Step 1: Provision a remote browser def get_connect_options(os_name="linux", run_id=str(uuid.uuid4())) -> tuple[str, dict[str, str]]: service_url = os.getenv("PLAYWRIGHT_SERVICE_URL") service_access_token = os.getenv("PLAYWRIGHT_SERVICE_ACCESS_TOKEN") headers = {"Authorization": f"Bearer {service_access_token}"} service_run_id = os.getenv("PLAYWRIGHT_SERVICE_RUN_ID") ws_endpoint = f"{service_url}?os={os_name}&runId={service_run_id}&api-version=2025-09-01" return ws_endpoint, headers Step 2: Point browser-harness at it export BU_CDP_WS="${session_url}" browser-harness -c "print(page_info())" # → {'url': 'about:blank', 'title': '', 'w': 780, 'h': 441} That's it. Your agent now controls a cloud browser. What This Unlocks: A Real-World Demo We gave a coding agent this prompt: "Go to Website1, search for gifts under ₹500 for 10-year-old kids. Must be useful, reusable (not single-use). Delivery in Bengaluru within 3 days. Must have 5 pieces available." Here's what the agent did — autonomously, with no human intervention: Provisioned a remote Chromium browser via Playwright Workspaces Connected browser-harness to the cloud browser over WebSocket Navigated to FirstCry.com Set delivery location to Bengaluru (pincode 560001) Searched for kids' gifts Applied filters — price ₹0–250 and ₹250–500 via JavaScript DOM interaction Browsed products, rejecting single-use items (greeting cards) in favor of reusable ones (stainless steel water bottles) Checked delivery dates — rejected items with 6-day delivery, found ones with Next Day Delivery Verified stock availability — confirmed ADD TO CART was active with no stock warnings Took screenshots at every step for audit and debugging Result: Found the Brand A 600 Stainless Steel Water Bottle at ₹444.69 with next-day delivery to Bengaluru. All criteria met. The entire workflow ran on a remote browser in Azure — the local machine never launched Chrome. The Power of Remote Endpoints Why does running browsers remotely change everything? 1. Massive Parallelism Spin up multiple remote browsers and work in parallel. Each gets its own isolated Chromium instance. No resource contention, no port conflicts. 2. Zero Local Dependencies No Chrome installation. No chromedriver version mismatches. No --no-sandbox hacks. The browser is a managed service — you just connect to it. 3. Geographic Flexibility Remote browsers run in Azure data centers. Need to see what a website looks like from East US? Or Southeast Asia? Pick your region. The browser's IP and geolocation are in the cloud, not on your laptop. 4. Ephemeral & Secure Each browser session is isolated and destroyed when the WebSocket closes. No leftover cookies, no persistent state leaking between runs. Every session starts clean. The Bigger Picture We're at an inflection point. AI agents are moving from code generation to code execution — and execution means interacting with the real world. Browsers are the universal interface to that world. The combination of browser-harness (agent-to-browser control) and Playwright Workspaces (managed remote browsers) creates a powerful primitive: give any AI agent a browser, anywhere, on demand. Get Started The full sample — including the playwright_service_client.py helper, setup prompts, and environment templates — is available here: 📦 playwright-workspaces/samples/browser-harness Resources: Playwright Workspaces Documentation Browser-Harness GitHub Create a Playwright Workspace1.1KViews3likes0CommentsGain Visibility into Cloud Browser Usage with Browser Activity Logs in Playwright Workspaces
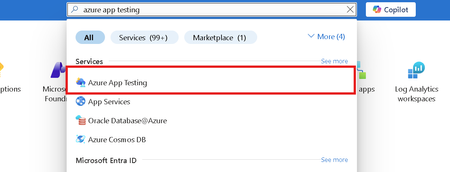
Today, we're announcing a new feature to view the usage metrics for a browser session using the Browser Activity Logs in Playwright Workspaces. Modern test automation and browser-based workflows increasingly rely on cloud-hosted browsers. As teams scale their usage across test runs, automation tools, and AI-driven agents, visibility and traceability into browser usage become critical, not just for debugging, but also for cost awareness and governance. To address this, Browser Activity Logs in Playwright Workspaces provide a centralized view of every cloud browser session provisioned by Playwright Workspaces. In this post, we’ll walk through what Browser Activity Logs are, what insights they offer, and how you can access them from the Azure portal. What is a Browser Session? In Playwright Workspaces, a Browser Session represents any browser instance provisioned by the service, regardless of how it was initiated. This includes browsers started by: Playwright Workspaces test run Browser Automation Tool Other automation clients that connect to the workspace Every time a browser is requested, Playwright Workspaces automatically creates a Browser Session and records it in the Browser Activity Logs in the Azure portal. This ensures that all browser usage (testing and non-testing scenarios) is fully observable from a single view. What are Browser Activity Logs? The Browser Activity Logs page lets you track the full lifecycle of each browser session, from creation to completion. For every session, you can view the following details: Session Name / ID – A unique identifier for the browser session Start Time – When the browser session started End Time – When the browser session ended Billable Time – Total duration of the session that is billable Source Type – The client that initiated the session Playwright Workspaces test run Browser automation tool Others Source ID – Identifier of the initiating client Test run ID Conversation ID Status – Current state of the session. Created Active Completed Failed Browser Type – Browser used for the session Operating System – OS used by the browser Creator Name / ID – User who initiated the session Together, these fields give you end-to-end traceability for every browser instance created in your workspace. Filtering and Analyzing Browser Usage The Browser Activity Logs page includes built-in filters to help you quickly analyze usage patterns. You can filter browser sessions by: Time range Last 30 days Last 60 days Last 90 days Source type Playwright Workspaces test runs Browser automation tools Other sources Source ID Test run ID Conversation ID Status Created Active Completed Failed These filters make it easy to answer common questions such as: How many browser sessions were created by a specific test run? Which automation scenarios are consuming the most browser time? How much billable browser time was used in a given period? How to View Browser Activity Logs in the Azure Portal Prerequisites Before you begin, make sure you have: An Azure account with an active subscription Owner, Contributor, or a classic administrator role on the subscription A Playwright Workspace created in your subscription Reader, Contributor, or Owner access to the Playwright Workspace Step-by-step: Accessing Browser Activity Logs Sign in to the Azure portal. From the home page, search for and select Azure App Testing. In the Azure App Testing hub, select View resources under Playwright Workspaces. Search for and open your Playwright Workspace. In the left navigation pane, select: Browser sessions → Browser activity log Click on the Browser session to see additional details. Use the Source ID filter to narrow down results: Enter a Playwright Workspaces test run ID to view browser sessions for a specific test run. Enter a Foundry conversation ID to view browser sessions created by a browser automation tool. Alternatively, filter by Source type to view all sessions from a specific client. Why Browser Activity Logs Matter Browser Activity Logs unlock three key benefits for teams using Playwright Workspaces: Visibility – See every browser session created across testing and automation scenarios. Traceability – Correlate browser usage back to test runs, tools, or conversations. Cost transparency – Understand billable browser time and optimize usage as you scale. Whether you’re debugging a failed automation workflow, reviewing usage across teams, or tracking costs, Browser Activity Logs give you the clarity you need. Get Started Today Browser Activity Logs in Playwright Workspaces is now available for all Playwright Workspace users. To learn more and start exploring your browser usage, visit the Azure portal and head to the Browser Activity Log page in Playwright Workspaces today. Share your feedback As always, we welcome feedback, let us know what works great for you and what you’d love to see next.467Views0likes0CommentsRun Playwright Tests on Cloud Browsers using Playwright Workspaces
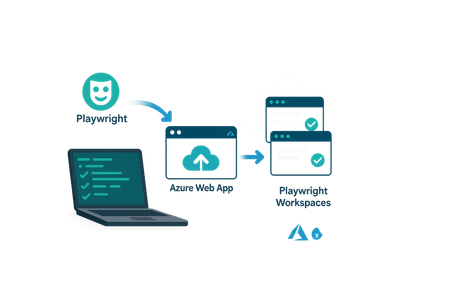
This post walks through setting up and running Playwright UI and API tests on Azure Playwright Testing Service (Preview). It covers workspace setup, project configuration, remote browser execution, and viewing test reports and traces using Visual Studio or VS Code.2.2KViews1like0Comments
Learn New Skills in the New Year
New year’s resolution: Start writing better code faster in 2025. Kick off the new year by learning new developer skills and elevate your career to the next level. In this post, we explore learning resources and live events that will help you build critical skills and get started with cutting-edge technologies. Learn how to build custom agents, code intelligent apps with familiar tools, discover new possibilities in .NET 9, use Copilot for testing and debugging, and more. Plus, get details about using GitHub Copilot in Visual Studio Code—for free! New AI for Developers page Check out the new AI for Developers page. It's packed with free GitHub courses on building apps, machine learning, and mastering GitHub Copilot for paired programming. Learn your way and skill up for what's next in AI. Use GitHub Copilot in Visual Studio Code for free Did you hear the news? You can now use GitHub Copilot in Visual Studio Code for free. Get details about the new Copilot Free plan and add Copilot to your developer toolbox. What is Copilot Studio? Have questions about Copilot Studio? This article from Microsoft Learn covers all the basics you need to know about Copilot Studio—the low-code tool for easily building agents and extending Microsoft 365 Copilot. From C# to ChatGPT: Build Generative AI Solutions with Azure Combine your C# skills with the cutting-edge power of ChatGPT and Azure OpenAI Service. This free learning path introduces you to building GenAI solutions, using REST APIs, SDKs, and Azure tools to create more intelligent applications. Register for the Powerful Devs Conference + Hackathon Register for the Powerful Devs Conference + Hackathon (February 12-28, 2025) and get more out of Power Platform. This one-day online conference is followed by a 2-week hackathon focused on building intelligent applications with less effort. Code the future with Java and AI: RSVP for Microsoft JDConf 2025 today Get ready for the JDConf 2025—Microsoft's annual event for Java developers. Taking place April 9-10, this year’s event will have three separate live streams to cover different regions. Join to explore tools and skills for building modern apps in the cloud and integrating AI. Build custom agents for Microsoft Teams Learn how to build custom agents for Microsoft Teams. This free learning path will teach you about different copilot stacks, working with Azure OpenAI, building a custom engine agent. Start building intelligent Microsoft Teams apps using the LLMs and AI components. Microsoft Learn: Debug your app with GitHub Copilot in Visual Studio Debug more efficiently using GitHub Copilot. This Microsoft Learn article shows you how. Discover how Copilot will answer detailed questions about your code and provide bug fixes. Make Azure AI Real: Watch Season 2 Elevate your AI game with Make Azure AI Real on demand. Season 2 digs into the latest Azure AI advancements, with practical demos, code samples, and real-world use cases. GitHub Copilot Bootcamp Streamline your workflow with GitHub Copilot—craft more effective prompts and automate repetitive tasks like testing. This GitHub Copilot Bootcamp is a 4-part live streaming series that will help you master GitHub Copilot. 10 Days of GenAI – Gift Guide Edition Start building your own Gen AI application. These short videos outline 10 steps for creating your app—choose a model, add functions, fine tune responses, and more. Extend Microsoft 365 Copilot with declarative agents using Visual Studio Code Check out this new learning path from Microsoft Learn to discover how you can extend Microsoft 365 Copilot with declarative agents using VS Code. Learn about declarative agents and how they work. Developer's guide to building your own agents Want to build your own agents? Watch this Ignite session on demand for a look at the new agent development tools. Find out how to create agents built on Microsoft 365 Copilot or your custom AI engine. Master distributed application development with .NET Aspire Get started with .NET Aspire—an opinionated, cloud-ready stack for building distributed applications with .NET. This series covers everything from setup to deployment. Start your journey toward mastering distributed app development. Learn: What's new in .NET 9 Discover what's new in .NET 9. Learn about new features for AI, improvements for building cloud-native apps, performance enhancements, updates to C#, and more. Read the overview and get started with .NET 9. Become a .NET AI engineer using the OpenAI library for .NET Use your .NET skills to become an AI engineer. With the OpenAI library, .NET developers can quickly master critical AI skills and apply them to real world apps. Read the blog to learn more about the OpenAI library for .NET. Test like a pro with Playwright and GitHub Copilot Supercharge your testing using Playwright and GitHub Copilot. Watch this in-depth demo and discover how you can easily create end-to-end tests using Playwright's powerful built-in code generator. Other news and resources from around Microsoft · Microsoft Learn: Why and how to adopt AI in your organization · Microsoft Learn: Learn to use Copilot in Microsoft Fabric · AI Toolkit for Visual Studio Code: Update highlights · Teams Toolkit for Visual Studio Code update · RAG Deep Dive: Live streams · Learn Together: SQL database in Fabric · Become an AI security expert using OpenAI with Azure Managed Identity · Deploy, monitor, and manage development resources with Microsoft Dev Box · Microsoft Playwright testing · Introduction to artificial intelligence and Azure AI services · Azure AI-900 Fundamentals Training event series · Leveraging cloud-native infra for your intelligent apps · Platform engineering with GitHub · Extend declarative agents for Microsoft 365 Copilot with API plugins using Visual Studio Code · Introducing the Microsoft 365 Agents SDK · Azure Live Q&A events · Get started with multimodal parsing for RAG using GPT-4o, Azure AI Search, and LlamaParse4.3KViews2likes0Comments
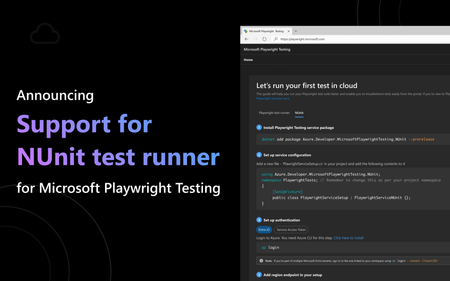
Microsoft Playwright Testing service now supports NUnit test runner
Microsoft Playwright Testing is an Azure service that accelerates builds by running tests in parallel, enhances test coverage by enabling testing across multiple operating systems and browsers, and simplifies troubleshooting with a unified dashboard for test results and artifacts. We are excited to announce that Playwright Testing service now supports the NUnit test runner, bringing the following benefits to .NET developers: Speed up your NUnit test runs by running more .NET tests in parallel. Expand test coverage by running your .NET tests across multiple operating systems and browsers. Troubleshoot faster using Microsoft Playwright Testing’s rich reporting capabilities. Faster builds with parallel test execution As your application grows, test suite complexity increases, leading to longer execution times that slow development and delay releases. On both dev machines and CI agents, resource constraints limit the number of browsers that can run in parallel, resulting in longer wait times. With NUnit support in Playwright Testing, you can run more .NET tests in parallel across multiple cloud-hosted browsers. By offloading tests to managed infrastructure, the service eliminates resource bottlenecks, enabling simultaneous execution to speed up builds and reduce pipeline delays. This seamless integration preserves your NUnit workflow, providing faster feedback without requiring additional setup or maintenance. Comprehensive test coverage across browsers and operating systems Modern web applications are complex, both in features and compatibility across multiple browsers and operating systems. Testing across these configurations lengthens execution time and adds infrastructure burdens. With NUnit support in Microsoft Playwright Testing, you can easily run your .NET tests across various OS-browser combinations without the need for additional infrastructure management. The service-managed infrastructure ensures reliable test execution, whether running tests locally or in your CI pipeline. The service’s cross-platform coverage and scalable infrastructure guarantee that your application performs flawlessly across browsers and operating systems, providing a consistent and optimized user experience. Easy troubleshooting with reporting As development teams scale and release new features, quickly resolving issues becomes critical to maintaining quality. Delays in issue resolution can disrupt the entire development process. With NUnit support in Playwright Testing, your team can access detailed test results from CI/CD runs of .NET tests, along with rich artifacts like error logs, screenshots, videos, and traces, all within a unified dashboard for rapid troubleshooting. The reporting feature highlights tests that need attention, filtering results to focus on failures, so you can immediately start troubleshooting. You can easily click through each test to access all the necessary information to resolve issues. All artifacts are securely stored in a centralized location with customizable permissions. A standout feature is the Trace Viewer, which allows you to visually navigate through your NUnit test execution. You can step through tests or use the timeline to examine the page state before and after each action, including detailed logs, DOM snapshots, network activity, errors, and console output at every step for precise troubleshooting. Get started with Playwright Testing service Getting started is simple. In just a few steps, you can integrate your NUnit test suite with Microsoft Playwright Testing. Check out our QuickStart and try the service today! Share your feedback Your feedback is invaluable to us. Share your thoughts and help us improve Microsoft Playwright Testing. Learn more about the Microsoft Playwright Testing service Learn more about using the Playwright Testing service for your web application testing. Explore the features and benefits that Microsoft Playwright Testing offers. Learn about our flexible pricing. Use the pricing calculator to determine your costs based on your business needs.1.2KViews0likes0Comments