mde
6 Topics
Finding the Elusive MDE PUA Audit Events on Linux
Potentially Unwanted Applications, or PUA, they aren't necessarily malware, but they are applications you probably don't want running across your environment either. Microsoft defines potentially unwanted applications as software that can adversely affect endpoint performance or use. Examples include advertising software, software bundlers, and applications that use behaviors intended to evade security products. Microsoft Defender can also consider an application's reputation when determining whether software qualifies as potentially unwanted. That sounds straightforward. On Windows, it generally is. On Linux, finding the resulting audit events requires knowing exactly where to look. And that is where things get interesting. PUA, PUP… Same Neighborhood, Slightly Different Address Before going further, it is worth clearing up some terminology. Across the security industry, you will commonly encounter both PUP, or Potentially Unwanted Program, and PUA, or Potentially Unwanted Application. The terms are frequently used for software that isn't necessarily malicious but has characteristics that make its presence undesirable, such as intrusive advertising, bundling additional software, or other behavior the user might not have knowingly requested. Microsoft uses Potentially Unwanted Application (PUA) as its product and detection terminology. Microsoft specifically distinguishes PUA from malware. A PUA might cause poor system performance, display unexpected advertisements, install other software, or have a poor reputation because of undesirable behavior, but those characteristics don't automatically make the application malware. Microsoft's classification criteria include examples such as: Advertising software that displays advertisements or promotions, including injecting advertisements into webpages. Bundling software that offers to install additional software that isn't digitally signed by the same entity, or that itself qualifies as PUA. Evasion software that actively attempts to avoid detection by security products or behaves differently when security software is present. Applications that have developed a poor reputation based on undesirable behavior. Microsoft's broader software-classification model also distinguishes between unknown software, malware, unwanted software, and other classifications. Software can therefore be legitimate and functional while still meeting Microsoft's criteria for classification as potentially unwanted. For the rest of this article, we'll use PUA, because that is the terminology used by Microsoft Defender and, more importantly for our investigation, the Linux product logs identify these detections explicitly as: potentially_unwanted_application That string is going to become very useful once we start looking for the supposedly elusive audit events. PUA Audit and Block on Windows On Windows, PUA protection is part of Microsoft Defender Antivirus. Administrators can configure Defender to identify applications that Microsoft considers potentially unwanted and determine how those applications should be handled. Microsoft documents PUA protection and provides the AMTSO Potentially Unwanted Application test file (Feature Settings Check - Potentially Unwanted Applications - AMTSO) as its standard demonstration scenario. Microsoft's demonstration documentation identifies Windows, Windows Server, macOS, and Linux among the supported operating systems for the PUA demonstration. The two operating modes we're interested in are conceptually simple: Audit Defender identifies the PUA but doesn't block it. This is useful when you want to understand the potential impact of enabling PUA protection before enforcing it. Block Defender identifies the PUA and takes the configured protection action. On Windows, for a device onboarded to Microsoft Defender for Endpoint – that telemetry and audit information is available in the XDR Security portal. You can find PUA detections in the Additional Fields of the AntivirusDetection action type in the DeviceEvents table – and an alert will fire when in PUA is in block mode: DeviceEvents | where ActionType == "AntivirusDetection" | extend x = parse_json(AdditionalFields) | project Timestamp, DeviceName, FolderPath, FileName, SHA256, ThreatName = tostring(x.ThreatName), WasExecutingWhileDetected = tostring(x.WasExecutingWhileDetected), WasRemediated = tostring(x.WasRemediated) | where ThreatName startswith_cs 'PUA:' Microsoft Defender Antivirus events can be investigated through: Applications and Services Logs > Microsoft > Windows > Windows Defender > Operational Defender detection events can provide information such as the threat name, threat ID, category, path, detection origin, detection type, and detection source. That makes auditing and troubleshooting reasonably familiar territory for Windows administrators. The experience on Linux, however, is different. PUA Protection on Linux Microsoft Defender for Endpoint on Linux also supports PUA protection. Microsoft documents three PUA actions: Off: PUA protection is disabled. Audit: PUA files are reported in the product logs, but no remediation is performed. Block: PUA files are reported and action is taken against them. The distinction between Audit and Block is particularly important. In PUA Audit mode: PUA files are reported in the product logs. They aren't reported in the Defender portal through this PUA mechanism. No infection record is stored in threat history. No action is taken against the file. In Block mode: The detection is reported in the product logs. It is reported in the Defender portal. A record is stored in threat history. Defender takes action on the PUA. PUA behavior can be configured locally with mdatp. To configure Audit: sudo mdatp threat policy set --type potentially_unwanted_application --action audit To configure Block: sudo mdatp threat policy set --type potentially_unwanted_application --action block There is one important distinction worth calling out here: PUA Audit mode isn't the same thing as the broader Microsoft Defender for Endpoint Antivirus Passive Mode on Linux. PUA Audit is specifically the handling policy for applications that are detected and classified as potentially unwanted. For this article, we're testing and focusing on PUA Audit. A Windows PUA on Linux? Yes. Here's where the test gets more interesting. The AMTSO PUA test artifact is a Windows executable. At first glance, that doesn't seem particularly useful when we're trying to validate PUA protection on Linux. After all, we're testing on Linux. But Defender's file inspection isn't limited to applications that can execute natively on the operating system. A Windows PE file sitting on a Linux filesystem can still be inspected and classified. And we can demonstrate that directly. Microsoft's PUA demonstration directs administrators to the AMTSO Potentially Unwanted Application test file, and Microsoft's current demonstration documentation includes Linux among the supported operating systems. On our Linux test machine, we downloaded: PotentiallyUnwanted.exe The important point is that we don't need to execute the Windows executable on Linux. In our testing, simply causing filesystem activity against the file was sufficient to make Defender inspect it. The file initially resided in: /home/ritter/Downloads/PotentiallyUnwanted.exe We then used the Linux graphical file manager to move it into: /home/ritter/Music/PotentiallyUnwanted.exe That was enough to generate another PUA Audit observation. The Defender record showed: "scan_reason":"move" And, more importantly, Defender classified the file as: "name":"PUA:Win32/EICAR_Test_File" with: "type":"potentially_unwanted_application" and: "status":"infected" The event also recorded information about the process responsible for the filesystem operation. In our test, moving the file graphically resulted in the process being recorded as: /usr/bin/nautilus So although the test artifact is a Windows executable, MDE running on Linux still inspected and classified it as PUA:Win32/EICAR_Test_File. That's exactly what we needed. So Where Is the Audit Event? This is the elusive part. If you immediately start looking in the Defender portal or expect PUA Audit to behave like PUA Block, you're likely to come away wondering whether anything happened. Microsoft's Linux documentation tells us that Audit-mode PUA files are reported in the product logs and that no infection record is stored in threat history. Fair enough. But that naturally leads to another question: Which product log? Instead of guessing, we asked Linux. A recursive grep across the MDE log directory provides a simple way to find anything containing the PUA classification string: sudo grep -RniH 'potentially_unwanted' /var/log/microsoft/mdatp/ Where: R searches recursively. n displays the matching line number. i makes the search case-insensitive. H forces grep to display the filename. And there it was. On our test system, the PUA Audit records were located in: /var/log/microsoft/mdatp/microsoft_defender_core_err.log If you only want to determine which log files contain PUA records: sudo grep -Rli 'potentially_unwanted' /var/log/microsoft/mdatp/ Once you've identified the log, you can search it directly: sudo grep -ni 'potentially_unwanted' /var/log/microsoft/mdatp/microsoft_defender_core_err.log Or include surrounding lines for additional context: sudo grep -ni -B5 -A10 'potentially_unwanted' /var/log/microsoft/mdatp/microsoft_defender_core_err.log Our test produced records containing information similar to: [Audit]: Source: { "$type":"real_time", "scan_reason":"move", "process":{ "path":"/usr/bin/nautilus" } }, File: /home/ritter/Music/PotentiallyUnwanted.exe, Threat: { "name":"PUA:Win32/EICAR_Test_File", "type":"potentially_unwanted_application", "status":"infected" } And there it is. The PUA audit event exists. You just have to go spelunking through the local Defender product logs to find it. The Microsoft documentation is technically correct: PUA Audit detections are written to the product logs. Knowing what string to search for and which log actually contained the events on our test system makes that guidance considerably more actionable. That's Fine for One Server. What About 1,000? Running grep on a test machine is easy. Running grep individually across hundreds or thousands of Linux servers obviously isn't the operational model we want. Once we know where the information resides, however, the problem changes from a Defender problem into a log collection problem. And that's a much easier problem to solve. One option is Azure Monitor Agent (AMA). AMA supports collecting custom text logs from Linux systems through an Azure Monitor Data Collection Rule (DCR) and sending those records to a Log Analytics workspace. Conceptually: A DCR can be configured to collect the Defender text log identified during testing. Azure Monitor supports Linux custom-text-log file patterns and wildcards for appropriate log-file collection scenarios. Azure Monitor Custom Text Logs also supports ingestion-time transformations, allowing records to be filtered or formatted before they're written to the destination table. That creates an interesting opportunity. Rather than collecting every line from a verbose Defender diagnostic log, a collection strategy could focus on the records containing: potentially_unwanted_application Once centralized in Log Analytics, those records become queryable with KQL. For example, if the records were ingested into a custom table called MDEPUAAudit_CL, an initial investigation could start with: MDEPUAAudit_CL | where RawData contains "potentially_unwanted" From there, the raw records could be parsed for useful reporting fields including: Host Timestamp File path Detection name PUA classification Scan reason Initiating process First occurrence Last occurrence Number of observations Turning Audit Mode into a Deployment Tool This is ultimately where the exercise becomes useful. PUA Audit doesn't have to be merely a configuration checkbox. It can become a pre-enforcement assessment mechanism. The workflow looks something like this: Instead of asking: "What happens if we turn PUA Block on?" we can start answering a much better question: "What has Defender already identified as PUA while we've been running in Audit?" And now we know where the answer is hiding. Reference Live link Detect and block potentially unwanted applications with Microsoft Defender for Endpoint on Linux https://learn.microsoft.com/en-us/defender-endpoint/linux-pua Detect and block potentially unwanted applications with Microsoft Defender Antivirus https://learn.microsoft.com/en-us/defender-endpoint/detect-block-potentially-unwanted-apps-microsoft-defender-antivirus How Microsoft identifies malware and potentially unwanted applications https://learn.microsoft.com/en-us/unified-secops/criteria Potentially unwanted applications (PUA) demonstration https://learn.microsoft.com/en-us/defender-endpoint/defender-endpoint-demonstration-potentially-unwanted-applications AMTSO Feature Settings Check: Potentially Unwanted Applications https://www.amtso.org/feature-settings-check-potentially-unwanted-applications/ Microsoft Defender Antivirus event IDs and error codes https://learn.microsoft.com/en-us/defender-endpoint/troubleshoot-microsoft-defender-antivirus Microsoft Defender for Endpoint on Linux resources https://learn.microsoft.com/en-us/defender-endpoint/linux-resources Collect text file from virtual machine with Azure Monitor https://learn.microsoft.com/en-us/azure/azure-monitor/vm/data-collection-log-text Collect logs from text files with Azure Monitor Agent and ingest to Microsoft Sentinel https://learn.microsoft.com/en-us/azure/sentinel/connect-custom-logs-ama Collect guest log data from virtual machines with Azure Monitor https://learn.microsoft.com/en-us/azure/azure-monitor/vm/data-collection DeviceEvents table in the Advanced Hunting schema https://learn.microsoft.com/en-us/defender-xdr/advanced-hunting-deviceevents-table Microsoft Defender XDR Advanced Hunting schema tables https://learn.microsoft.com/en-us/defender-xdr/advanced-hunting-schema-tables
Microsoft Defender for Endpoint (MDE) — Custom Role Design for Troubleshooting Mode–Only Access
1) Introduction In customer environments, Security Operations (SOC) teams and Windows infrastructure teams frequently need to investigate endpoint issues in the Microsoft Defender for Endpoint portal—often under time pressure—while still preserving strong governance over who can change security controls. Because Troubleshooting Mode can enable temporary modification of Defender Antivirus settings even when devices are governed by organizational policies (for example, when policy protections are in place using Tamper protection settings), granting this capability broadly can introduce configuration drift, increase operational risk, and blur accountability. To address this, customers typically require a least‑privilege, scoped access model that enforces Segregation of Duties (SoD): Investigators (Security Reader) retain visibility and investigation capability but cannot create or modify MDE security policies. Only an explicitly authorized group is granted the minimum permissions required to enable Troubleshooting Mode, and that access is restricted to a defined device scope using device groups—supporting both risk reduction and clear governance. This approach ensures teams can perform required investigations and controlled troubleshooting while maintaining least privilege, SoD, and predictable operational impact across the customer’s environment. This document describes an approach to providing controlled access to Troubleshooting Mode on a scoped set of devices. - An Entra ID user group to collect eligible users - A custom Defender XDR role with only the minimum required permissions - Microsoft Defender for Endpoint device groups to scope where those permissions apply The goal is to enable safe troubleshooting while maintaining least privilege and preventing unintended policy changes. 2) Prerequisite & Coverage - An Entra ID user group to collect eligible users - A custom Defender XDR role with only the minimum required permissions - Microsoft Defender for Endpoint device groups to scope where those permissions apply The goal is to enable safe troubleshooting while maintaining least privilege and preventing unintended policy changes. This setup is necessary to: - Enforce least privilege (only the permissions needed for Troubleshooting Mode and limited operational actions) - Scope powerful actions to a defined device group instead of all devices - Support a split model where one Security Reader group gets Troubleshooting Mode access and another Security Reader group remains view/operate without TS Mode - Preserve governance: users can investigate and perform limited actions but cannot create or modify MDE policies - Improve auditability by ensuring key actions are observable via device telemetry and the Action Center (while acknowledging that some telemetry may not include the initiating username). 3) Implementation Steps for Troubleshooting Mode (TO BE PERFORMED IN MICROSOFT DEFENDER PORTAL / ENTRA ID) 3.1 Prepare Entra ID User Group Identify an existing Entra ID user group that contains users (IT Infra Team) with the Security Reader role or create a new dedicated Entra ID user group for this purpose. - This group will be used consistently for: - Assigning the custom Defender XDR role - Scoping access to Defender for Endpoint device groups 3.2 Create and Assign Custom Defender XDR Role Create a custom Defender XDR role with Microsoft Defender for Endpoint (MDE) Security Settings Management permissions. - While creating the custom role, select only the minimum required permissions to maintain a least-privilege model. - Assign this custom Defender XDR role to the Entra ID user group identified in Step 1. Reference: See screenshots below for role creation, permission selection, and Entra ID group assignment. 3.3: Assign Entra ID User Group to Device Group Assign the same Entra ID user group (used in Steps 1 and 2) to a Microsoft Defender for Endpoint device group. - Devices in the device group should be dynamically grouped using supported criteria such as: - Device tags - Device name patterns - Other supported device attributes - This scoping ensures that the custom role permissions apply only to the intended set of devices. Reference: See screenshot under below showing device group creation and Entra ID group-to-device group assignment. 3.4 Resulting User Experience and Permissions After completing Steps 3.1 through 3.3, users who sign in with: - Security Reader role, and - Custom Defender XDR role will observe the following behavior in the Microsoft Defender portal: - Troubleshooting Mode is available on the scoped devices - Users cannot create or modify MDE policies - Users have access only to a controlled set of operational and investigative actions, including: - Exclude - Go hunt - Download force release from isolation script - Ask Defender Experts This configuration enables safe troubleshooting while preventing configuration drift or unauthorized security policy changes. Reference: See screenshot under below illustrating the available actions and the absence of policy creation/modification options. Reference: See screenshot below where creation of AV policy failed as User will not have access to Intune to create policy. 4. In an alternate scenario, two separate Security Reader groups are maintained: one group requires access to Troubleshooting Mode, while the other should have no Troubleshooting Mode access. Users in the latter group (no TS Mode requirement) can continue to use standard Microsoft Defender for Endpoint (MDE) operational capabilities such as managing tags, setting device criticality, running antivirus scans, collecting an investigation package, reporting device inaccuracy, initiating advanced hunting (Go hunt), triggering policy sync, and running automated investigations. Users in the Troubleshooting Mode-enabled Security Reader group must also be assigned to the appropriate MDE device group to ensure their device-level access and workflows continue to function as expected. Reference: See the screenshot below, which illustrates the additional MDE capabilities available to users who also have access to the device group 5: Auditing and Event Visibility - Events related to Tamper Protection changes and Troubleshooting Mode enablement are captured in Microsoft Defender for Endpoint telemetry. - These events are logged and visible for audit and investigation purposes. - The username is not recorded in these specific event entries, which is expected behavior in the current Defender auditing model. However, the activation of Troubleshooting Mode is still logged and visible in the device Action Center, which allows confirmation that the mode was enabled on the device and the username. Reference: See screenshot under Step 6 showing the relevant audit and event records in Timeline of Device Page. Similarly ,correlate using KQL across two Event Tables (DeviceEvents & EntraIdSignInEvents). Below is the KQL query let TimeWindow = 10m; let Lookback = 7d; // Portal sign-ins (Security & Compliance Center) let DefenderPortalSignins = materialize( EntraIdSignInEvents | where Timestamp >= ago(Lookback) | where Application == "Microsoft 365 Security and Compliance Center" | project SignInTime = Timestamp, PortalUserUpn = AccountUpn, PortalUserObjectId = AccountObjectId, SignInIP = IPAddress, CorrelationId | extend TimeBucket = bin(SignInTime, TimeWindow) ); // Tamper-protection related events (broaden as needed) let TamperEvents = materialize( DeviceEvents | where Timestamp >= ago(Lookback) | where ActionType has "Tamper" or ActionType == "TamperingAttempt" | project TamperTime = Timestamp, DeviceId, DeviceName, ActionType, AdditionalFields | extend TimeBucket = bin(TamperTime, TimeWindow) ); // Output rows: (UPN, TamperTime) within +/- window TamperEvents | join kind=inner (DefenderPortalSignins) on TimeBucket | where abs(datetime_diff("minute", TamperTime, SignInTime)) <= toint(TimeWindow / 1m) | project PortalUserUpn, TamperTime, SignInTime, DeviceName, DeviceId, ActionType, SignInIP, CorrelationId, AdditionalFields | order by TamperTime desc This query correlates by time proximity. It indicates “user signed into the portal around the time a tamper event happened.” It does not prove that the portal user caused the tamper event (that requires audit telemetry for the action). If you later want attribution (“who enabled troubleshooting mode / changed settings”), we should pivot to Defender Action Center message and then confirm the user. The query can be used for generating alert using custom detection rule and take this alert to Security Operations center using API integration. Below is reference to the sample output of the query. 6) Summary Option 3 enables a controlled Troubleshooting Mode experience by combining Entra ID group-based user assignment, a custom Defender XDR role with minimal permissions, and device group scoping in MDE. With this approach, eligible users can troubleshoot only the intended devices and perform a limited, operationally safe set of actions, while policy creation/modification remains restricted. Audit and investigation are supported through MDE telemetry and device Action Center visibility, with the known limitation that certain telemetry entries may not include the initiating username.Bulk Device Tagging in MDE: PowerShell & API Approach
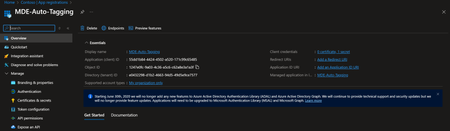
Effective device management is critical for ensuring security hygiene and maintaining operational agility within enterprise environments. In Microsoft Defender for Endpoint (MDE), device tagging plays a key role by enabling logical grouping, targeted policy application, efficient incident response, compliance tracking, and automation. It elevates device management from a manual, error-prone process to a scalable, context-aware workflow that aligns with both security and operational objectives. This guide presents a streamlined method for bulk tagging devices in MDE using the API and PowerShell automation. By following the outlined steps, security teams can automate the tagging process, minimize manual work, and maintain consistent device categorization to support compliance, reporting, and policy enforcement. Objective Use Microsoft Defender for Endpoint API to add tags for multiple devices efficiently. Step 1: Create App Registration in Entra ID Go to Entra ID (Azure Active Directory) → App registrations → New registration. Enter: Name: e.g., MDE-Auto-Tagging. Supported account types: Choose Single tenant (or multi-tenant if required). Redirect URI: Leave blank for now (not needed for client credentials flow). Click Register. Note down: Application (Client) ID Directory (Tenant) ID Step 2: Create Client Secret In the registered app → Certificates & secrets → New client secret. Add description and expiry (e.g., 6 months or 12 months). Copy the Value immediately (you won’t see it again). Step 3: Assign API Permissions In the app → API permissions → Add a permission. Select: APIs my organisation uses → Search for WindowsDefenderATP. Choose: Machine.ReadWrite.All (required for tagging). Application permissions → Expand Machine → Select: Click Add permissions. Grant admin consent for your organisation. Step 4: Validate Permissions Ensure status shows Granted for . (as shown below) If not, click Grant admin consent again. Step 5: Use PowerShell Script to apply tags to multiple devices Please review the PowerShell script hosted here: Microsoft-Unified-Security-Operations-Platform/Microsoft Defender for Endpoint/AddBulkTags.ps1 at main · Abhishek-Sharan/Microsoft-Unified-Security-Operations-Platform This script: Fetches Bearer token using Client ID, Tenant ID, and Client Secret. Reads Device IDs from CSV. Applies tags to each device via Defender API. How to Run (I am using Azure Shell for demo) Update the script with: $TenantId, $ClientId, $ClientSecret and Tag Value Path to your CSV file containing DeviceId. Upload MachineIDs.csv in Azure Shell, template shown below (line 2 and 3 are DeviceIDs) Upload the PowerShell script in Azure Shell as well Execute the PowerShell script, read the Disclaimer and provide your consent for further execution if you’re comfortable As shown below, it will apply the tags. Step 6: Validate tags Go to Devices page and check if the tags are applied or not. Security Best Practices Rotate client secrets regularly. Restrict app permissions to only what’s needed. Store secrets securely (e.g., Azure Key Vault). By implementing this automated tagging workflow, organisations can significantly simplify device management within MDE. Regularly rotating client secrets, restricting app permissions, and securely storing credentials are recommended best practices to maintain a robust security posture. With PowerShell automation and API integration, bulk tagging becomes a scalable solution—enabling teams to efficiently update device tags and leverage exclusion lists, ultimately saving time and reducing operational overhead. Reference Documentation: Add or remove a tag for multiple machines - Microsoft Defender for Endpoint | Microsoft Learn
Solving Network Connectivity for MDE and MDI
Hi, I’m Will Sykes, a Senior Security Researcher in Microsoft IR. My colleagues and I specialize in helping customers with incident response and compromise recovery. In our work with customers who’ve been the victim of cyberattack, we often must solve connectivity issues to support tools in a hybrid cloud configuration. Hybrid Cloud Challenges In today’s IT world we’re now implementing and integrating services that leverage cloud computing components. Correctly securing this often defies the adage of “never allow internet connectivity to sensitive systems” and can pose challenges to security and systems administrators to find a solution. In this article we’re going to cover a potential solution to allow the communication traffic for Microsoft Defender for Endpoint (MDE) and Microsoft Defender for Identity (MDI) in a more secure manner, while simultaneously disallowing the operating system to reach the internet. MDE and MDI MDE and MDI are both cloud powered solutions that need to run on all assets (MDE) and Tier 0 assets (MDI). To function these products must be connected to Azure endpoints, however the number of endpoints (MDI, MDE) can be large. This poses a challenge to traditional firewalls that can’t do address-based filtering and rely on IP filtering. In addition, both services cannot function in an environment where SSL inspection is done on the traffic. Thankfully both solutions support a proxy server, and the greatest advantage here is that the proxy can be configured at the MDE/MDI application level and not at the operating system level. During an incident response (IR), Microsoft DART will often deploy MDE and MDI to support real time monitoring and automatic actions to evict threat actors. Depending on the current state of the organization it may not be possible to reconfigure existing firewalls or proxies to support the new configuration. Because of the rapid nature of an IR and the need to have clear consistent network communication data from our toolset we needed an “in a box” solution. The Proxy Solution Because it’s possible to configure MDE and MDI to use a proxy without relying on the system configuration we developed a preconfigured Squid proxy solution that can be deployed automatically via a shell script in a fully configured setup. Let’s look at the parts of this solution. Operating System and Software To use the proxy, you’ll need to create an Ubuntu Linux server. Any version greater than 18.04 will do, and this can be physical or virtual. You’ll need to size the machine based on your expected load; in our experience we’ve run tens of thousands of endpoints through a proxy with 4 CPU cores and 16 GB of memory. The automation script will enable the Uncomplicated Firewall (UFW) and allow ports 22 for SSH and 3128 for Squid. The Squid install is basic; the configuration and the tuning is done via the script. The deploy script will build an endpoint file at /etc/squid/mdemdi.conf which contains the list of required cloud endpoints for MDE and MDI. It then creates a squid configuration file at /etc/squid/squid.conf with some defaults and lockdowns: The hosts allowed to use the firewall are the RFC 1918 internal networks. This can be scoped down or reconfigured depending on your network needs. The only destinations allowed by the proxy are in the mdemdi.conf file, every other destination is denied and only HTTP/HTTPS is allowed. Lastly the script will add some operating system tuning to support deployments in large environments based on our IR experiences. Internal Network Configuration Once you have the proxy configured, you’ll need to ensure that it can connect outbound to the internet unfiltered. If you have SSL filtering enabled on the proxy this will still cause MDE and MDI to fail communications. The proxy is configured to deny all internet destinations not needed by MDE and MDI, so this is a compensating control to avoid having unfiltered internet access. Of course, you can also add the identical filters to the network security devices allowing the proxy outbound internet. The next configuration step is to allow your internal networks to communicate to the proxy on TCP 3128, which is the configured listener for Squid. Configuring MDE and MDI MDE and MDI Version 3 To configure MDE you can use Group Policy to either use the native template or to manage the underlying Windows registry values. The setting can be found at Administrative Templates > Windows Components > Microsoft Defender Antivirus > Define proxy server for connecting to the network. And at Administrative Templates > Windows Components > Data Collection and Preview Builds > Configure connected user experiences and telemetry If you need to configure devices not managed by Group Policy you can manage the following registry values: HKLM\Software\Policies\Microsoft\Windows Defender\ProxyServer This is a registry value of type REG_SZ and takes the following string format: http://<server name or IP>:<port> HKLM\Software\Policies\Microsoft\Windows\DataCollection\TelemetryProxyServer This is a registry value of type REG_SZ and takes the following string format: servername:port or ip:port That’s it! Once that’s done you can confirm connectivity in the Windows Event View in the Applications and Services Logs -> Microsoft -> Windows -> Windows Defender -> Operational log. MDI Version 2 MDI can be installed directly with the proxy, however this must be done on the command line and not through the GUI. To do this add the ProxyUrl=" http://<server name or IP>:<port>" option the installer parameters. If you’ve already installed MDI and need to reconfigure the proxy that’s perfectly fine! You can use the handy MDI PowerShell Module's Set-MDISensorProxyConfiguration cmdlet or the built in utility Microsoft.Tri.Sensor.Deployment.Deployer.exe. Conclusion Based on our experiences in incident response, connectivity issues can slow or block vital security tools. The proxy solution allows network administrators to utilize a pre-configured appliance type solution to support MDE and MDI without having to modify existing security rulesets. A systems administrator can simplify their deployment of MDE or MDI by including the proxy solution as part of the application bundle, where its lifecycle can be tracked in lockstep with the application. Now the moment you’ve all been waiting for! The script can be downloaded at https://github.com/mswillsykes/squidmdemdi. Disclaimer The sample scripts are not supported under any Microsoft standard support program or service. The sample scripts are provided AS IS without warranty of any kind. Microsoft further disclaims all implied warranties including, without limitation, any implied warranties of merchantability or of fitness for a particular purpose. The entire risk arising out of the use or performance of the sample scripts and documentation remains with you. In no event shall Microsoft, its authors, or anyone else involved in the creation, production, or delivery of the scripts be liable for any damages whatsoever (including, without limitation, damages for loss of business profits, business interruption, loss of business information, or other pecuniary loss) arising out of the use of or inability to use the sample scripts or documentation, even if Microsoft has been advised of the possibility of such damages.Update Entra ID Device Extension Attributes via PowerShell & Create Dynamic Security Groups.
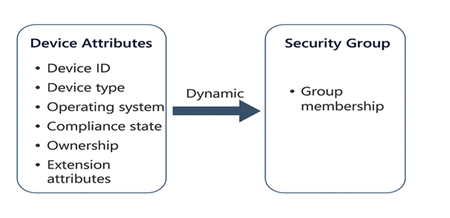
2) Overview of Extension Attributes and Updating via PowerShell What Are Extension Attributes? Extension attributes (1–15) are predefined string fields available on Entra ID device objects. They are exposed to Microsoft Graph as the extensionAttributes property. These attributes can store custom values like department, environment tags (e.g., Prod, Dev), or ownership details. Why Use Them? Dynamic Group Membership: Use extension attributes in membership rules for security or Microsoft 365 groups. Policy Targeting: Apply Defender for Endpoint (MDE) policies, Conditional Access or Intune policies to devices based on custom tags. For details on configuration of the policies refer below documentation links. https://learn.microsoft.com/en-us/defender-endpoint/manage-security-policies https://learn.microsoft.com/en-us/intune/intune-service/ https://learn.microsoft.com/en-us/entra/identity/conditional-access/ Updating Extension Attributes via PowerShell and Graph API Use Microsoft Graph PowerShell to authenticate and update device properties. Required permission: “Device.ReadWrite.All”. 3) Using PowerShell to Update Extension Attributes create app registration in Entra ID with permissions Device.ReadWriteall and Grant admin Consent. Register an app How to register an app in Microsoft Entra ID - Microsoft identity platform | Microsoft Learn Graph API permissions Reference. For updating Entra ID device properties you need “Device.ReadWrite.all” permission and Intune administrator role to run the script. Microsoft Graph permissions reference - Microsoft Graph | Microsoft Learn Below is the script Important things to note and update the script with your custom values. a) update the path of the excel file in the script. column header is 'DeviceName' Note: You may want to use CSV instead of excel file if Excel is not available on the admin workstation running this process. b) update the credential details - tenantId,clientId & clientSecret in the script. Client id and client secret are created as a part of app registration. c) update the Externsionattribute and value in the script. This is the value of the extension attribute you want to use in dynamic membership rule creation. ___________________________________________________________________________ #Acquire token $tenantId = "xxxxxxxxxxxxxxxxxxxxx" $clientId = "xxxxxxxxxxxxxxxx" $clientSecret = "xxxxxxxxxxxxxxxxxxxx" $excelFilePath = "C:\Temp\devices.xlsx" # Update with actual path $tokenResponse = Invoke-RestMethod -Uri "https://login.microsoftonline.com/ $tenantId/oauth2/v2.0/token" -Method POST -Body $tokenBody $accessToken = $tokenResponse.access_token # Import Excel module and read device names Import-Module ImportExcel $deviceList = Import-Excel -Path $excelFilePath foreach ($device in $deviceList) { $deviceName = $device.DeviceName # Assumes column header is 'DeviceName' Get device ID by name $headers = @{ "Authorization" = "Bearer $accessToken"} $deviceLookupUri = "https://graph.microsoft.com/beta/devices?`$filter=displayName eq '$deviceName'" try { $deviceResponse = Invoke-RestMethod -Uri $deviceLookupUri -Headers $headers -Method GET } catch { Write-Host "Error querying device: $deviceName - $_" continue } if ($null -eq $deviceResponse.value -or $deviceResponse.value.Count -eq 0) { Write-Host "Device not found: $deviceName" continue } $deviceId = $deviceResponse.value[0].id # Prepare PATCH request $uri = "https://graph.microsoft.com/beta/devices/$deviceId" $headers["Content-Type"] = "application/json" $body = @{ extensionAttributes = @{ extensionAttribute6 = "MDE" } } | ConvertTo-Json -Depth 3 try { $response = Invoke-RestMethod -Uri $uri -Method Patch -Headers $headers -Body $body Write-Host "Updated device: $deviceName"} catch { Write-Host "Failed to update device: $deviceName - $_" } } Write-Host "Script execution completed." ________________________________________________________________________________________________________________________ Here’s a simple summary of what the script does: Gets an access token from Microsoft Entra ID using the app’s tenant ID, client ID, and client secret (OAuth 2.0 client credentials flow). Reads an Excel file (update the path in $excelFilePath, and ensure the column header is DeviceName) to get a list of device names. Loops through each device name from the Excel file: Calls Microsoft Graph API to find the device ID by its display name. If the device is found, sends a PATCH request to Microsoft Graph to update extensionAttribute6 with the value "MDE". Logs the result for each device (success or failure) and prints messages to the console. 4) Using Extension Attributes in Dynamic Device Groups Once extension attributes are set, you can create a dynamic security group in Entra ID: Go to Microsoft Entra admin center → Groups → New group. Select Security as the group type and choose Dynamic Device membership. Add a membership rule, for example: (device.extensionAttributes.extensionAttribute6 -eq "MDE") 4. Save the group. Devices with extensionAttribute6 = MDE will automatically join. 5) Summary Extension attributes in Entra ID allow custom tagging of devices for automation and policy targeting. You can update these attributes using Microsoft Graph PowerShell. These attributes can be used in dynamic device group rules, enabling granular MDE policies, Conditional Access and Intune deployments. Disclaimer This script is provided "as-is" without any warranties or guarantees. It is intended for educational and informational purposes only. Microsoft and the author assume no responsibility for any issues that may arise from the use or misuse of this script. Before deploying in a production environment, thoroughly test the script in a controlled setting and review it for compliance with your organization's security and operational policies.Microsoft Defender for Endpoint (MDE) Live Response and Performance Script.
Importance of MDE Live Response and Scripts Live Response is crucial for incident response and forensic investigations. It enables analysts to: Collect evidence remotely. Run diagnostics without interrupting users. Remediate threats in real time. For more information on MDE Live Response visit the below documentation. Investigate entities on devices using live response in Microsoft Defender for Endpoint - Microsoft Defender for Endpoint | Microsoft Learn PowerShell scripts enhance this capability by automating tasks such as: Performance monitoring. Log collection. Configuration validation. This automation improves efficiency, consistency, and accuracy in security operations. For more details on running performance analyzer visit the below link. Performance analyzer for Microsoft Defender Antivirus - Microsoft Defender for Endpoint | Microsoft Learn While performance analyzer is run locally on the system to collect Microsoft Defender Anti-Virus performance details , in this document we are describing on running the performance analyzer from MDE Live Response console. This is a situation where Security administrators do not have access to the servers managed by Infra administrators. Prerequisites Required Roles and Permissions To use Live Response in Microsoft Defender for Endpoint (MDE), specific roles and permissions are necessary. The Security Administrator role, or an equivalent custom role, is typically required to enable Live Response within the portal. Users must possess the “Manage Portal Settings” permission to activate Live Response features. Permissions Needed for Live Response Actions Active Remediation Actions under Security Operations: Take response actions Approve or dismiss pending remediation actions Manage allowed/blocked lists for automation and indicators Unified Role-Based Access Control (URBAC): From 16/02/2025, new customers must use URBAC. Roles are assigned to Microsoft Entra groups. Access must be assigned to device groups for Live Response to function properly. Setup Requirements Enable Live Response: Navigate to Advanced Features in the Defender portal. Only users with the “Manage Portal Settings” permission can enable this feature. Supported Operating System Versions: Windows 10/11 (Version 1909 or later) Windows Server (2012 R2 with KB5005292, 2016 with KB5005292, 2019, 2022, 2025) macOS and Linux (specific minimum versions apply) Actual Script Details and Usage The following PowerShell script records Microsoft Defender performance for 60 seconds and saves the output to a temporary file: # Get the default temp folder for the current user $tempPath = [System.IO.Path]::GetTempPath() $outputFile = Join-Path -Path $tempPath -ChildPath "DefenderTrace.etl" $durationSeconds = 60 try { Write-Host "Starting Microsoft Defender performance recording for $durationSeconds seconds..." Write-Host "Recording will be saved to: $outputFile" # Start performance recording with duration New-MpPerformanceRecording -RecordTo $outputFile -Seconds $durationSeconds Write-Host "Recording completed. Output saved to $outputFile" } catch { Write-Host "Failed to start or complete performance recording: $_" } 🔧 Usage Notes: Run this script in an elevated PowerShell session. Ensure Defender is active, and the system supports performance recording. The output .etl file can be analyzed using performance tools like Windows Performance Analyzer. Steps to Initiate Live Response Session and Run the script. Below are the steps to initiate a Live Response session from Security.Microsoft.com portal. Below screenshot shows that console session is established. Then upload the script file to console library from your local system. Type “Library” to list the files. You can see that script got uploaded to Library. Now you execute the script by “run <file name>” command. Output of the script gets saved in the Library. Run “getfile <path of the file>” to get the file downloaded to your local system download folder. Then you can run Get-MpPerformanceReport command from your local system PowerShell as shown below to generate the report from the output file collected in above steps. Summary and Benefits This document outlines the use of MDE Live Response and PowerShell scripting for performance diagnostics. The provided script helps security teams monitor Defender performance efficiently. Similar scripts can be executed from Live Response console including signature updates , start/stop services etc. These scripts are required as a part of security investigation or MDE performance troubleshooting process. Benefits: Faster incident response through remote diagnostics. Improved visibility into endpoint behaviour. Automation of routine performance checks. Enhanced forensic capabilities with minimal user disruption.