log data
229 Topics
Cloudflare Log ingestion in Sentinel with CCF
Hi all, I built a connector to ingest cloudflare firewall logs using CCF. The reason why I had to build this custom one while the official one was available was because official one uses Logpush which is a service that is available only on Enterprise plan, so if you are on pro or business plan you can not use it. Putting it out here in case anyone wants to try. https://amankhan.net/posts/Cloudflare-CCF-Connector/114Views0likes0CommentsSentinel Foundry - MCP Server (Github Community Release)
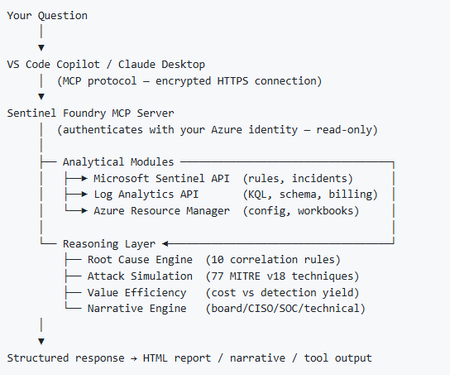
I’ve been cooking something that a lot of people in SOC have been struggling with — especially on the engineering side of Microsoft Sentinel. Thanks to the Microsoft Security team for shaping the capabilities of Sentinel even better with Sentinel Data Lake & Modern SecOps. Today’s the day I can finally share it. Note: This is not an official Microsoft product, but it is designed to make the Sentinel Build even better (complement) with much more intelligence. 🚀 Sentinel Foundry is now in public preview with 43 tools. (Sentinel Foundry - MCP Server) It’s an MCP server built to act like the brain of a strong Sentinel engineer — helping make building, improving, and operating Sentinel far more practical, faster, and honestly more enjoyable. For a lot of teams, the challenge is not understanding what Sentinel can do. The hard part is the engineering work around it: -> Deciding what data should actually be ingested -> Building a clean, scalable Sentinel foundation -> Writing useful detections instead of noisy ones -> Balancing security value with cost -> Turning ideas into deployable engineering outputs That is exactly why I built Sentinel Foundry to help communities grow stronger. It helps with the real engineering tasks behind Sentinel — from architecture thinking to detection design, deployment planning, ingestion strategy, automation ideas, and many of the workflows outlined in the GitHub project. How does it work? Here’s one of the flagship prompts I ran with it: “Give me a complete security posture report for our workspace. Score each pillar and tell me what to prioritise.” And within seconds, it produced a structured engineering blueprint that would normally take a lot longer to pull together manually. You can see the example prompts here in what it can do: https://github.com/prabhukiranveesam/Sentinel-Foundry#what-can-it-do I want building Sentinel to feel less like repetitive engineering overhead — and more like real security engineering that is fast, creative, and enjoyable. If you work with Sentinel as a SOC L2 analyst, engineer, detection engineer, consultant, or architect, I’d genuinely love for you to try it and tell me what you think. 🔗 Public Preview: https://github.com/prabhukiranveesam/Sentinel-Foundry This is just the start of an AI era — and I’m excited to keep shaping it with more powerful features over the coming days. This is very easy to set up and will be available to all of you at no cost during this month as part of the public preview, and your feedback is extremely valuable to shape this as a powerful solution.971Views0likes2Comments
Data Connectors Storage Account and Function App
Several data connectors downloaded via Content Hub has ARM deployment templates which is default OOB experience. If we need to customize we could however I wanted to ask community how do you go about addressing some of the infrastructure issues where these connectors deploy storage accounts with insecure configurations like infrastructure key requirement, vnet intergration, cmk, front door etc... Storage and Function Apps. It appears default configuration basically provisions all required services to get streams going but posture configuration seems to be dismissing security standards around hardening these services.289Views0likes1Comment
SentinelHealth: Scheduled Rule Retry Logging Does Not Match Docs
## Objective I am working on a health checks architecture for Microsoft Sentinel analytic rules. The goal is to build a set of monitoring queries/approaches that cover rule execution failures, configuration issues (entity mapping, partial success), rule audit tracking, and auto-disabled rule detection. ## My Current Approach So far I have built monitoring for the following areas using the SentinelHealth and SentinelAudit tables: - Scheduled rule window failures (retry exhaustion) - NRT rule execution delays (cumulative delay over 25 minutes) - Partial success and configuration issues (entity mapping drops, alert size limits, semantic errors) with transient error codes filtered out - Auto-disabled rules detection - Rule disable/delete audit tracking via SentinelAudit + AzActivity ## The Issue: Scheduled Rule Retry Logging The documentation at https://learn.microsoft.com/en-us/azure/sentinel/monitor-analytics-rule-integrity#scheduled-rules states that when a scheduled rule fails, it is retried 5 more times on the same window (6 total attempts). It also provides this query to detect completely skipped windows: ```kql _SentinelHealth() | where SentinelResourceType == @"Analytics Rule" | where SentinelResourceKind == "Scheduled" | where Status != "Success" | extend startTime = tostring(ExtendedProperties["QueryStartTimeUTC"]) | summarize failuresByStartTime = count() by startTime, SentinelResourceId | where failuresByStartTime == 6 | summarize count() by SentinelResourceId ``` This query assumes that each retry attempt is logged as a separate event in SentinelHealth, all sharing the same QueryStartTimeUTC. You would then count 6 failure records per startTime to identify a fully skipped window. However, in practice I am seeing different behavior. I ran a diagnostic query with a 90-day lookback (480 non-success events total, 73 unique rules). Every single event had a count of 1 per unique (SentinelResourceName, startTime) combination. No grouping of retries was observed at all. I then found an actual failed-window event that confirms this. Here is the record: - Rule: Port scan detected (ASIM Network Session schema) - Status: Failure - Description: "Rule's scheduled run at 06/01/2026 10:43:55 failed after numerous attempts. It will be re-executed over the next scheduled time." - Issue Code: SemanticErrorInQuery - Only 1 SentinelHealth record exists for this failed window The Description field says "failed after numerous attempts" which indicates the retries happened internally, but only one consolidated Failure event was written to SentinelHealth after all retries were exhausted. The individual retry attempts do not appear as separate records. This means the failuresByStartTime == 6 query from the documentation would never match this pattern, because there is only 1 record per failed window, not 6. ## Why This Matters Yes, completely skipped windows are rare. In my 90-day dataset most failures were permanent types (SemanticErrorInQuery, QueryGeneralError) that would not benefit from retries anyway. But they still happen, and if a tenant experiences a transient issue that causes a higher rate of failed windows, the documented query would silently return nothing. For my health checks I have rewritten the detection to simply look for Status == "Failure" with Description containing "failed after numerous attempts" which matches the actual consolidated event Sentinel writes. ## Questions Is the documented failuresByStartTime == 6 query still accurate? Or has the retry logging behavior changed to write a single consolidated event per failed window? Are there specific failure types or conditions where individual retries are logged as separate events? Perhaps transient failures behave differently from permanent ones in this regard? For anyone else building health monitoring on SentinelHealth - am I missing any important use cases beyond what I described above? Any clarification would be appreciated.269Views0likes1CommentSentinel - Defender for Cloud P2 Benefit
Hi all, To receive the the benefit of the Sentinel / Defender for Cloud P2 500mb benefit is the following correct: Enabled Defender for Cloud P2 on the server or via Azure Arc (these are mainly on-prem servers. Create a DCR rule to collect events and send to our Sentinel Workspace. Enable Defender on the Sentinel workspace (not subscription) Defender for Servers is far more work than it should be!231Views0likes2Comments
XdrLogRaider Defender XDR portal telemetry
A Microsoft Sentinel custom data connector that ingests Microsoft Defender XDR portal-only telemetry — configuration, compliance, drift, exposure, governance — that public Microsoft APIs (Graph Security, Microsoft 365 Defender, MDE) don't expose. https://github.com/akefallonitis/xdrlograider— Defender XDR portal telemetry Happy Hunting 🥳 🎉301Views0likes2CommentsUnderstand New Sentinel Pricing Model with Sentinel Data Lake Tier
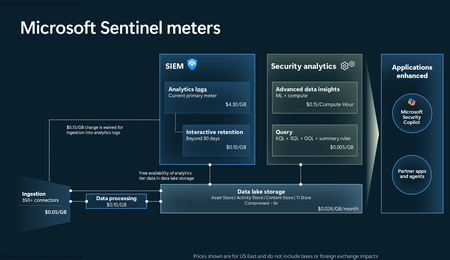
Introduction on Sentinel and its New Pricing Model Microsoft Sentinel is a cloud-native Security Information and Event Management (SIEM) and Security Orchestration, Automation, and Response (SOAR) platform that collects, analyzes, and correlates security data from across your environment to detect threats and automate response. Traditionally, Sentinel stored all ingested data in the Analytics tier (Log Analytics workspace), which is powerful but expensive for high-volume logs. To reduce cost and enable customers to retain all security data without compromise, Microsoft introduced a new dual-tier pricing model consisting of the Analytics tier and the Data Lake tier. The Analytics tier continues to support fast, real-time querying and analytics for core security scenarios, while the new Data Lake tier provides very low-cost storage for long-term retention and high-volume datasets. Customers can now choose where each data type lands—analytics for high-value detections and investigations, and data lake for large or archival types—allowing organizations to significantly lower cost while still retaining all their security data for analytics, compliance, and hunting. Please flow diagram depicts new sentinel pricing model: Now let's understand this new pricing model with below scenarios: Scenario 1A (PAY GO) Scenario 1B (Usage Commitment) Scenario 2 (Data Lake Tier Only) Scenario 1A (PAY GO) Requirement Suppose you need to ingest 10 GB of data per day, and you must retain that data for 2 years. However, you will only frequently use, query, and analyze the data for the first 6 months. Solution To optimize cost, you can ingest the data into the Analytics tier and retain it there for the first 6 months, where active querying and investigation happen. After that period, the remaining 18 months of retention can be shifted to the Data Lake tier, which provides low-cost storage for compliance and auditing needs. But you will be charged separately for data lake tier querying and analytics which depicted as Compute (D) in pricing flow diagram. Pricing Flow / Notes The first 10 GB/day ingested into the Analytics tier is free for 31 days under the Analytics logs plan. All data ingested into the Analytics tier is automatically mirrored to the Data Lake tier at no additional ingestion or retention cost. For the first 6 months, you pay only for Analytics tier ingestion and retention, excluding any free capacity. For the next 18 months, you pay only for Data Lake tier retention, which is significantly cheaper. Azure Pricing Calculator Equivalent Assuming no data is queried or analyzed during the 18-month Data Lake tier retention period: Although the Analytics tier retention is set to 6 months, the first 3 months of retention fall under the free retention limit, so retention charges apply only for the remaining 3 months of the analytics retention window. Azure pricing calculator will adjust accordingly. Scenario 1B (Usage Commitment) Now, suppose you are ingesting 100 GB per day. If you follow the same pay-as-you-go pricing model described above, your estimated cost would be approximately $15,204 per month. However, you can reduce this cost by choosing a Commitment Tier, where Analytics tier ingestion is billed at a discounted rate. Note that the discount applies only to Analytics tier ingestion—it does not apply to Analytics tier retention costs or to any Data Lake tier–related charges. Please refer to the pricing flow and the equivalent pricing calculator results shown below. Monthly cost savings: $15,204 – $11,184 = $4,020 per month Now the question is: What happens if your usage reaches 150 GB per day? Will the additional 50 GB be billed at the Pay-As-You-Go rate? No. The entire 150 GB/day will still be billed at the discounted rate associated with the 100 GB/day commitment tier bucket. Azure Pricing Calculator Equivalent (100 GB/ Day) Azure Pricing Calculator Equivalent (150 GB/ Day) Scenario 2 (Data Lake Tier Only) Requirement Suppose you need to store certain audit or compliance logs amounting to 10 GB per day. These logs are not used for querying, analytics, or investigations on a regular basis, but must be retained for 2 years as per your organization’s compliance or forensic policies. Solution Since these logs are not actively analyzed, you should avoid ingesting them into the Analytics tier, which is more expensive and optimized for active querying. Instead, send them directly to the Data Lake tier, where they can be retained cost-effectively for future audit, compliance, or forensic needs. Pricing Flow Because the data is ingested directly into the Data Lake tier, you pay both ingestion and retention costs there for the entire 2-year period. If, at any point in the future, you need to perform advanced analytics, querying, or search, you will incur additional compute charges, based on actual usage. Even with occasional compute charges, the cost remains significantly lower than storing the same data in the Analytics tier. Realized Savings Scenario Cost per Month Scenario 1: 10 GB/day in Analytics tier $1,520.40 Scenario 2: 10 GB/day directly into Data Lake tier $202.20 (without compute) $257.20 (with sample compute price) Savings with no compute activity: $1,520.40 – $202.20 = $1,318.20 per month Savings with some compute activity (sample value): $1,520.40 – $257.20 = $1,263.20 per month Azure calculator equivalent without compute Azure calculator equivalent with Sample Compute Conclusion The combination of the Analytics tier and the Data Lake tier in Microsoft Sentinel enables organizations to optimize cost based on how their security data is used. High-value logs that require frequent querying, real-time analytics, and investigation can be stored in the Analytics tier, which provides powerful search performance and built-in detection capabilities. At the same time, large-volume or infrequently accessed logs—such as audit, compliance, or long-term retention data—can be directed to the Data Lake tier, which offers dramatically lower storage and ingestion costs. Because all Analytics tier data is automatically mirrored to the Data Lake tier at no extra cost, customers can use the Analytics tier only for the period they actively query data, and rely on the Data Lake tier for the remaining retention. This tiered model allows different scenarios—active investigation, archival storage, compliance retention, or large-scale telemetry ingestion—to be handled at the most cost-effective layer, ultimately delivering substantial savings without sacrificing visibility, retention, or future analytical capabilities.Solved3.5KViews2likes6CommentsCrowdStrike API Data Connector (via Codeless Connector Framework) (Preview)
API scopes created. Added to Connector however only streams observed are from Alerts and Hosts. Detections is not logging? Anyone experiencing this issue? Github has post about it apears to be escalated for feature request. CrowdStrikeDetections. not ingested Anyone have this setup and working?831Views0likes2Comments
Missing details in Azure Activity Logs – MICROSOFT.SECURITYINSIGHTS/ENTITIES/ACTION
The Azure Activity Logs are crucial for tracking access and actions within Sentinel. However, I’m encountering a significant lack of documentation and clarity regarding some specific operation types. Resources consulted: https://learn.microsoft.com/en-us/azure/sentinel/audit-sentinel-data https://learn.microsoft.com/en-us/rest/api/securityinsights/entities?view=rest-securityinsights-2024-01-01-preview https://learn.microsoft.com/en-us/rest/api/securityinsights/operations/list?view=rest-securityinsights-2024-09-01&tabs=HTTP My issue: I observed unauthorized activity on our Sentinel workspace. The Azure Activity Logs clearly indicate the user involved, the resource, and the operation type: "MICROSOFT.SECURITYINSIGHTS/ENTITIES/ACTION" But that’s it. No detail about what the action was, what entity it targeted, or how it was triggered. This makes auditing extremely difficult. It's clear the person was in Sentinel and perform an activity through it, from search, KQL, logs to find an entity from a KQL query. But, that's all... Strangely, this operation is not even listed in the official Sentinel Operations documentation linked above. My question: Has anyone encountered this and found a way to interpret this operation type properly? Any insight into how to retrieve more meaningful details (action context, target entity, etc.) from these events would be greatly appreciated.498Views0likes3Comments