finops toolkit
41 Topics
Reservation exchanges for Azure services covered by savings plans end starting Feb. 1, 2027
Starting February 1, 2027, Azure reservation exchanges will no longer be available for services covered by savings plans. This change aligns reservation exchange policy with the flexibility already offered by savings plans, and it gives you a clear, predictable framework for choosing the right commitment-based discount for each workload. This post walks through what's changing, who's affected, what stays the same, and the actions you can take today to plan ahead. What's changing If a service supports Azure savings plans, the corresponding reservation for that service will no longer support exchanges as of February 1, 2027. This change excludes products or services that are deprecated and approaching end of life, as well as cloud environments that don't currently support savings plans. The policy is forward-looking, as savings plan coverage expands, reservations for those services will follow the same policy and will not support exchanges. Affected services At the time of this announcement, the change applies to reservations for the following services: Compute services Azure Virtual Machines — including exchanges between non-premium and premium storage Azure Dedicated Host Azure App Service Database services Azure Database for PostgreSQL Azure Database for MySQL Azure DocumentDB Azure Cosmos DB Azure SQL Database Azure SQL Managed Instance Important details to plan around One final exchange. Each active reservation for an impacted service, purchased before February 1, 2027, will retain the right to one final exchange after that date. Plan how and when you want to use it. New purchases. Reservations for impacted services purchased on or after February 1, 2027, will not support exchanges. Expanding scope. As savings plan eligibility grows, additional services will automatically fall under this policy. What's not changing Reservations remain the right choice for predictable, stable workloads, and you can continue to purchase them. Specifically: Instance size flexibility for virtual machines is not impacted by this change. The reservation cancellation policy is not impacted by this change. Recommended action If you need flexibility across services and regions, consider evaluating savings plans as a discount option for dynamic and evolving workloads. Savings plans can help provide cost savings on consistent spend across compute and database services, regardless of region. You can also trade in your existing reservations for a savings plan. Alternatively, reservations remain the appropriate option for predictable, stable workloads, and you can continue to purchase them. To compare your options, see decide between a savings plan and a reservation. Frequently Asked Questions What is changing? Starting February 1, 2027, Azure reservation exchanges will no longer be available for services covered by Azure savings plans. Reservations for these services will continue to be available for purchase and renewal. Which services are affected? At the time of this announcement, the policy applies to reservations for: Compute services Azure Virtual Machines (including exchanges between non-premium and premium storage) Azure Dedicated Host Azure App Service Database services Azure Database for PostgreSQL Azure Database for MySQL Azure DocumentDB Azure Cosmos DB Azure SQL Database Azure SQL Managed Instance As Azure savings plan coverage expands, additional savings plan-eligible services may become subject to this policy. Does this apply to all Azure cloud environments? No. This change applies only to cloud environments where Azure savings plans are available. Can I still exchange reservations before February 1, 2027? Yes. Reservation exchanges will continue to be available under the current policy until February 1, 2027. Does this affect reservations I already own? Active reservations for impacted services purchased before February 1, 2027, will retain the right to one final exchange after that date. What happens after I use my final exchange? Once the final exchange is used, the resulting reservation cannot be exchanged again. Can I still purchase or renew reservations? Yes. Reservations remain available and continue to be a valuable option for stable, predictable workloads. Is Azure retiring reservations? No. Reservations remain an important commitment-based discount offering. This change affects exchangeability only. What is not changing? The following capabilities remain available: VM instance size flexibility Reservation cancellations under existing policies Reservation-to-savings-plan trade-in Reservation purchases and renewals When should I choose a savings plan instead of a reservation? Review our guidance on how to decide between a savings plan and a reservation. What should I do before February 1, 2027? Review your reservation portfolio, evaluate future flexibility needs, consider Azure savings plans where appropriate, and plan how you want to use the one final exchange available to eligible active reservations. Where can I learn more? For more information, see: Changes to the Azure reservation exchange policy Exchanges and refunds for Azure reservations Trade in reservations for a savings plan Azure savings plans Decide between a savings plan and a reservation. Policy details are subject to change and may vary based on service eligibility and contractual terms.3KViews0likes0CommentsRight‑sizing Azure Savings Plans, one hour at a time
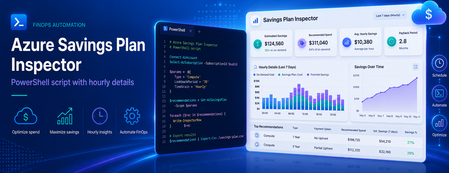
Most of us have, at some point, sized a commitment the same way we order food for a team offsite: estimate, round up, and hope nobody complains. It works for pizza. It is a less robust strategy for a three‑year Savings Plan. Azure Cost Management already produces commitment recommendations for you, and they are a great starting point. But the headline dollar figure on the portal hides the most useful signal a FinOps team can get its hands on: the hourly Pay‑As‑You‑Go (PAYG) usage that the recommendation engine actually looked at. Once you have that signal in a spreadsheet, "right‑sized" stops being a vibe and starts being a number you can defend in a steering meeting. This post walks through how to pull that data out of the Cost Management REST API, and shares a small companion PowerShell script that does the heavy lifting and produces analyst‑friendly CSV and Markdown outputs. Why a single recommended number isn't enough A Savings Plan recommendation is, at its core, an optimisation against a distribution of hourly compute spend over a lookback window. The portal typically surfaces the single commitment level that maximises savings under a "reasonable utilisation" assumption. That's a sensible default, but it answers only one question. The questions FinOps practitioners also want to answer include: What does my PAYG demand actually look like hour‑by‑hour? Smooth and predictable, or spiky and seasonal? How does coverage and savings change if I commit a bit less, or a bit more? Will the recommended commitment leave me with wastage on weekends or overnight? Can I correlate the hourly profile with maintenance windows, batch jobs, or business hours? You cannot answer those questions with a single dollar figure. You can answer all of them with the hourly series and the alternative commitment levels — and the API exposes both. What the Benefit Recommendations API gives you The endpoint is the Benefit Recommendations - List operation (api-version=2025-03-01). Pointed at any of the supported scopes — Billing Account (EA), Billing Profile (MCA), Subscription, or Resource Group — it returns one or more recommendations for the chosen lookBackPeriod (Last7Days, Last30Days, Last60Days) and term (P1Y, P3Y). The two $expand options are where the magic lives: $expand=properties/allRecommendationDetails returns an array of alternative commitment levels (AllSavingsBenefitDetails). Each entry includes commitmentAmount, coveragePercentage, benefitCost, overageCost, savingsAmount, savingsPercentage, wastageCost, and averageUtilizationPercentage. $expand=properties/usage returns the hourly PAYG charge series (usage.charges) that the engine used. Combined with properties.firstConsumptionDate and properties.lastConsumptionDate, you get a complete time‑aligned view of demand. Both expansions are cheap and worth requesting every time. They turn a single recommendation into a small, complete data product. Meet the script: Export-BenefitRecommendations.ps1 To make this useful in five minutes rather than an afternoon, there is a PowerShell script on GitHub that wraps the API call and produces ready‑to‑use artifacts. It is interactive, so there is nothing to memorise: === Azure Benefit Recommendations Export === Select billing scope kind: * [1] Billing Account (EA) [2] Billing Profile (MCA) [3] Subscription [4] Resource Group Enter choice 1-4 (default 1): 1 Billing Account ID: <your-EA-billing-account-id> Select lookback period: [1] Last7Days * [2] Last30Days [3] Last60Days Enter choice 1-3 (default 2): 3 Select term: * [1] P1Y [2] P3Y Enter choice 1-2 (default 1): 2 ... Retrieved 1 recommendation(s). It authenticates via the Az.Accounts module, always requests both $expand options, follows nextLink pagination, verifies API access up front (translating 401/403/404 into actionable hints), and writes four files using a predictable name pattern: yyyy-MM-dd-<scope>-<lookback>-<term>-AllRecommendationDetails.csv — one row per commitment alternative, ready for pivot tables. yyyy-MM-dd-<scope>-<lookback>-<term>-TopRecommendation.md — a Markdown brief on the top recommendation, including the recommended commitment row and the full alternatives table. yyyy-MM-dd-<scope>-<lookback>-<term>-HourlyUsage.csv — hour‑by‑hour PAYG usage for the top recommendation, aligned to the API's actual data window (no padding, no trailing blanks). yyyy-MM-dd-<scope>-<lookback>-<term>-Raw.json — optional full response dump, for archival or downstream tooling. The naming convention is intentional: paste a folder of these into Power BI and the dates, scopes, and terms are already in the filename. A worked example Here is a real shape from a sample Last60Days / P3Y export against an EA billing account. The AllRecommendationDetails CSV gives us four commitment alternatives: averageUtilizationPercentage,coveragePercentage,commitmentAmount,overageCost,benefitCost,savingsAmount,savingsPercentage,totalCost,wastageCost 100.000,28.868,4.124,30914.280,5889.072,6656.889,15.317,36803.352,0.000 100.000,39.168,5.848,26437.791,8350.944,8671.506,19.953,34788.735,0.000 9.984,97.883,16.359,919.948,23360.652,19179.641,44.131,24280.600,3.767 98.684,98.900,16.806,477.956,23998.968,18983.317,43.680,24476.924,315.907 Read those rows like an interactive lever: Commit $4.124/hr → 28.9% coverage, 15.3% savings, zero wastage. Safe, but most of your spend is still PAYG. Commit $5.848/hr → 39.2% coverage, 19.9% savings. Still safe, still conservative. Commit $16.359/hr → 97.9% coverage, 44.1% savings, ~$3.77 of wastage. This is the sweet spot the engine flags as recommended. Commit $16.806/hr → 98.9% coverage, 43.7% savings, but wastage jumps to $315.9 over the window. You bought more coverage and the engine charged you for it. The hourly CSV is what makes the recommendation defensible. It contains 1,428 rows — one per hour from 2026-04-11T00:00 through 2026-06-09T11:00 (the API's reported data range, not "now minus 60 days"): DateTime,HourlyPayGoUsage 2026-04-11T00:00,29.5350191832771 2026-04-11T01:00,29.566694701744 ... 2026-06-09T11:00,32.7312920192344 Drop that into Excel or Power BI, lay a horizontal line at the recommended commitmentAmount ($16.359/hr), and you immediately see how often demand sits above the line (covered by PAYG overage) versus below it (where the commitment is technically idle but, given the savings rate, still net‑positive). You can also slice by hour‑of‑day to spot weekend troughs or batch‑job spikes that change how you interpret "average utilisation." Try it yourself The script and full documentation live at github.com/DirkBrinkmann/azure-savingsplan-insights. Quickstart: git clone https://github.com/DirkBrinkmann/azure-savingsplan-insights.git cd azure-savingsplan-insights Install-Module Az.Accounts -Scope CurrentUser # if you don't already have it #Connect to Azure Connect-AzAccount #Run the script .\Export-BenefitRecommendations.ps1 You will need read permission on the scope you target — Cost Management Reader on a subscription, or Billing Reader at the billing account / billing profile level, is enough. Give it a spin against your own scope and tell us how it goes. The repo at github.com/DirkBrinkmann/azure-savingsplan-insights has Issues and Discussions enabled — bug reports, edge cases ("my response shape looks different"), feature ideas, and "I plotted this in Power BI and learned X" stories are all welcome. The script will only get better with real‑world data behind it, and yours is the kind we want to hear about. Closing nudge In FinOps terms, this is squarely an Inform phase activity: turning a black‑box recommendation into a transparent dataset your team can challenge, chart, and align on. The API has had this data all along; the script just makes it boring to extract — which is exactly what you want a FinOps tool to be. Pull a Last60Days / P3Y export for your top‑spending scope, plot the hourly line, and decide your next Savings Plan with a number you can point to. Your future self (and your finance partner) will thank you.1KViews2likes2CommentsWhat's new in FinOps toolkit 14 – April 2026
FinOps toolkit 14 is here: Copilot Studio agent template for your FinOps hub instance, Azure Advisor and customer cost recommendations, a simpler deployment UI, and a preview of commitment discount eligibility data for reservation and savings plan planning, just to name a few!1.8KViews1like0CommentsWhat’s new in FinOps toolkit 13 – January 2026
FinOps toolkit 13 focuses on stability and usability improvements across FinOps hubs, Power BI reports, and Azure Optimization Engine with a few key additions, like configuring Key Vault purge protection when deploying FinOps hubs and support for format and compression when creating Cost Management exports via PowerShell. Read on for details.1.4KViews2likes0CommentsWhat’s new in FinOps toolkit 12 – July 2025
This month, you’ll find support for FOCUS 1.2, autostart in FinOps hubs which can reduce your hub costs, a new page in the Cost summary Power BI report, and various small fixes, improvements, and documentation updates across the board. Read on for details.1.4KViews3likes5CommentsNews and updates from FinOps X 2025: Transforming FinOps in the era of AI
AI is central to nearly every corner of business and technology. It's no surprise that FinOps X 2025 was loaded with news about how AI is changing everything. Learn about how FinOps tools and solutions are evolving in the era of AI!1.6KViews0likes0Comments
A practitioner's guide to accelerating FinOps with GitHub Copilot and FinOps hubs
ℹ️ Quick implementation overview Setup time: ~30 minutes for basic configuration Target audience: FinOps practitioners, finance teams, engineering managers Prerequisites: Azure subscription with FinOps hubs deployed, VS Code, GitHub Copilot Key enabler: FinOps Hub Copilot v0.11 release Key benefits 🎯 Democratized analytics Non-technical team members can perform advanced cost analysis without KQL expertise. ⚡ Faster insights Natural language eliminates query writing overhead and accelerates time-to-insights. 📋 FinOps Framework alignment All queries map directly to validated FinOps Framework capabilities. 🔒 Enterprise ready Built on proven FinOps hub data foundation with security and governance controls. FinOps practitioners face a common challenge: bridging the gap between complex cost data and actionable business insights. While FinOps hubs provide a comprehensive, analytics-ready foundation aligned with the FinOps Framework, accessing and analyzing this data traditionally requires deep technical expertise in KQL and schema knowledge. This guide demonstrates how to perform sophisticated cost analysis using natural language queries using GitHub Copilot in VS Code connected to FinOps hubs 0.11 via the Azure MCP server. This approach democratizes advanced analytics across FinOps teams, supporting faster decision-making and broader organizational adoption of FinOps practices. ℹ️ Understanding the technology stack The Model Context Protocol (MCP) is an open standard that enables AI agents to securely connect to external data sources and tools. The Azure MCP server is Microsoft's implementation that provides this connectivity specifically for Azure resources, while GitHub Copilot acts as the AI agent that translates your natural language questions into the appropriate technical queries. Understanding the foundation: FinOps hubs and natural language integration FinOps hubs serve as the centralized data platform for cloud cost management, providing unified cost and usage data across clouds, accounts, and tenants. The integration with GitHub Copilot through the Azure MCP server introduces a natural language interface that maps practitioner questions directly to validated KQL queries, eliminating the technical barrier that often limits FinOps analysis to specialized team members. Note: The FinOps toolkit also includes Power BI reports, workbooks, alerts, and an optimization engine for advanced analytics and automation. See the FinOps toolkit overview for the full set of capabilities. Key capabilities and technical foundation ℹ️ About the FinOps toolkit ecosystem The FinOps toolkit also includes Power BI reports, workbooks, and an optimization engine for advanced analytics and automation. See the FinOps toolkit overview for the full set of capabilities. FinOps hubs provide several critical capabilities that enable practitioner success: 📊 Data foundation Centralized cost and usage data across multiple cloud providers, billing accounts, and organizational units Native alignment with the FinOps Framework domains and FOCUS specification Analytics-ready data model optimized for performance at scale without complexity overhead 🔗 Integration capabilities Multiple access patterns: Power BI integration, Microsoft Fabric compatibility, and direct KQL access for advanced scenarios Natural language query interface through Azure MCP server integration with Copilot ⚙️ Technical architecture The Azure MCP server acts as the translation layer, implementing the open Model Context Protocol to enable secure communication between AI agents (like GitHub Copilot) and Azure resources. For FinOps scenarios, it specifically provides natural language access to Azure Data Explorer databases containing FinOps hubs data, converting practitioner questions into validated KQL queries while maintaining enterprise authentication and security standards. Mapping FinOps Framework capabilities to natural language queries The integration supports the complete spectrum of FinOps Framework capabilities through natural language interfaces. Each query type maps to specific Framework domains and validated analytical patterns: 💡 Quick reference Each prompt category leverages pre-validated queries from the FinOps hubs query catalog, ensuring consistent, accurate results across different practitioners and use cases. 🔍 Understand phase capabilities Capability Natural language example Business value Cost allocation and accountability "Show me cost allocation by team for Q1" Instant breakdown supporting chargeback discussions Anomaly detection and management "Find any cost anomalies in the last 30 days" Proactive identification of budget risks Reporting and analytics "What are our top resource types by spend?" Data-driven optimization focus areas ⚡ Optimize phase capabilities Capability Natural language example Business value Rate optimization "How much did we save with reservations last month?" Quantification of commitment discount value Workload optimization "Show me underutilized resources" Resource efficiency identification Governance enforcement "Show me resources without proper tags" Policy compliance gaps 📈 Operate phase capabilities Capability Natural language example Business value Forecasting and planning "Forecast next quarter's cloud costs" Proactive budget planning support Performance tracking "Show month-over-month cost trends" Operational efficiency measurement Business value quantification "Calculate our effective savings rate" ROI demonstration for stakeholders Practical implementation: Real-world scenarios and results The following examples demonstrate how natural language queries translate to actionable FinOps insights. Each scenario includes the business context, Framework alignment, query approach, and interpretable results to illustrate the practical value of this integration. ℹ️ Sample data notation All cost figures, dates, and resource names in the following examples are illustrative and provided for demonstration purposes. Actual results will vary based on your organization's Azure usage, billing structure, and FinOps hub configuration. Effective cost allocation and accountability FinOps Framework alignment Domain: Understand usage and cost Capabilities: Allocation, Reporting and analytics Business context Finance teams require accurate cost allocation data to support budget planning and accountability discussions across organizational units. Natural language query What are the top resource groups by cost last month? Query results and business impact The natural language prompt maps to a validated allocation query that aggregates effective cost by resource group, providing the foundational data for chargeback and showback processes. Resource group Effective cost haven $36,972.85 leap $15,613.96 ahbtest $6,824.54 vnet-hub-001 $1,560.13 ... ... 🎯 Key takeaway Natural language queries eliminate the need for complex KQL knowledge while maintaining data accuracy. Finance teams can now perform sophisticated cost allocation analysis without technical barriers. Learn more: Introduction to cost allocation Proactive cost anomaly detection and management FinOps Framework alignment Domain: Understand usage and cost Capabilities: Anomaly management, Reporting and analytics Business context Proactive anomaly detection enables rapid response to unexpected cost changes, supporting budget adherence and operational efficiency. Natural language query Are there any unusual cost spikes or anomalies in the last 12 months? Query results and business impact The system applies time series analysis to identify significant cost deviations, automatically calculating percentage changes and flagging potential anomalies for investigation. Date Daily cost % change vs previous day 2025-06-03 $971.36 -59.54% 2025-06-01 $2,370.16 -4.38% 2025-04-30 $2,302.10 -5.56% 2025-04-02 $2,458.45 +5.79% ... ... ... ⚠️ Warning: Analysis insight The 59% cost reduction on June 3rd indicates a significant operational change, such as workload migration or resource decommissioning, requiring validation to ensure expected behavior. 🎯 Key takeaway Automated anomaly detection enables proactive cost management by identifying unusual spending patterns before they impact budgets, supporting rapid response to operational changes. Learn more: Anomaly management Accurate financial forecasting and budget planning FinOps Framework alignment Domain: Quantify business value Capabilities: Forecasting, Planning and estimating Business context Accurate financial forecasting supports budget planning processes and enables proactive capacity and cost management decisions. Natural language query Forecast total cloud cost for the next 90 days based on the last 12 months. Query results and business impact The forecasting algorithm analyzes historical spending patterns and applies trend analysis to project future costs, providing both daily estimates and aggregate totals for planning purposes. Date Forecasted cost 2025-06-04 $2,401.61 2025-07-01 $2,401.61 2025-08-01 $2,401.61 2025-09-01 $2,401.61 ... ... Total forecasted 90-day spend: $216,145.24 🎯 Key takeaway Natural language forecasting queries provide accurate financial projections based on validated historical analysis, enabling confident budget planning without requiring data science expertise. Learn more: Forecasting Reporting and analytics capabilities FinOps Framework alignment Domain: Understand usage and cost Capabilities: Reporting and analytics Business context Executive reporting requires consistent, reliable cost trend analysis to support strategic decision-making and budget performance tracking. Natural language query Show monthly billed and effective cost trends for the last 12 months. Query results and business impact Month Billed cost Effective cost 2024-06 $46,066.39 $46,773.85 2024-07 $72,951.41 $74,004.08 2024-08 $73,300.31 $74,401.81 2024-09 $71,886.30 $72,951.26 ... ... ... Learn more: Reporting and analytics Resource optimization analysis FinOps Framework alignment Domain: Optimize usage and cost Capabilities: Workload optimization, Reporting and analytics Business context Prioritizing optimization efforts requires understanding which resource types drive the most cost, enabling focused improvement initiatives with maximum business impact. Natural language query What are the top resource types by cost last month? Query results and business impact Resource type Effective cost Fabric Capacity $34,283.52 Virtual machine scale set $15,155.59 SQL database $2,582.99 Virtual machine $2,484.34 ... ... Learn more: Workload optimization Implementation methodology This section provides a systematic approach to implementing natural language FinOps analysis using the technical foundation established above. Prerequisites and environment validation Before proceeding with implementation, ensure you have: ✅ Azure subscription with appropriate FinOps hub deployment permissions ✅ Node.js runtime environment (required by Azure MCP Server) ✅ Visual Studio Code with GitHub Copilot extension ✅ Azure CLI, Azure PowerShell, or Azure Developer CLI authentication configured Access validation methodology Step 1: Verify FinOps hub deployment Confirm hub deployment status and data ingestion through the FinOps hubs setup guide Step 2: Validate database access Test connectivity to the hub database using Azure Data Explorer web application or Azure portal Step 3: Confirm schema availability Verify core functions (Costs, Prices) and databases (Hub, Ingestion) are accessible with current data Expected Database Structure Hub database: Public-facing functions including Costs, Prices, and version-specific functions (e.g., Costs_v1_0) Ingestion database: Raw data tables, configuration settings (HubSettings, HubScopes), and open data tables (PricingUnits) FOCUS-aligned data: All datasets conform to FinOps Open Cost and Usage Specification standards Learn more: FinOps hubs template details Azure MCP server configuration ℹ️ What is Azure MCP Server? The Azure Model Context Protocol (MCP) server is a Microsoft-provided implementation that enables AI agents and clients to interact with Azure resources through natural language commands. It implements the open Model Context Protocol standard to provide secure, structured access to Azure services including Azure Data Explorer (FinOps hub databases). Key capabilities and service support The Azure MCP server provides comprehensive Azure service integration, particularly relevant for FinOps analysis: 🔍 FinOps-relevant services Azure Data Explorer: Execute KQL queries against FinOps hub databases Azure Monitor: Query logs and metrics for cost analysis Resource groups: List and analyze organizational cost structures Subscription management: Access subscription-level cost data 🔧 Additional Azure services Azure Storage, Cosmos DB, Key Vault, Service Bus, and 10+ other services Full list available in the Azure MCP Server tools documentation Installation methodology The Azure MCP Server is available as an NPM package and VS Code extension. For FinOps scenarios, we recommend the VS Code extension approach for seamless integration with GitHub Copilot. Option 1: VS Code extension (recommended) Install the Azure MCP server extension from VS Code Marketplace The extension automatically configures the server in your VS Code settings Open GitHub Copilot and activate Agent Mode to access Azure tools Option 2: Manual configuration Add the following to your MCP client configuration: { "servers": { "Azure MCP Server": { "command": "npx", "args": ["-y", "@azure/mcp@latest", "server", "start"] } } } Authentication requirements Azure MCP Server uses Entra ID through the Azure Identity library, following Azure authentication best practices. It supports: Azure CLI: az login (recommended for development) Azure PowerShell: Connect-AzAccount Azure Developer CLI: azd auth login Managed identity: For production deployments The server uses DefaultAzureCredential and automatically discovers the best available authentication method for your environment. Technical validation steps Step 1: Authentication verification Confirm successful login to supported Azure tools Step 2: Resource discovery Validate MCP Server can access your Azure subscription and FinOps hub resources Step 3: Database connectivity Test query execution against FinOps hub databases Integration with development environment VS Code configuration requirements: GitHub Copilot extension with Agent Mode capability Azure MCP Server installation and configuration FinOps hubs copilot instructions and configuration files The FinOps Hub Copilot v0.11 release provides pre-configured GitHub Copilot instructions specifically tuned for FinOps analysis. This release includes: AI agent instructions optimized for FinOps Framework capabilities GitHub Copilot configuration files for VS Code Agent Mode Validated query patterns mapped to common FinOps scenarios Azure MCP Server integration guides for connecting to FinOps hub data Verification methodology: Open Copilot Chat interface (Ctrl+Shift+I / Cmd+Shift+I) Activate Agent Mode and select tools icon to verify Azure MCP Server availability Execute connectivity test: "What Azure resources do I have access to?" Expected response validation: Successful authentication confirmation Azure subscription and resource enumeration FinOps hub database connectivity status Progressive query validation Foundational test queries: Complexity level Validation query Expected behavior Basic "Show me total cost for last month" Single aggregate value with currency formatting Intermediate "What are my top 10 resource groups by cost?" Tabular results with proper ranking Advanced "Find any costs over $1000 in the last week" Filtered results with anomaly identification Query execution validation: KQL translation accuracy against FinOps hub schema Result set formatting and data type handling Error handling and user feedback mechanisms Operational best practices for enterprise implementation Query optimization and performance considerations Data volume management: Implement temporal filtering to prevent timeout scenarios (Azure Data Explorer 64MB result limit) Use summarization functions for large datasets rather than detailed row-level analysis Apply resource-level filters when analyzing specific environments or subscriptions Schema consistency validation: Reference the FinOps hub database guide for authoritative column definitions Verify data freshness through ingestion timestamp validation Validate currency normalization across multi-subscription environments Query pattern optimization: Leverage the FinOps hub query catalog for validated analytical patterns Customize costs-enriched-base query foundation for organization-specific requirements Implement proper time zone handling for global operational environments Security and access management Authentication patterns: Utilize Azure CLI integrated authentication for development environments Implement service principal authentication for production automation scenarios Maintain principle of least privilege for database access permissions Data governance considerations: Ensure compliance with organizational data classification policies Implement appropriate logging for cost analysis queries and results Validate that natural language prompts don't inadvertently expose sensitive financial data Comprehensive query patterns by analytical domain The following reference provides validated natural language prompts mapped to specific FinOps Framework capabilities and proven KQL implementations. Technical note: Each pattern references validated queries from the FinOps hub query catalog. Verify schema compatibility using the FinOps hub database guide before implementation. Cost visibility and allocation patterns Analytical requirement FinOps Framework alignment Validated natural language query Executive cost trend reporting Reporting and analytics "Show monthly billed and effective cost trends for the last 12 months." Resource group cost ranking Allocation "What are the top resource groups by cost last month?" Quarterly financial reporting Allocation / Reporting and analytics "Show quarterly cost by resource group for the last 3 quarters." Service-level cost analysis Reporting and analytics "Which Azure services drove the most cost last month?" Organizational cost allocation Allocation / Reporting and analytics "Show cost allocation by team and product for last quarter." Optimization and efficiency patterns Analytical requirement FinOps Framework alignment Validated natural language query Resource optimization prioritization Workload optimization "What are the top resource types by cost last month?" Commitment discount analysis Rate optimization "Show reservation recommendations and break-even analysis for our environment." Underutilized resource identification Workload optimization "Find resources with low utilization that could be optimized or decommissioned." Savings plan effectiveness Rate optimization "How much did we save with savings plans compared to pay-as-you-go pricing?" Tag compliance monitoring Data ingestion "Show me resources without required cost center tags." Anomaly detection and monitoring patterns Analytical requirement FinOps Framework alignment Validated natural language query Cost spike identification Anomaly management "Find any unusual cost spikes or anomalies in the last 30 days." Budget variance analysis Budgeting "Show actual vs. budgeted costs by resource group this quarter." Trending analysis Reporting and analytics "Identify resources with consistently increasing costs over the last 6 months." Threshold monitoring Anomaly management "Alert me to any single resources costing more than $5,000 monthly." Governance and compliance patterns Analytical Requirement FinOps Framework Alignment Validated Natural Language Query Policy compliance validation Policy and governance "Show resources that don't comply with our tagging policies." Approved service usage Policy and governance "List any non-approved services being used across our subscriptions." Regional compliance monitoring Policy and governance "Verify all resources are deployed in approved regions only." Cost center accountability Invoicing and chargeback "Generate chargeback reports by cost center for last quarter." Key takeaway: These validated query patterns provide a comprehensive foundation for FinOps analysis across all Framework capabilities. Use them as templates and customize for your organization's specific requirements. Troubleshooting and optimization guidance Common query performance issues ⚠️ Warning: Performance considerations Azure Data Explorer has a 64MB result limit by default. Proper query optimization avoids timeouts and ensures reliable performance. If using Power BI, use DirectQuery to connect to your data. Large dataset timeouts Symptom: Queries failing with timeout errors on large datasets Solution: Add temporal filters ✅ Recommended: "Show costs for last 30 days" ❌ Avoid: "Show all costs" Framework alignment: Data ingestion Memory limit exceptions Symptom: Exceeding Azure Data Explorer 64MB result limit Solution: Use aggregation functions ✅ Recommended: "Summarize costs by month" ❌ Avoid: Daily granular data for large time periods Best practice: Implement progressive drill-down from summary to detail Schema validation errors Symptom: Queries returning empty results or unexpected columns Solution: Verify hub schema version compatibility using the database guide Validation: Test with known queries from the query catalog Query optimization best practices Temporal filtering ✅ Recommended: "Show monthly costs for Q1 2025" ❌ Avoid: "Show all historical costs by day" Aggregation-first approach ✅ Recommended: "Top 10 resource groups by cost" ❌ Avoid: "All resources with individual costs" Multi-subscription handling ✅ Recommended: "Costs by subscription for production environment" ❌ Avoid: "All costs across all subscriptions without filtering" Conclusion The integration of FinOps hubs with natural language querying through GitHub Copilot and Azure MCP Server represents a transformative advancement in cloud financial management accessibility. By eliminating technical barriers traditionally associated with cost analysis, this approach enables broader organizational adoption of FinOps practices while maintaining analytical rigor and data accuracy. Key takeaways for implementation success Foundation building Start with the basics: Ensure robust FinOps hub deployment with clean, consistent data ingestion Validate authentication and connectivity before advancing to complex scenarios Begin with basic queries and progressively increase complexity as team familiarity grows Business value focus Align with organizational needs: Align query patterns with organizational FinOps maturity and immediate business needs Prioritize use cases that demonstrate clear ROI and operational efficiency gains Establish feedback loops with finance and business stakeholders to refine analytical approaches Scale and governance planning Design for enterprise success: Implement appropriate access controls and data governance from the beginning Design query patterns that perform well at organizational scale Establish monitoring and alerting for cost anomalies and policy compliance Future considerations As natural language interfaces continue to evolve, organizations should prepare for enhanced capabilities including: 🔮 Advanced analytics Multi-modal analysis: Integration of cost data with performance metrics, compliance reports, and business KPIs Predictive analytics: Advanced forecasting and scenario modeling through conversational interfaces 🤖 Automated intelligence Automated optimization: Natural language-driven resource rightsizing and commitment recommendations Cross-platform intelligence: Unified analysis across cloud providers, SaaS platforms, and on-premises infrastructure The democratization of FinOps analytics through natural language interfaces positions organizations to make faster, more informed decisions about cloud investments while fostering a culture of cost consciousness across all teams. Success with this integration requires both technical implementation excellence and organizational change management to maximize adoption and business impact. Learn more about the FinOps toolkit and stay updated on new capabilities at the FinOps toolkit website.2.3KViews5likes2Comments