data & ai
237 TopicsThis week on the Fabric Engineering Connection
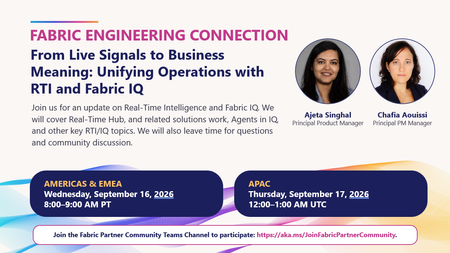
How do you turn live operational signals into actionable business insights? Join us for this week's Fabric Engineering Connection: "From Live Signals to Business Meaning: Unifying Operations with RTI and Fabric IQ" with Ajeta Singhal and Chafia Aouissi. We'll explore the latest across Real-Time Intelligence and Fabric IQ, discuss Real-Time Hub and Agents in IQ, and leave plenty of time for partner questions and discussion. 🗓️ Americas & EMEA: Wednesday, September 16 | 8:00-9:00 AM PT 🗓️ APAC: Thursday, September 17 | 12:00-1:00 AM UTC Bring your questions, learn what's new, and hear directly from the team building these capabilities. Join us in the Fabric Partner Community: https://aka.ms/JoinFabricPartnerCommunity45Views2likes0Comments🚀 Join the FY27 Fabric Engineering Connection Kickoff Call
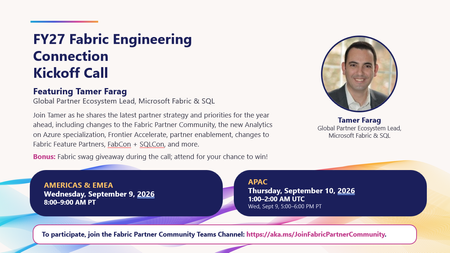
We're excited to kick off FY27 with the first Fabric Engineering Connection call of the year! Join Tamer Farag, Global Partner Ecosystem Lead for Microsoft Fabric & SQL, as he shares the latest strategy, priorities, and opportunities for partners in the year ahead. What we'll cover ✅ Fabric Partner Community updates and upcoming changes ✅ Analytics on Azure Specialization updates ✅ Frontier Accelerate program highlights ✅ Partner enablement plans and resources ✅ Fabric Feature Partner program updates ✅ FabCon and SQLCon insights and opportunities ✅ Open Q&A with the community 🎁 Bonus: Attend live for a chance to win Fabric swag during the call! Event Details Americas & EMEA 📅 Wednesday, September 9, 2026 🕗 8:00 AM – 9:00 AM PT APAC 📅 Thursday, September 10, 2026 🕐 1:00 PM – 2:00 PM UTC (Wednesday, September 9, 5:00 PM – 6:00 PM PT) How to Join To participate, join the Fabric Partner Community Teams channel: 🔗 https://aka.ms/JoinFabricPartnerCommunity Whether you're a long-time community member or just beginning your Microsoft Fabric journey, this is a great opportunity to hear directly from the team, get aligned on FY27 priorities, and connect with fellow partners around the world. We look forward to seeing you there!199Views1like2CommentsManaging SharePoint Online Version History at Scale to Recover Storage
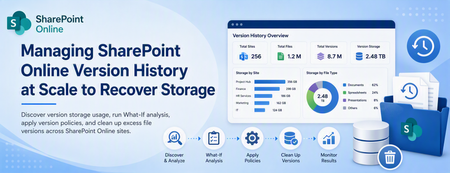
Summay SharePoint Online version history is one of those features that users love, but admins eventually have to govern. Versioning protects users from accidental edits, bad changes, and overwritten content. It gives people a way to restore previous versions of documents without opening a ticket. That is a good thing. But at tenant scale, version history can also consume a surprising amount of storage. Highly active libraries, large Office files, frequent edits, migrations, sync activity, and years of retained versions can quietly add up. Eventually, admins need to answer a few practical questions: How many file versions do we have? How much storage are those versions consuming? Which sites would benefit most from cleanup? What policy should we apply going forward? How much space could we recover before making changes? How do we clean up versions safely across many sites? That is why I built this tool: SPOVersions-ApplicationTools The main script is: Apply-SPOVersions-Tool.ps1 Why version history planning matters Microsoft's official guidance for SharePoint version storage makes an important point: version limits should support your organization's recovery objectives while also controlling storage consumption. Microsoft documents this here: Plan version storage for document libraries in SharePoint The key idea is balance. If you keep too many versions for too long, storage consumption can grow quickly. If you trim too aggressively, users may lose the ability to recover from accidental or unwanted changes. A good version history strategy needs to consider both: Goal Why it matters Recovery Users need enough version history to restore useful prior versions. Storage control Admins need to prevent version history from consuming excessive quota. Consistency Tenant defaults and site-level policies should be understandable and repeatable. Exceptions Some business areas may need different version retention behavior. Safe cleanup Existing versions should be analyzed before deletion jobs are created. The goal is not simply to delete versions. The goal is to understand version storage, set the right policy, and clean up intentionally. What Microsoft recommends admins consider Microsoft's documentation calls out three major planning questions: Determine the default version history limits for new document libraries. Identify exceptions needed from organization default limits. Decide whether existing content should be updated to align with the organization limits. That third point is where many admins need tooling. It is one thing to configure a tenant default for new libraries. It is another thing to understand what already exists across hundreds or thousands of sites. Existing content is often where the storage opportunity is. Automatic vs. manual version limits SharePoint provides different ways to manage version history. Mode What it does Best fit Automatic SharePoint uses intelligent trimming based on version age. Recent versions are preserved more densely, while older versions are thinned over time. Recommended default for many organizations that want Microsoft-managed optimization. Manual with count and expiration Admins specify how many major versions to keep and how long versions should remain. Useful when you want more direct control and predictable cleanup. Manual with count only Admins keep a configured number of versions without age-based expiration. Useful when a fixed restore count matters, but it can consume more storage. Microsoft's guidance highlights that automatic trimming is designed to preserve high-value versions while optimizing storage. Manual policies can be useful, but they require careful planning because low limits or short expiration windows can affect restore scenarios. That is why I wanted this tool to include reporting and What-If analysis before cleanup. What the tool does Apply-SPOVersions-Tool.ps1 is an interactive PowerShell tool built with PnP PowerShell to help admins manage SharePoint Online version policies across multiple site collections. At a high level, the tool helps admins: Audit current version policies across sites. Apply automatic or manual version limits. Review version policy status. Generate version history reports. Run What-If analysis to estimate storage recovery. Create batch delete jobs for cleanup. Monitor cleanup job status. Set tenant-level defaults for new sites. This makes it useful for both planning and implementation. Why I built it as an admin workflow Version cleanup should not start with deletion. The safer workflow is: Discover current settings. Generate version history reports. Estimate storage recovery. Decide the right policy. Apply policy to selected sites. Queue cleanup jobs. Monitor job status. Repeat as part of governance. That is how the tool is structured. It is not just a cleanup script. It is a planning and execution tool. Site discovery options The tool can work from a defined list of site URLs or discover sites automatically. For larger tenants, I usually prefer a site list because it gives admins better control over rollout scope. You can start with a pilot group, validate results, then expand. For smaller tenants or discovery scenarios, auto-discovery can be useful. The tool supports: SharePoint sites OneDrive for Business sites Exclusion of common system sites Confirmation before processing discovered sites That confirmation step matters. When a script can operate across many sites, admins should have a checkpoint before changes are made. Key operations: Get current version policies Before changing anything, admins can retrieve current version policy settings for all selected sites. This helps answer: Which sites already use automatic trimming? Which sites use manual limits? Which sites have inconsistent settings? Which sites may need exceptions? This is useful for building a baseline. Set version policies across sites After planning, admins can apply version policies across site collections. The tool supports: Automatic version trimming Manual major version limits Optional expiration after a specified number of days Automatic trimming is useful when you want SharePoint to optimize storage intelligently. Manual limits are useful when the organization has a defined policy, such as keeping a specific number of major versions or expiring versions after a specific period. Check version policy status Policy changes may take time to apply. The tool can check propagation status, so admins can verify whether pending changes are completed successfully. This is important during staged rollouts because you want to confirm policy state before moving on to cleanup. Generate version history reports This is one of the most important parts of the workflow. The tool can submit version history report jobs for each site. Those reports are written to a dedicated document library created by the tool: Admin_SiteCollection_VersionReport_DONOTDELETE Using a dedicated library avoids some of the issues that can happen when report files are written into normal user-facing document libraries. The reports provide the raw data needed to understand version storage usage. Run What-If analysis This is the feature I think most admins should start with. The What-If analysis downloads completed version history reports and simulates a version policy without making changes. That means admins can estimate: Total versions analyzed Versions that would be deleted Total version storage Storage that could be recovered Percent of version storage that could be freed Per-site savings This gives admins data before they commit to a cleanup policy. For example, a What-If analysis might show that one site can recover a large amount of storage while another site has very little benefit. That helps prioritize action. Create batchdeletejobs Once the admin understands the impact and chooses a policy, the tool can create batch delete jobs to remove excess versions. This is the destructive part of the workflow, so it should come after reporting and What-If analysis. Admins can use automatic or manual cleanup criteria depending on the desired policy. Important reminder: deleted versions are not recovered from the Recycle Bin. Treat batch delete jobs as permanent cleanup operations. Monitor batchdeletejob status After cleanup jobs are created, admins need to know whether they completed and how much storage was released. The tool can check batch delete job status across sites, including completion state and storage released where available. This closes the loop from planning to execution. Tenant-level defaults vs. existing content One important distinction in SharePoint version management is the difference between tenant-level defaults and existing content. Tenant-level settings affect new sites or new libraries going forward. Existing sites and existing file versions may need additional steps. Microsoft's guidance describes multiple approaches: Scenario What it means Apply defaults to new libraries only Least disruptive; existing settings and versions remain unchanged. Update existing library settings without trimming versions Future versions follow the new policy, but existing versions are not deleted. Update settings and trim existing versions Aligns current and future behavior but requires careful planning and cleanup jobs. This tool helps with the third scenario, where admins need to understand and manage existing version storage across sites. A practical rollout approach For most tenants, I would not recommend starting with the entire environment. A safer rollout looks like this: Phase Action Phase 1: Baseline Get current version policies across a small set of sites. Phase 2: Report Generate version history reports for pilot sites. Phase 3: What-If Estimate storage recovery under automatic or manual policies. Phase 4: Decide Choose default policy and identify exceptions. Phase 5: Apply Apply policy to selected pilot sites. Phase 6: Cleanup Queue batch delete jobs only after review. Phase 7: Monitor Check job status and storage released. Phase 8: Expand Repeat across additional sites or workloads. This creates a defensible admin process instead of a one-time cleanup event. Where this helps most This tool is especially useful in tenants with: Large document libraries Heavy collaboration sites Long-running project sites Migration history Large Office files with frequent edits Storage pressure Inconsistent site-level version policies Need for tenant-wide governance reporting It can also help organizations that want to move toward automatic trimming but need to understand the impact first. Permissions and prerequisites The tool uses PnP PowerShell and interactive authentication. Typical prerequisites include: PowerShell 5.1 or later PnP.PowerShell 3.1.0 or later SharePoint Administrator role Entra ID app registration Delegated SharePoint permissions required for version policy and report operations Important: Ensure that the account running this tool has site collection admin rights on all sites If you need to add your Admin account to all OneDrive and SPO sites, check out this scripts: Add-GroupToSPOSites.ps1 Add-GroupToOneDriveSites.ps1 The repository README includes setup details and permission guidance: Apply-SPOVersions-Tool README As always, review permissions carefully before using any tenant-wide admin automation. Safety notes Version cleanup can permanently remove version history. Before creating cleanup jobs: Run reports first. Run What-If analysis. Start with pilot sites. Review business requirements. Identify exceptions. Communicate expected behavior to site owners. Keep exported results for audit and planning. Avoid opening or modifying report CSV files while report jobs are still running. The tool is designed to support safe planning, but admins still need to make policy decisions carefully. Why this belongs in your governance toolkit SharePoint storage management is not just about quota. Version history touches: User recovery expectations Records and retention requirements Collaboration patterns Site lifecycle Migration cleanup Storage forecasting Governance consistency If version history is unmanaged, storage growth can feel mysterious. Once you report on it, it becomes something you can plan and control. That is the point of this tool: help admins move from guessing to measuring, then from measuring to controlled action. Final thoughts SharePoint version history is valuable, but it needs governance at scale. Microsoft provides flexible version storage options, including automatic trimming and manual limits. The challenge for admins is understanding what exists today and how much storage could be recovered before applying changes. Apply-SPOVersions-Tool.ps1 helps with that process by combining policy discovery, report generation, What-If analysis, policy application, cleanup jobs, and job monitoring into a single admin workflow. More Information You can find the tool here: SPOVersions-ApplicationTools Microsoft's official planning guidance is here: Plan version storage for document libraries in SharePoint Suggested Reading for More Information: SharePoint Automatic Version History Cleanup (Intelligent Versioning)445Views0likes0Comments✨ FabCon + SQLCon Europe 2026: Partner Know Before You Go Guide is Now Live!
Barcelona is just around the corner, and we're excited to welcome our partner community to the first-ever co-located FabCon + SQLCon Europe experience! To help you make the most of your time onsite, the Partner Know Before You Go Guide is now available. This guide brings together everything partners need to know before arriving, including exclusive partner programming, networking opportunities, important deadlines, and event resources. What You'll Find Inside ✅ Partner Day agenda and key sessions ✅ Partner Happy Hour details ✅ Partner Elevator Pitch Challenge information ✅ Executive Meetings with Fabric & SQL Leadership Team ✅ 1:1 Meetings with the Partner Success Team ✅ AMA Session with the Fabric Partner Success Team ✅ Fabric Certification Recognition opportunities ✅ Testimonial Video nominations ✅ Fabric in the Wild Partner Photo Scavenger Hunt ✅ Cvent Event App guidance and Partner Community information Important Partner Deadlines 📅 September 13, 2026 (11:59 PM PT) Submit your Partner Elevator Pitch entry Request an Executive Meeting with Fabric Leadership Request a 1:1 Meeting with the Partner Success Team Nominate yourself or your customer for a testimonial video opportunity Event Details 📍 Centre de Convencions Internacional de Barcelona (CCIB) 📅 September 28 - October 1, 2026 🌍 Barcelona, Spain Whether you're attending Partner Day, meeting with Microsoft leaders, showcasing your expertise, or connecting with peers from around the world, we've built partner-exclusive experiences to help you learn, connect, and accelerate your Microsoft Fabric business. 📘 Download the Partner Know Before You Go Guide below. ⬇️ We can't wait to see you in Barcelona! #FabConEurope #SQLConEurope #MicrosoftFabric #MicrosoftPartners #DataAndAI #FabCon2026 #PartnerCommunity404Views2likes0Comments2026 FabCon + SQLCon Europe Fabric in the Wild: Photo Scavenger Hunt
📸 Fabric in the Wild: Photo Scavenger Hunt at FabCon + SQLCon Europe Heading to FabCon + SQLCon Europe in Barcelona? Get ready to explore, connect, and have some fun with the Fabric community! We're excited to launch the Fabric in the Wild: Photo Scavenger Hunt, an exclusive experience for Microsoft partners attending the event. Whether you're networking at Partner Day, taking in the keynotes, meeting fellow partners, or discovering Barcelona, you'll have the opportunity to capture your adventure and win some exclusive Fabric swag. 🏆 Win Fabric Kicks Complete the challenge by sharing photos from any five scavenger hunt moments and you'll be entered for a chance to win 1 of 3 pairs of Fabric Kicks. 📷 How It Works ✅ Complete any 5 photo challenges from the hunt ✅ Share all 5 photos in a single LinkedIn post or carousel ✅ Include: #FabConEurope #MicrosoftPartner #FabricInTheWildSweepstakes ✅ Tag @Stephanie Chimeziri That's it. You're in! The scavenger hunt is all about celebrating the people, experiences, and energy that make the Microsoft Fabric partner community special. From Partner Day and keynotes to new connections and iconic Barcelona landmarks, we can't wait to see Fabric in the wild through your lens. Drop your photos, showcase your creativity, and share your FabCon story with the community! 🌍 See you in Barcelona. For more information about FabCon + SQLCon Europe, visit aka.ms/fabconeu #MicrosoftFabric #FabConEurope #SQLConEurope #MicrosoftPartner #FabricCommunity #DataAnalytics #FabricInTheWildSweepstakes #PartnerDay #MicrosoftPartners87Views1like0Comments
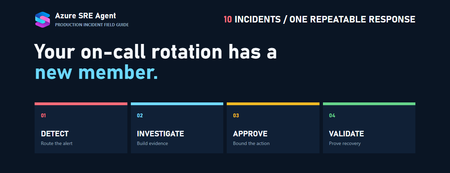
Your on-call rotation has a new member: 10 production incidents, end to end, with Azure SRE Agent
What this post is. A hands-on, reproducible walkthrough of ten real production failure modes — App Service, AKS, Azure SQL, Cosmos DB, VMs, VM Scale Sets, Application Gateway, and Service Bus — each one driven end to end by Azure SRE Agent: detection, hypothesis-driven investigation, ITSM ticketing, bounded remediation, recovery validation, and follow-up records. What this post is not. A claim that you install SRE Agent and all of this happens on day one. Every workflow below needs telemetry, scoped RBAC, a response plan, an approved action surface, and an ITSM integration. I'll be explicit about which parts are documented product behavior and which parts you have to wire yourself — because that distinction is the difference between a demo that works on stage and one that works at 3 AM. TL;DR The pattern Alert → agent investigates read-only → agent opens/updates the ticket with evidence → agent proposes a bounded action → human approves → agent executes → agent validates recovery → agent files the follow-up record The unlock Not "AI fixes prod." The unlock is that investigation — the 20 minutes of tab-switching between Azure Monitor, App Insights, deployment history, and Activity Log — is fully automated and consistent, and the fix arrives pre-justified with an evidence chain The guardrail Read-only automatic. Ticketing automatic. Production writes in Review mode. Guest-OS work through fixed-purpose runbooks, never a shell prompt The reality check SRE Agent hard-blocks delete / remove and all az keyvault commands, respects Azure management locks, and only one incident platform can be active at a time. Several patterns in this post need a custom tool or MCP server to complete the loop Time to first value One resource group, one alert rule, one response plan. You can reproduce use case #1 in an afternoon 1. Why the "investigation" half is the real prize Every conversation about AI in operations goes straight to remediation. "Will it restart my app?" That's the least interesting question, and it's the one with the most downside risk. Think about what actually consumes the minutes during a Sev1. The alert fires. Someone acknowledges. Then: Open Azure Monitor, confirm the metric is real and not a probe artifact Open Application Insights, find the dominant exception Open the deployment pipeline, find what shipped and when Open Activity Log, check whether someone changed configuration Open Resource Health, rule out a platform incident Open the other environment, confirm the previous version is healthy Assemble all of that into a sentence a human can act on That's twenty minutes of context assembly performed by a tired human, differently every time, with quality that depends entirely on who happens to be on call. It is the single most automatable part of incident response and the part nobody automates, because scripts can't reason about which of six hypotheses fits the evidence. This is exactly what root cause analysis in SRE Agent is designed for. The agent doesn't grep logs — it forms hypotheses and invalidates them: HYPOTHESIS 1: Recent deployment broke something ├─ Checked: Last deployment was 3 days ago ├─ Evidence: Error rate stable until 30 minutes ago └─ Result: INVALIDATED HYPOTHESIS 2: Database overloaded ├─ Checked: Azure SQL metrics (CPU, DTU, connections) ├─ Evidence: DTU at 98%, query duration 4x normal ├─ Traced: SELECT * FROM orders WHERE... taking 8.2s └─ Result: VALIDATED ROOT CAUSE: Orders table missing index on customer_id column. Query plan shows full table scan on 2.1M rows. RECOMMENDED ACTION: Add index on orders.customer_id Similar fix applied in INC-2341 (3 weeks ago) That last line — recalling a similar incident from three weeks ago — is the compounding part. Every thread produces a session insight: symptoms observed, steps that worked, root cause, and pitfalls to avoid. Thirty minutes after a thread goes quiet, the agent indexes those learnings. Next time the same resource misbehaves, that history surfaces first. So the framing for the rest of this post: remediation is the punchline, but investigation is the product. Every one of the ten use cases below has a large read-only phase you can turn on tomorrow with zero write permissions, and a small write phase you should gate behind approval for a long time. 2. What Azure SRE Agent actually does Before the use cases, here is the honest capability map, drawn from the product documentation rather than from a keynote. The three primary use cases Use case What it means Automate incidents Alert fires → agent queries monitoring tools, correlates signals across systems, identifies probable root cause, proposes mitigations Automate scheduled workflows Proactive health checks, compliance sweeps, and routine tasks on a schedule, with results routed to your incident platform or notification channel Investigate and advise Natural-language questions — "what changed in the last hour?" — answered with grounded citations The five extension primitives Everything you customize sits in one of five buckets: Primitive What it is When you reach for it Skills Procedural guidance ( SKILL.md ) plus optional attached tools; auto-loaded when relevant Team troubleshooting runbooks that should also execute Subagents / custom agents Purpose-built specialists invoked via /agent or routed to by a response plan A DatabaseExpert that owns every SQL incident Python tools Custom logic, transformations, API calls Anything that needs code, e.g. writing to the ServiceNow Table API MCP servers 40+ managed connectors (Datadog, New Relic, Splunk, Elastic, Dynatrace…) plus any custom MCP tool Bringing your non-Azure telemetry and your ITSM write surface into the loop Agent hooks Event-triggered automations at Stop and PostToolUse Policy enforcement, audit emission, blocking risky commands Six generic subagents ship built in — Explore, Plan, CodeReview, Bash, Verification, GeneralPurpose — and the agent can parallelize investigation, planning, review, shell, and verification work across them. A permission gate sits in front of all five primitives and evaluates every proposed tool call before it runs. Integrations you can assume Category Supported Monitoring Azure Monitor (metrics, logs, alerts, workbooks), Application Insights, Log Analytics, Grafana Incident platforms Azure Monitor Alerts, PagerDuty, ServiceNow — only one active at a time Source control / CI GitHub (repos, issues), Azure DevOps (repos, work items) Data Azure Data Explorer (Kusto), MCP servers Comms Slack, Microsoft Teams ⚠️ Design constraint worth internalizing early. Only one incident platform can be active at a time, and switching disconnects the current one. If your org runs PagerDuty for paging and ServiceNow for records of truth, you must pick which one the agent is bound to and reach the other through a connector or custom tool. Every use case below assumes ServiceNow is the bound platform. Skills vs. custom agents vs. knowledge files The three are constantly confused. This table settles it: Skills Custom agents Knowledge files Access Automatic when relevant Explicit ( /agent ) or routed by response plan Automatic search Tools Can attach Has its own None Context Uses thread context Shares thread context (no clean slate) Reference only Best for Team procedures with execution Domain specialists Runbooks, architecture docs Practical limits: a maximum of five concurrent active skills (oldest auto-unloads), knowledge base uploads up to 16 MB per file, and custom agent knowledge bases up to 1,000 files. 3. Anatomy of an agent-run incident Every use case in section 6 is an instance of this one shape. Learn it once. [[INCIDENT_FLOW_IMAGE]] Five properties make this shape safe, and they're worth stating as rules: The read phase has no blast radius. Turn it on everywhere, immediately, with Reader . One action per incident. Not "roll back and scale and restart." One bounded, reversible step, then re-measure. The proposed action is always the smallest reversible one. Swap a slot, don't redeploy. Bump one service tier, don't resize the cluster. Validation is a first-class phase, not a vibe. Define the metric, the threshold, and the duration before you approve. Technical recovery ≠ business recovery. Use case #10 makes this painfully clear. 4. Build the demo lab Everything below runs in a single throwaway resource group. Nothing here should touch a subscription you care about. 🧪 Lab hygiene. Create it, demo it, delete it. az group delete -n rg-sre-agent-demo --yes --no-wait when you're done. Several of these use cases deliberately break things. 4.1 Resource group and agent LOC=eastus2 RG=rg-sre-agent-demo az group create -n $RG -l $LOC Create the SRE Agent from the Azure portal and point it at $RG . Three things are created for you automatically: an Application Insights instance (this is where your audit trail lands), a Log Analytics workspace, a user-assigned managed identity (UAMI) — the identity every action runs as. 4.2 Choose a permission level deliberately At creation you pick one of two levels: Level Grants Use it when Reader Core monitoring roles + resource-type reader roles. Prompts for temporary elevation via on-behalf-of when it needs to act Start here. Production. Weeks 1–4 of any pilot Privileged Core monitoring roles + resource-type contributor roles Non-production, or after a proven pilot Regardless of level, these are always assigned: Role Scope Why Reader Resource group See resources and properties Log Analytics Reader Resource group Query logs and workspaces Monitoring Reader Resource group Read metrics Monitoring Contributor Subscription Acknowledge and close Azure Monitor alerts Grant additional access explicitly and narrowly: SUB=$(az account show --query id -o tsv) AGENT_MI=<agent-managed-identity-principal-id> # Read everywhere you want visibility az role assignment create \ --assignee $AGENT_MI \ --role "Reader" \ --scope "/subscriptions/$SUB" # Write ONLY where you intend the agent to act az role assignment create \ --assignee $AGENT_MI \ --role "Website Contributor" \ --scope "/subscriptions/$SUB/resourceGroups/$RG/providers/Microsoft.Web/sites/app-checkout-demo"</agent-managed-identity-principal-id> 📌 A sharp edge. You can't remove individual permissions from an agent — only entire resource groups. Removing a resource group from the agent's scope revokes all access to it. Plan your resource group boundaries as your blast-radius boundaries, because that's exactly what they are. 4.3 Connect ServiceNow Use a dedicated, least-privileged integration user — not a shared admin account. Method When What you need Basic auth Quick setup, PDI, testing Username + password, itil or admin role OAuth 2.0 Production ServiceNow OAuth app (client ID + secret); register redirect https://logic-apis-{region}.consent.azure-apim.net/redirect Scope the connection so you don't drown: Assignment group — essential on a shared enterprise instance Priority — Critical through Planning Category Scanner defaults worth knowing: Setting Value Scan interval 1 minute Incidents per page 20 Max incidents per cycle 220 (11 pages) Initial lookback 30 days Setup performs a real connectivity check by fetching an actual incident, so credential and endpoint mistakes surface immediately instead of six hours later when nothing syncs. 🚨 Delete the quickstart plan. Connecting an incident platform auto-creates a quickstart_handler response plan that runs in fully autonomous mode across all impacted services. If you then build your own plans, incidents get routed twice or to the wrong agent. Go to Builder → Incident response plans → Table view and delete it before you do anything else. 4.4 Connect deployment correlation Half the use cases below hinge on "what shipped three minutes before the spike." That correlation requires a source control connector: GitHub — repositories and issues Azure DevOps — repos and work items Connect one. Without it, the agent can still read Azure Activity Log and deployment history, but it can't reach commits, PRs, or work items. 4.5 Create the demo resources # 1 · App Service with a staging slot (use cases 1) az appservice plan create -g $RG -n plan-demo --sku P1V3 --is-linux az webapp create -g $RG -p plan-demo -n app-checkout-demo --runtime "DOTNETCORE:8.0" az webapp deployment slot create -g $RG -n app-checkout-demo --slot previous # 2 · AKS (use case 2) az aks create -g $RG -n aks-demo --node-count 3 --generate-ssh-keys --enable-addons monitoring # 3 · Azure SQL (use case 3) az sql server create -g $RG -n sqlsrv-sre-demo -u sqladmin -p "<use-a-generated-password>" az sql db create -g $RG -s sqlsrv-sre-demo -n db-customer --service-objective S1 # 4 · Cosmos DB (use case 4) az cosmosdb create -g $RG -n cosmos-sre-demo az cosmosdb sql database create -g $RG -a cosmos-sre-demo -n catalog az cosmosdb sql container create -g $RG -a cosmos-sre-demo -d catalog \ -n products --partition-key-path /category --throughput 400 # 5–7 · VMs (use cases 5, 6, 7) az vm create -g $RG -n vm-payments-linux --image Ubuntu2204 --size Standard_B2s --generate-ssh-keys az vm create -g $RG -n vm-claims-win --image Win2022Datacenter --size Standard_B2ms \ --admin-username azureadmin --admin-password "<use-a-generated-password>" # 8 · VM Scale Set (use case 8) az vmss create -g $RG -n vmss-api-demo --image Ubuntu2204 --instance-count 12 \ --upgrade-policy-mode automatic --generate-ssh-keys # 10 · Service Bus (use case 10) az servicebus namespace create -g $RG -n sb-sre-demo --sku Standard az servicebus queue create -g $RG --namespace-name sb-sre-demo -n order-events \ --enable-dead-lettering-on-message-expiration true</use-a-generated-password></use-a-generated-password> Install the Azure Monitor Agent on the VMs and associate a data collection rule — without guest telemetry, use cases 5, 6, and 7 have nothing to detect. 4.6 One custom agent per domain Don't build a single mega-agent. Build specialists and let response plans route to them: Custom agent Owns Attached tools DeploymentAnalyzer App Service, AKS, anything release-correlated RunAzCliReadCommands , GitHub connector, Kusto DatabaseExpert Azure SQL, Cosmos DB RunAzCliReadCommands , Kusto, read-only SQL diagnostics tool GuestOSResponder VM / VMSS / IIS RunAzCliReadCommands , fixed-purpose runbook tools only NetworkPathExpert Application Gateway, NSG, DNS, TLS RunAzCliReadCommands IntegrationExpert Service Bus, Event Hubs RunAzCliReadCommands , Kusto A custom agent definition is small: name: database_expert system_prompt: | You are a database specialist for this estate. Analyze query performance, diagnose connection and saturation issues, and recommend the smallest reversible mitigation. Never propose schema changes, index changes, plan forcing, or session termination — those are DBA-owned and require a change record. handoff_description: Handles Azure SQL and Cosmos DB troubleshooting tools: - execute_kusto_query - RunAzCliReadCommands allowed_skills: - azure-sql-saturation-runbook - cosmos-throughput-runbook Note what that system_prompt is really doing: it is narrowing the action space. Half of production safety with an agent is telling it, in plain English, which categories of fix are off the table. 4.7 Response plans Create one plan per domain, all starting in Review: Plan Filter Custom agent Mode appsvc-p1 Priority 1 + 2, service checkout DeploymentAnalyzer Review aks-p1 Priority 1, service orders-api DeploymentAnalyzer Review db-critical Priority 1 + 2, service customer-api DatabaseExpert Review vm-guest Priority 1 + 2, title contains disk , memory , CPU GuestOSResponder Review network-p1 Priority 1, title contains 502 , backend NetworkPathExpert Review integration-p1 Priority 1, service fulfillment IntegrationExpert Review Filters available: severity/priority (multiselect), impacted service, incident type, and title contains. Plans can be turned off without deleting them, which is exactly what you want during maintenance windows. 5. Set your guardrails before your first incident If you read only one section of this post, read this one. The guardrails are not paperwork; they are the reason this is deployable. 5.1 Run modes Mode Behavior Default Review Agent proposes; you approve or deny Agent-level default Autonomous Agent executes immediately and reports Per-plan and per-task default Two subtleties that bite people: Run modes are set per response plan and per scheduled task, not globally. The agent-level setting is only a fallback. And per-plan the default is Autonomous — so if you don't set it, you get autonomy. Review mode shows Approve/Deny only for Azure infrastructure operations (Azure CLI, ARM writes). Sending an email, posting to Teams, or querying an external source proceeds based on the agent's reasoning. To gate those, you need hooks or tool access policies. Only users holding the SRE Agent Administrator role can approve. Standard users cannot, and personal Microsoft accounts can't authorize on-behalf-of at all — it requires a work or school (Entra ID) account. 5.2 What the product blocks for you These are enforced at the command level, independent of your RBAC: Guardrail Behavior Delete operations The agent never runs delete or remove commands. It returns an error pointing you at the portal Key Vault All az keyvault commands are blocked, to prevent credential exposure Management locks Resources with ReadOnly locks can't be modified, regardless of permissions or run mode Subscription validation Subscription IDs are validated as well-formed GUIDs before execution 💡 Use the delete block architecturally. Put a ReadOnly management lock on anything that must never change during an incident — your Key Vaults, your production databases, your golden images. That lock is respected before every modification, which gives you a control that survives RBAC drift and misconfigured response plans. 5.3 Hooks: the guardrail you write yourself Two events are supported — Stop (agent about to return a final response) and PostToolUse (a tool finished). Hooks run as an LLM prompt or a sandboxed command script. Here is the single most useful hook for this entire post — a deterministic policy gate on shell execution: hooks: PostToolUse: - type: command matcher: "Bash|ExecuteShellCommand" timeout: 30 failMode: block script: | #!/usr/bin/env python3 import sys, json, re context = json.load(sys.stdin) command = context.get('tool_input', {}).get('command', '') dangerous = [ r'\brm\s+-rf\b', r'\bsudo\b', r'\bchmod\s+777\b', r'\bmkfs\b', r'\bdd\s+if=', r'\btruncate\b', r'\bDROP\s+TABLE\b', ] for pattern in dangerous: if re.search(pattern, command, re.IGNORECASE): print(json.dumps({"decision": "block", "reason": f"Blocked by policy: {pattern}"})) sys.exit(0) print(json.dumps({"decision": "allow"})) And a Stop hook that refuses to let the agent declare victory without evidence: hooks: Stop: - type: prompt model: ReasoningFast timeout: 30 prompt: | Review the agent's final response. $ARGUMENTS It is only acceptable if it contains ALL of: 1. The specific resource acted upon (full name or resource ID) 2. Metric values BEFORE and AFTER the action 3. The observation window over which recovery was confirmed 4. Who approved the action and at what UTC timestamp Respond with: {"ok": true} {"ok": false, "reason": "<what is="" missing="">"}</what> Hook mechanics you'll want on hand: Setting Default Range / notes timeout 30s 1–300s failMode allow allow or block maxRejections 3 1–25; prompt-type Stop hooks only matcher — Regex, anchored ^(pattern)$ , case-sensitive; * matches all Script size — 64 KB max Shebangs — #!/bin/bash , #!/usr/bin/env python3 ⚠️ The footgun: for Stop hooks, a rejection without a reason field is treated as approval. Always populate reason . Agent-level hooks and custom-agent-level hooks both run when both match; agent-level fires first. 5.4 The recommended production policy This is the policy I'd put in front of a change board: Allow read-only investigation automatically, everywhere. Allow automatic incident creation and work-note updates — after sanitization. Use Review mode for all production remediation. Require human approval for every production write. Use fixed-purpose runbooks instead of unrestricted VM shell access. Require separate approval for destructive or data-affecting actions. Initially require human confirmation before resolving an incident. 6. The ten use cases Each use case follows the same seven-part structure so you can skim to the one you're firefighting: What happened → How Azure Monitor detected it → How the agent found the cause → Agent action table → Recovery note → Try it yourself → Guardrails In the action tables, Type is one of: Type Meaning Read No blast radius. Safe to run automatically Decision Agent reasoning or an approval gate. No resource change Write (ITSM) Ticket create/update. Sanitized Write (Azure) Azure control-plane change. Approval required in production Write (Guest OS) Inside the VM, via a fixed-purpose runbook. Approval required Write (K8s/DevOps) Cluster or pipeline change. Approval required Validation Post-action measurement against defined thresholds Use case #1 — App Service: HTTP 500 after deployment The one you should build first. Clean trigger, bounded action, unambiguous validation. What happened Release 2026.03.12.4 was deployed to a production checkout App Service. The new code referenced an application setting that was never defined in the production slot. The application started fine — which is what makes this class of failure nasty — but every checkout operation that touched that setting returned HTTP 500. How Azure Monitor detected it Azure Monitor and Application Insights fired on a composite condition, not a single metric: HTTP 5xx rate above the operational threshold Failed availability tests Increased application exceptions Increased dependency failures Request latency above baseline P1 – Checkout App Service returning elevated HTTP 500 responses How the agent found the cause Identified the affected App Service and slot. Queried HTTP response and latency metrics. Queried Application Insights failed requests and exceptions. Identified the missing-setting exception as the dominant failure. Reviewed deployment history and Azure Activity Log. Correlated the error increase with release 2026.03.12.4 . Compared production against the previous deployment slot. Confirmed the previous slot remained healthy. Confirmed no matching Azure platform incident. Agent finding: HTTP 500 responses increased from 0.4% to 18% within three minutes of release 2026.03.12.4. Most failures reference a missing application setting. The previous deployment slot passes availability and dependency checks. Notice the shape of that sentence: a delta, a time correlation, and a known-good comparison. That's what makes it actionable rather than merely true. Agent action table # Action Type Detail 1 Investigate alert Read Reads HTTP 5xx rate, failed requests, latency, availability-test results 2 Analyze exceptions Read Identifies missing-configuration exception as dominant failure 3 Correlate deployment Read Finds release 2026.03.12.4 deployed three minutes before the spike 4 Compare slots Read Confirms previous slot healthy while production is failing 5 Rule out platform issue Read Checks Azure Resource Health and dependency health 6 Assess blast radius Read Determines checkout affected, unrelated services healthy 7 Create SNOW INC Write (ITSM) P1 against the Checkout CI, assigned to Application Operations 8 Update INC evidence Write (ITSM) Adds exceptions, deployment correlation, resource links, affected operations 9 Classify response Decision Classifies as deployment-caused; selects rollback 10 Pause release Write (DevOps) Pauses the failed release pipeline 11 Request approval Decision Requests approval to swap the previous healthy slot into production 12 Swap slot Write (Azure) Performs the approved swap only on the named App Service 13 Validate recovery Validation Confirms 5xx, latency, exceptions, dependencies, availability recover 14 Update/resolve INC Write (ITSM) Records approval, rollback, timestamps, recovery evidence 15 Create SNOW PRB Write (ITSM) Problem record for configuration-validation improvements Recovery note Production was reverted to the previous healthy deployment slot at 14:26 UTC. HTTP 500 responses declined from 18% to below 1%, and availability tests passed for 15 consecutive minutes. Preliminary cause: missing production configuration in release 2026.03.12.4. Try it yourself Break it: # Put a healthy build in the 'previous' slot first, then break production # by deploying code that reads an app setting which only exists in staging. az webapp config appsettings delete -g $RG -n app-checkout-demo \ --setting-names Checkout__PaymentProviderKey az webapp restart -g $RG -n app-checkout-demo Alert it: az monitor metrics alert create -g $RG -n "alert-checkout-5xx" \ --scopes "/subscriptions/$SUB/resourceGroups/$RG/providers/Microsoft.Web/sites/app-checkout-demo" \ --condition "total Http5xx > 20" \ --window-size 5m --evaluation-frequency 1m --severity 1 \ --description "P1 – Checkout App Service returning elevated HTTP 500 responses" Ask it (before the alert, to see the read phase in isolation): app-checkout-demo is returning HTTP 500s. Do not change anything. Investigate and tell me: 1. the dominant exception and its share of total failures 2. what deployed in the 30 minutes before the error rate changed 3. whether the 'previous' slot is healthy right now 4. whether Azure Resource Health shows a platform issue Give me the evidence chain and the smallest reversible mitigation. Expect it to propose: Proposed action: Swap slot 'previous' into production on app-checkout-demo Risk: brief connection drain (~10s). Fully reversible by swapping back. Validation: Http5xx < 1% and availability test passing for 15 minutes. [Approve] [Deny] Verify it: requests | where timestamp > ago(1h) | summarize failed = countif(success == false), total = count() by bin(timestamp, 1m) | extend failureRate = 100.0 * failed / total | render timechart 🎬 Best thing to record for a demo: the moment the Approve button appears with the evidence already attached. That single screen is the whole value proposition. Guardrails Scope write permissions to the named App Service, not the resource group. Verify the previous slot is healthy before swapping — a swap into a broken slot doubles the outage. Require human approval for production slot swaps. Preserve the failed deployment for analysis; don't let the pipeline overwrite it. Never grant subscription-level Contributor or Owner. Use case #2 — AKS: pods in CrashLoopBackOff What happened Image orders-api:4.18.0 referenced a configuration key that didn't exist in the production namespace. Eight of ten pods entered CrashLoopBackOff . The two survivors couldn't carry production traffic, producing latency and ingress 5xx. How Azure Monitor detected it Managed Prometheus / Container Insights detected: Unavailable replicas Increasing container restart count CrashLoopBackOff pod state Failed readiness and liveness checks Elevated ingress HTTP 5xx Reduced successful-request rate P1 – Orders API unavailable replicas in production AKS How the agent found the cause Identified the cluster, namespace, and deployment. Reviewed deployment availability and pod states. Examined logs from failing containers. Reviewed Kubernetes warning events. Compared current and previous ReplicaSets. Correlated the failure with revision 42. Identified the missing configuration key. Confirmed revision 41 was previously healthy. Checked node CPU, memory, storage, networking, status. Determined AKS infrastructure was healthy. Agent finding: Eight of ten Orders API pods entered CrashLoopBackOff during rollout of revision 42. Container logs show a missing configuration key. Revision 41, using image 4.17.6, was healthy. Step 10 is the one people skip. "Rule out the infrastructure" is what stops you from spending an hour on a node pool that was never the problem. Agent action table # Action Type Detail 1 Investigate workload Read Deployment status, unavailable replicas, readiness, restart counts 2 Analyze pod logs Read Startup failure from a missing configuration key 3 Analyze events Read Image pulls, mounts, scheduling, probes, container events 4 Correlate rollout Read Revision 42 deployed immediately before failure 5 Compare ReplicaSets Read Revision 41 was the previous healthy workload 6 Rule out infrastructure Read Nodes, memory, CPU, networking, storage healthy 7 Assess blast radius Read Eight of ten replicas unavailable 8 Create SNOW INC Write (ITSM) P1 against the Orders API CI 9 Update INC evidence Write (ITSM) Namespace, image, revision, errors, rollout correlation 10 Classify response Decision Application/configuration-caused 11 Request approval Decision Approval to pause and roll back revision 42 12 Pause failed rollout Write (K8s/DevOps) Prevents the release progressing or being reapplied 13 Roll back deployment Write (K8s) Rolls back only the named deployment to revision 41 14 Validate replicas Validation All expected replicas ready and stable 15 Validate application Validation Ingress errors decline; synthetic orders succeed 16 Update/resolve INC Write (ITSM) Revision, approval, rollback, recovery evidence 17 Create defect/task Write (ITSM) Add configuration validation to CI/CD Recovery note Orders API was rolled back from revision 42 to revision 41. All ten replicas are ready, restart counts have stabilized, ingress HTTP 5xx responses are below threshold, and synthetic order transactions are succeeding. Try it yourself Break it: az aks get-credentials -g $RG -n aks-demo kubectl create namespace orders kubectl create deployment orders-api -n orders --image=nginx:1.25 --replicas=10 kubectl rollout status deployment/orders-api -n orders # revision 41 equivalent, healthy # Now break it: point at an image whose entrypoint requires a missing env var kubectl set image deployment/orders-api -n orders orders-api=busybox:1.36 kubectl patch deployment orders-api -n orders --type=json -p='[ {"op":"add","path":"/spec/template/spec/containers/0/command", "value":["sh","-c","test -n \"$ORDERS_CONFIG_KEY\" || (echo \"FATAL: missing ORDERS_CONFIG_KEY\" >&2; exit 1); sleep 3600"]} ]' Watch it break: kubectl get pods -n orders -w kubectl rollout history deployment/orders-api -n orders Ask it: Pods in namespace 'orders' on aks-demo are crash looping. Read-only. Tell me: which revision introduced it, the exact container error, whether the node pool is healthy, and how many replicas are actually serving. Then tell me the last known-good revision and why you believe it was healthy. Expect it to propose: kubectl rollout undo deployment/orders-api -n orders --to-revision= scoped to that single deployment. Verify it: kubectl get deployment orders-api -n orders \ -o jsonpath='{.status.readyReplicas}/{.status.replicas}{"\n"}' kubectl get pods -n orders --no-headers | awk '{print $4}' | sort | uniq -c Guardrails Restrict access to the required cluster, namespace, and deployment. Do not grant cluster-admin . Require approval for rollback. Coordinate with GitOps reconciliation. If Flux or Argo owns that deployment, a kubectl rollout undo gets reverted within minutes and you've created a flapping outage. Either pause reconciliation first or roll back through Git. Do not permit namespace, persistent-volume, or cluster deletion. Use case #3 — Azure SQL Database: CPU saturation and timeouts The use case where the agent's job is to buy time, not to fix the problem. What happened A query execution plan changed after an application release. The new plan consumed substantially more CPU and workers. The database saturated, producing SQL dependency timeouts and failed customer requests. How Azure Monitor detected it Sustained CPU saturation Worker or session pressure Increased connection failures SQL dependency timeouts Query-duration deviation from baseline Degraded customer API success rate P1 – Customer API database saturation causing request timeouts How the agent found the cause Reviewed database CPU, workers, sessions, connections. Reviewed application SQL dependency failures. Checked for blocking and deadlocks. Ran approved read-only Query Store diagnostics. Identified the primary CPU-consuming query. Detected a recent execution-plan change. Correlated with an application release. Ruled out Azure service health and storage issues. Determined a temporary scale operation could restore service. Left permanent query remediation to the DBA team. Agent finding: Database CPU has remained saturated for 17 minutes. One query accounts for most recent CPU consumption and changed execution plan shortly before the incident. Application SQL dependency timeout rate is 23%. Step 10 is the design decision that makes this safe. The agent correctly diagnoses a plan regression and then deliberately does not fix it, because forcing a plan or dropping an index is a permanent, DBA-owned, change-controlled action. It buys capacity instead. Agent action table # Action Type Detail 1 Investigate database Read CPU, workers, sessions, connections, storage, availability 2 Analyze app impact Read SQL dependency latency, failures, affected API operations 3 Check blocking Read Approved diagnostics for blocking, deadlocks, connection growth 4 Analyze Query Store Read Highest-impact query and recent plan change 5 Correlate changes Read Recent application and database deployments 6 Rule out platform issue Read Service health, storage, database availability 7 Assess blast radius Read Affected applications; other databases healthy 8 Create SNOW INC Write (ITSM) P1 against the production database CI 9 Update INC evidence Write (ITSM) Utilization, query ID, timeouts, change correlation 10 Classify response Decision Scaling is mitigation; query changes remain DBA-owned 11 Calculate bounded scale Read Selects the smallest pre-approved capacity increase 12 Request approval Decision Database owner or incident commander 13 Scale database Write (Azure) Increases the affected database by one approved service step 14 Validate recovery Validation CPU, workers, timeouts, application success recover 15 Update INC Write (ITSM) Previous/new capacity, approval, timing, results 16 Create SNOW PRB Write (ITSM) Permanent query-remediation work 17 Create scale-down task Write (ITSM) Task/change to restore normal capacity after stability Recovery note Azure SQL capacity was temporarily increased by one approved service step. CPU declined from sustained saturation to 54%, and SQL dependency timeouts returned to baseline. Query Store indicates a probable execution-plan regression requiring permanent DBA remediation. Try it yourself Break it — generate a saturating workload against db-customer (an unindexed LIKE '%...%' scan in a tight loop from a container in the same region works fine on an S1). Alert it: az monitor metrics alert create -g $RG -n "alert-sql-cpu" \ --scopes "/subscriptions/$SUB/resourceGroups/$RG/providers/Microsoft.Sql/servers/sqlsrv-sre-demo/databases/db-customer" \ --condition "avg cpu_percent > 90" \ --window-size 5m --evaluation-frequency 1m --severity 1 \ --description "P1 – Customer API database saturation causing request timeouts" Ask it: db-customer is saturated. Read-only investigation. Identify the top CPU-consuming query, whether its plan changed recently, and what application release correlates. Do NOT propose index, schema, plan-forcing, or session-kill actions. Propose only the smallest temporary capacity step that restores service, and tell me what it costs per day and when we should scale back down. Read-only Query Store diagnostics the agent should run: SELECT TOP 10 qsq.query_id, qsp.plan_id, qsp.last_execution_time, SUM(qsrs.count_executions) AS executions, SUM(qsrs.avg_cpu_time * qsrs.count_executions) AS total_cpu_us FROM sys.query_store_query AS qsq JOIN sys.query_store_plan AS qsp ON qsp.query_id = qsq.query_id JOIN sys.query_store_runtime_stats AS qsrs ON qsrs.plan_id = qsp.plan_id JOIN sys.query_store_runtime_stats_interval AS qsrsi ON qsrsi.runtime_stats_interval_id = qsrs.runtime_stats_interval_id WHERE qsrsi.start_time > DATEADD(hour, -2, GETUTCDATE()) GROUP BY qsq.query_id, qsp.plan_id, qsp.last_execution_time ORDER BY total_cpu_us DESC; Expect it to propose: az sql db update -g $RG -s sqlsrv-sre-demo -n db-customer --service-objective S2 — exactly one step, on exactly that database. Guardrails Restrict scaling to the named database. Define minimum and maximum capacity. Require approval for scale-up and scale-down. Time-limit temporary capacity — an un-reversed emergency scale-up is how a P1 becomes a budget incident. Do not autonomously force plans, terminate sessions, modify indexes, or change schema. Track the temporary cost impact with an Azure Cost Management alert. Use case #4 — Azure Cosmos DB: HTTP 429 throttling The one where the correct root cause is "we're succeeding." What happened A marketing campaign increased Product Catalog traffic by roughly 40%. The Cosmos DB container hit its provisioned throughput ceiling. HTTP 429s increased, and client retries amplified application latency. How Azure Monitor detected it High normalized RU consumption Increased HTTP 429 responses Elevated server-side latency Application dependency failures Sustained operation near the throughput limit P2 – Cosmos DB throttling affecting Product Catalog requests How the agent found the cause Reviewed normalized RU consumption and throttled requests. Identified the affected database and container. Reviewed regional and partition behavior. Checked for hot-partition evidence. Reviewed application retry telemetry. Compared current traffic with the historical baseline. Correlated demand with the marketing campaign. Checked recent application deployments. Checked Azure service health. Determined the primary cause was legitimate demand. Agent finding: The Product Catalog container is at its configured throughput ceiling, and 21% of requests are being throttled. Traffic increased by approximately 40% following a campaign launch. No deployment or regional platform issue correlates with the event. Step 4 is the fork in the road. If consumption is uneven across partitions, more RU/s is money set on fire — the correct answer is an architecture change, not a scale-up. The agent has to check before it recommends. Agent action table # Action Type Detail 1 Investigate throttling Read RU consumption, 429 rate, latency, requests, availability 2 Identify scope Read Account, database, container, operations, regions 3 Analyze demand Read Compares traffic and RU consumption with historical patterns 4 Check partitions Read Looks for uneven partition consumption where telemetry permits 5 Analyze retries Read Determines whether client retries are amplifying the incident 6 Correlate events Read Links demand to campaign traffic; excludes release/platform issues 7 Assess blast radius Read Affected catalog operations; unaffected containers 8 Create SNOW INC Write (ITSM) P2 against the Product Catalog CI 9 Update INC evidence Write (ITSM) RU, throttling, latency, traffic, partition evidence 10 Classify response Decision Demand-driven unless hot-partition evidence exists 11 Calculate throughput Read Smallest increase within the cost ceiling 12 Request approval Decision Approval for a temporary throughput increase 13 Increase throughput Write (Azure) Raises throughput only to the approved maximum 14 Validate recovery Validation 429 rate and latency recover 15 Update/resolve INC Write (ITSM) Throughput, approval, cost implication, recovery 16 Create capacity task Write (ITSM) Work to return throughput to normal 17 Create SNOW PRB Write (ITSM) Partition or retry improvements, if required Recovery note Provisioned throughput was increased within the approved production limit. HTTP 429 responses declined from 21% to below 1%, and Product Catalog latency returned to baseline. The increase is temporary and will be reviewed after campaign traffic subsides. Try it yourself Break it: the container was created at 400 RU/s. Drive a few hundred reads per second at it and you'll be throttled within seconds. Alert it: az monitor metrics alert create -g $RG -n "alert-cosmos-429" \ --scopes "/subscriptions/$SUB/resourceGroups/$RG/providers/Microsoft.DocumentDB/databaseAccounts/cosmos-sre-demo" \ --condition "total TotalRequests where StatusCode == 429 > 100" \ --window-size 5m --evaluation-frequency 1m --severity 2 \ --description "P2 – Cosmos DB throttling affecting Product Catalog requests" Ask it: cosmos-sre-demo container 'products' is throttling. Read-only. Before recommending anything, tell me whether RU consumption is EVEN across physical partitions or concentrated. If it is concentrated, do not recommend a throughput increase — recommend an architecture problem record instead. If it is even, tell me the smallest RU/s that clears throttling and the daily cost delta. That prompt is the whole use case. Getting the agent to refuse the easy answer under a stated condition is the skill. Verify it: AzureDiagnostics | where ResourceProvider == "MICROSOFT.DOCUMENTDB" | where Category == "DataPlaneRequests" | summarize throttled = countif(statusCode_s == "429"), total = count() by bin(TimeGenerated, 1m) | extend throttleRate = 100.0 * throttled / total | render timechart Guardrails Define a maximum throughput ceiling the agent may not exceed. Restrict changes to the named container. Require approval for increases and reductions. Do not permit deletion, consistency-level changes, or region changes. Create cost alerts for prolonged increased throughput. Treat persistent hot partitions as an architecture issue, never as a scaling issue. Use case #5 — Azure VM: OS/root disk full The most operationally dangerous use case in this post, and the one with the most interesting guardrail design. What happened A legacy payment application generated excessive trace logs. Log rotation stopped working and the root filesystem filled. The VM stayed available at the Azure platform layer — heartbeat green, Resource Health fine — but the application stopped, because it could no longer write to disk. This is the classic "green dashboard, dead service" failure. Platform-layer monitoring alone will never catch it. How Azure Monitor detected it Azure Monitor Agent and guest telemetry detected: Critically low filesystem free space Rapid filesystem consumption Application process stopped Failed availability tests Elevated HTTP 5xx Healthy VM heartbeat but unhealthy application P1 – Legacy payment application unavailable due to full VM OS disk How the agent found the cause Confirmed the VM was online. Confirmed Azure Monitor Agent heartbeat. Identified the affected root/OS filesystem. Reviewed the free-space trend. Correlated application failure with disk exhaustion. Found 86 GB of growth in the application trace directory. Reviewed recent deployments and logging changes. Checked log-rotation status. Confirmed the files matched the approved cleanup policy. Excluded customer data, database files, audit logs, and system files. Agent finding: The VM is healthy at the Azure platform layer, but the OS volume has less than 1% free space. The approved application trace directory grew by 86 GB in six hours. The payment service stopped when it could no longer write to disk. Agent action table # Action Type Detail 1 Investigate VM Read VM, agent heartbeat, Azure platform health 2 Analyze filesystem Read Root volume and free-space trend 3 Correlate app failure Read Service stopped after disk exhaustion 4 Identify disk consumer Read Abnormal growth in an approved trace directory 5 Check changes Read Deployments, logging changes, rotation, scheduled tasks 6 Validate cleanup scope Read Candidate files meet approved path, type, and age rules 7 Protect data Decision Excludes databases, customer data, security logs, unknown files 8 Create SNOW INC Write (ITSM) P1 against the payment VM/application CI 9 Update INC evidence Write (ITSM) Disk usage, growth timeline, service impact, cleanup scope 10 Request approval Decision Approval for the restricted recovery runbook 11 Archive logs Write (Guest OS) Archives eligible files to protected Azure Storage 12 Remove eligible files Write (Guest OS) Removes only successfully archived, allowlisted files 13 Run log rotation Write (Guest OS) Executes the approved rotation operation 14 Restart service Write (Guest OS) Restarts only the named payment service if necessary 15 Validate recovery Validation Disk, application, archive, availability, growth stabilization 16 Update/resolve INC Write (ITSM) Bytes processed, exclusions, approval, results 17 Create SNOW PRB Write (ITSM) Permanent logging and rotation remediation Recovery note The approved recovery runbook archived and removed 82 GB of eligible application trace files. OS-volume free space is now 31%. The payment service was restarted and has passed health checks for 15 minutes. No database, customer, security, or system files were modified. That last sentence is not decoration. It is the sentence your auditor will read. Try it yourself Break it (lab VM only — this fills the root disk): az vm run-command invoke -g $RG -n vm-payments-linux \ --command-id RunShellScript --scripts " mkdir -p /var/log/payments/trace fallocate -l 24G /var/log/payments/trace/trace-$(date +%s).log df -h / " Ask it: vm-payments-linux root filesystem is nearly full and the payment service is down. Read-only first. Tell me: - exactly which directory grew, by how much, over what window - whether log rotation is configured and when it last ran - what changed in the last 24 hours that would explain it Then tell me which files are inside the approved cleanup allowlist (/var/log/payments/trace/*.log, older than 2h) and which are NOT, and confirm no database, audit, or customer data files are in scope. Do not delete anything. The critical design point. SRE Agent blocks delete and remove commands outright. You cannot have it rm those files through its Azure CLI surface, and you should be glad. The correct implementation is a fixed-purpose, version-controlled runbook that the agent invokes with tightly bounded parameters: # What the agent is allowed to call — one runbook, allowlisted parameters, nothing else az automation runbook start \ -g $RG --automation-account-name aa-sre-runbooks \ -n "Reclaim-TraceDiskSpace" \ --parameters vmName=vm-payments-linux \ allowedPath=/var/log/payments/trace \ pattern='*.log' \ minAgeHours=2 \ maxBytes=90000000000 \ archiveToContainer=payments-trace-archive \ requireArchiveBeforeDelete=true \ dryRun=false The runbook — not the agent — owns the destructive logic, and it enforces: path allowlist (refuse anything outside allowedPath ) filename pattern allowlist minimum file age maximum total bytes per execution successful archive verified before any deletion hard-refuse if any candidate file is unknown, or matches a protected pattern ( *.mdf , *.bak , /var/log/audit/* , *.key , *.pem ) a cooldown that prevents re-execution within N hours Verify it: az vm run-command invoke -g $RG -n vm-payments-linux \ --command-id RunShellScript \ --scripts "df -h /; systemctl is-active payments.service; ls -la /var/log/payments/trace | head" Guardrails Do not give SRE Agent unrestricted SSH or shell access. Ever. This is the single highest-leverage rule in this post. Use a version-controlled, fixed-purpose runbook. Allowlist paths, patterns, file ages, and maximum cleanup size. Stop if the responsible files are unknown. A disk filled by something you can't identify is a security event until proven otherwise. Require successful archival before deletion. Prevent repeated execution with a cooldown. Treat cleanup as temporary mitigation — the problem record is the fix. Use case #6 — Linux VM: anomalous CPU saturation Where "anomalous" is doing all the work. What happened Release 7.3.1 introduced an immediate retry loop when an inventory dependency failed. The application retried continuously without backoff, consuming nearly all VM CPU and causing request timeouts. How Azure Monitor detected it The alert deliberately combined conditions rather than firing on a threshold: CPU significantly outside the historical baseline Persistent saturation over multiple evaluations Increased request latency Increased dependency failures No approved maintenance or batch workload active P1 – Production order-processing Linux VM experiencing anomalous CPU saturation A static "CPU > 90%" rule on a batch-processing VM is a pager that everyone learns to ignore. The composite condition is what makes the alert worth waking someone — or an agent — for. How the agent found the cause Confirmed the VM was online. Compared current CPU with historical behavior. Identified the order-processing service as the main CPU consumer. Reviewed application request latency. Reviewed downstream dependency failures. Analyzed application retry logs. Correlated CPU growth with release 7.3.1. Excluded expected batch jobs. Excluded Azure maintenance or platform issues. Confirmed other application instances had sufficient capacity. Agent finding: CPU increased from a normal range of 35–50% to 98% four minutes after deployment 7.3.1. The order-processing service is repeatedly calling a failed dependency without backoff. No expected batch job or platform maintenance is active. Agent action table # Action Type Detail 1 Confirm anomaly Read Compares current CPU with the historical baseline 2 Analyze impact Read Latency, timeouts, availability, dependencies 3 Identify process Read Named order service is the primary CPU consumer 4 Correlate deployment Read Release 7.3.1, four minutes before saturation 5 Analyze logs Read Dependency retry loop without backoff 6 Rule out expected work Read Excludes batch, backup, maintenance, scheduled processing 7 Assess blast radius Read Traffic and available capacity on other instances 8 Create SNOW INC Write (ITSM) P1 against the Order Processing CI 9 Update INC evidence Write (ITSM) CPU, process, dependency, release, customer impact 10 Classify response Decision Rollback, not VM resize or arbitrary process termination 11 Request approval Decision Approval to drain, roll back, restart the service 12 Drain VM Write (Azure) Removes the VM from load-balancer rotation 13 Restore prior release Write (Guest OS/DevOps) Restores known-good version or configuration 14 Restart named service Write (Guest OS) Restarts only orders-service 15 Validate recovery Validation CPU, retries, latency, dependencies, health recover 16 Return to rotation Write (Azure) Restores traffic only after successful validation 17 Update/resolve INC Write (ITSM) Drain, rollback, restart, approval, results 18 Create defect Write (ITSM) Retry, backoff, and circuit-breaker remediation Steps 12 and 16 are the pattern to steal: drain before you touch, restore traffic only after validation passes. Most homegrown automation restarts a service while it's still taking traffic and turns a degradation into an outage. Recovery note Release 7.3.1 introduced a retry loop when the inventory dependency failed. After approval, the VM was drained, the previous release was restored, and orders-service was restarted. CPU declined from 98% to 43%, and application latency returned to baseline. Try it yourself Break it: az vm run-command invoke -g $RG -n vm-payments-linux \ --command-id RunShellScript --scripts " nohup bash -c 'while true; do curl -s -m 1 http://127.0.0.1:9/inventory >/dev/null 2>&1; done' & nohup bash -c 'while true; do :; done' & echo started " Ask it: CPU on vm-payments-linux is at 98%. Read-only. First: is this actually anomalous, or is it consistent with this VM's historical pattern for this hour and day of week? Show me the baseline. If anomalous: which process, which dependency is it calling, at what rate, and what deployed immediately before? Do NOT propose killing the top process or resizing the VM. Expect it to propose a drain → restore → restart sequence, with the drain step as a separate approval from the restart. Guardrails Do not automatically terminate the highest-CPU process. It is very often a legitimate workload, and occasionally it's a security incident you just destroyed the evidence for. Allow operations only for named services. Drain before service restart where possible. Escalate unknown or suspicious processes to security rather than remediating them. Limit restart attempts. Do not permanently resize the VM when the evidence points to faulty code. Resizing to survive a retry storm is buying hardware to host a bug. Use case #7 — Windows VM with IIS: memory leak What happened Release ClaimsPortal 5.9.0 introduced a memory leak in the Claims IIS application pool. Memory consumption climbed over several hours, paging began, request queues grew, and IIS returned HTTP 503. How Azure Monitor detected it Azure Monitor Agent collected available memory, committed bytes, paging activity, process working set, IIS request queues, HTTP 500/503 responses, and availability-test results. The alert required sustained abnormal growth, not a brief spike. P1 – Memory exhaustion affecting production IIS application How the agent found the cause Confirmed the VM and monitoring agent were healthy. Compared memory behavior with the historical baseline. Identified the relevant w3wp.exe process. Mapped it to the Claims application pool. Reviewed paging and request queues. Correlated HTTP 503 errors with low available memory. Reviewed Windows Event Logs. Correlated the growth with release 5.9.0. Excluded antivirus and scheduled-reporting activity. Confirmed another instance could carry traffic. Agent finding: Available memory declined from 42% to 4% over three hours. The Claims application pool grew from 1.8 GB to 11.6 GB without releasing memory after traffic normalized. Paging and HTTP 503 errors followed. The pattern began after release 5.9.0. "Without releasing memory after traffic normalized" is the sentence that distinguishes a leak from load. Cache growth under load is normal; failure to return afterwards is not. Agent action table # Action Type Detail 1 Confirm anomaly Read Memory, committed bytes, paging vs. baseline 2 Identify process Read Maps growing w3wp.exe to the Claims pool 3 Analyze IIS health Read Pools, queues, HTTP errors, availability 4 Correlate release Read Links sustained growth to release 5.9.0 5 Rule out other causes Read Excludes scheduled jobs, antivirus, maintenance 6 Assess capacity Read Confirms another instance can serve traffic 7 Create SNOW INC Write (ITSM) P1 against the Claims Portal CI 8 Update INC evidence Write (ITSM) Memory, paging, pool, release, HTTP impact 9 Classify response Decision Targeted recycling, not a full VM restart 10 Request approval Decision Approval to drain and recycle the named pool 11 Drain VM Write (Azure) Removes VM from load-balancer rotation 12 Capture diagnostics Write (Guest OS) Captures approved diagnostics to a protected location 13 Recycle app pool Write (Guest OS) Recycles only the Claims application pool 14 Validate recovery Validation Memory, paging, queues, HTTP errors, availability recover 15 Return to rotation Write (Azure) Restores traffic after health checks pass 16 Update/resolve INC Write (ITSM) Memory before/after, approval, stability 17 Create SNOW PRB Write (ITSM) Memory-leak remediation Step 12 before step 13 matters: recycling the pool destroys the evidence. Capture first. Recovery note Abnormal memory growth was isolated to the Claims application pool following release 5.9.0. The VM was drained, the approved application pool was recycled, and health checks passed before traffic was restored. Available memory increased from 4% to 61%, and HTTP 503 responses stopped. Try it yourself Break it (lab VM only): az vm run-command invoke -g $RG -n vm-claims-win ` --command-id RunPowerShellScript --scripts " Install-WindowsFeature Web-Server -IncludeManagementTools New-WebAppPool -Name 'ClaimsPool' # Simulate the leak \$leak = New-Object System.Collections.ArrayList 1..40 | ForEach-Object { [void]\$leak.Add((New-Object byte[] 100MB)) ; Start-Sleep -Milliseconds 200 } " Ask it: vm-claims-win available memory is at 4%. Read-only. Map the growing process to an IIS application pool. Show me the memory curve for the last 6 hours and tell me whether memory was released after traffic dropped. Correlate with deployment history. Then propose the most targeted possible mitigation — I do not want a VM restart. Expect it to propose: Restart-WebAppPool -Name "ClaimsPool" …and nothing else on that machine. Guardrails Recycle only the named application pool. Avoid full VM restart as the first response — it's a bigger hammer with a longer outage and it destroys the leak evidence. Do not copy memory dumps into ServiceNow. They contain credentials, tokens, and customer data. Store diagnostics in a secured location; put the link in the ticket. Prevent repeated automatic recycling — a pool that needs recycling every 40 minutes is an incident, not a routine. Escalate if the leak returns during the observation period. Use case #8 — Virtual Machine Scale Set: unhealthy instance The most autonomy-ready use case in the list, and the reason is stateless workloads. What happened A configuration extension failed while VMSS instance 17 was being provisioned. The VM was running but its application service never started. The instance failed application health probes and caused intermittent errors. How Azure Monitor detected it Reduced healthy backend count Application Health extension failure Backend health-probe failure VM extension provisioning failure Instance-specific errors Elevated intermittent HTTP 5xx P2 – Unhealthy VM Scale Set instance causing intermittent API failures How the agent found the cause Reviewed the VMSS healthy-instance count. Identified instance 17 as the only unhealthy instance. Reviewed backend health. Compared instance 17 with healthy instances. Checked the image and VMSS model. Reviewed VM extension state. Found the configuration extension failure. Reviewed boot and application diagnostics. Confirmed the workload was stateless. Confirmed eleven instances could carry production traffic. Agent finding: Instance 17 is the only unhealthy member of the 12-instance scale set. Its application health probe has failed since 09:18 UTC. The configuration extension failed during provisioning, and the application service never started. Eleven healthy instances can maintain service. Agent action table # Action Type Detail 1 Investigate VMSS Read Instance health, provisioning state, healthy count 2 Identify instance Read Instance 17 is the only unhealthy member 3 Analyze backend health Read Confirms the instance fails application probes 4 Compare instances Read Image, model, extensions, configuration 5 Find extension failure Read Locates the failed configuration extension 6 Review diagnostics Read Boot, extension, and application diagnostics 7 Assess safe capacity Read Eleven instances can carry traffic 8 Confirm statelessness Decision Replacement won't destroy required local state 9 Create SNOW INC Write (ITSM) P2 against the VMSS/application CI 10 Update INC evidence Write (ITSM) Instance, extension error, health, capacity evidence 11 Classify response Decision Replacement or reimage per approved procedure 12 Request approval Decision Approval to isolate and replace instance 17 13 Isolate instance Write (Azure) Ensures the instance receives no production traffic 14 Preserve evidence Read/Write Stores approved diagnostic evidence securely 15 Replace instance Write (Azure) Reimages or replaces only instance 17 16 Validate provisioning Validation Image, model, and extensions deploy successfully 17 Validate service Validation Backend health, capacity, customer errors recover 18 Update/resolve INC Write (ITSM) Replacement, approval, diagnostics, recovery 19 Create SNOW PRB Write (ITSM) Extension and image-validation improvement work Steps 8 and 7 are the gate. Replacing a stateless instance with eleven healthy peers is genuinely low risk. Replacing a stateful instance, or replacing one when you're already at minimum capacity, is an outage. Both must be confirmed, not assumed. Recovery note VMSS instance 17 was isolated after its configuration extension failed and the application service did not start. Diagnostic evidence was captured, and the instance was replaced after approval. The replacement passed extension, application, and backend health checks. The scale set has returned to 12 healthy instances. Try it yourself Break it: INSTANCE_ID=$(az vmss list-instances -g $RG -n vmss-api-demo \ --query "[5].instanceId" -o tsv) az vmss extension set -g $RG --vmss-name vmss-api-demo \ --name CustomScript --publisher Microsoft.Azure.Extensions \ --settings '{"commandToExecute":"exit 1"}' Ask it: vmss-api-demo has an unhealthy instance. Read-only. Identify which instance, since when, and the specific extension error. Confirm for me: (a) the workload is stateless, (b) how many healthy instances remain, and (c) whether remaining capacity can carry current traffic with 20% headroom. Only if all three are satisfied, propose a reimage of that single instance. Capture diagnostics before proposing anything. Expect it to propose: az vmss reimage -g $RG -n vmss-api-demo --instance-id $INSTANCE_ID Verify it: az vmss get-instance-view -g $RG -n vmss-api-demo --instance-id $INSTANCE_ID \ --query "vmHealth.status.code" az vmss list-instances -g $RG -n vmss-api-demo -o table Guardrails Confirm the workload is stateless before any replacement. Confirm sufficient healthy capacity first. Preserve diagnostic evidence before replacement — the instance is your only copy of the failure. Restrict permissions to the named VMSS. Limit simultaneous replacements. One at a time. An agent that reimages six instances because six probes failed has just caused the outage it was investigating. Do not permit deletion of the entire scale set. Use case #9 — Application Gateway: HTTP 502 from unhealthy backends The cross-component change nobody coordinated. What happened Customer Portal release 9.2 changed the backend listener from port 443 to 8443. Application Gateway remained configured to connect on 443. All backend probes failed and customers received HTTP 502. How Azure Monitor detected it Increased Application Gateway HTTP 502 responses Increased failed requests Four unhealthy backends Reduced healthy-host count Failed synthetic availability tests P1 – Application Gateway returning HTTP 502 due to unhealthy backends How the agent found the cause Reviewed Application Gateway metrics. Retrieved backend health. Identified the affected pool. Reviewed probe path, protocol, host header, and port. Reviewed backend settings. Confirmed the application responded on 8443. Confirmed the gateway used 443. Correlated the mismatch with release 9.2. Reviewed NSG, route, DNS, certificate, and WAF changes. Excluded networking, certificate, and platform-health issues. Agent finding: HTTP 502 responses began at 16:07 UTC. All four Customer Portal backends are unhealthy. Release 9.2 changed the backend listener to port 8443, while Application Gateway continues to use port 443. No NSG, routing, or certificate issue correlates with the incident. Step 9 is what separates a real investigation from a lucky guess. A 502 has at least six plausible causes — NSG, UDR, DNS, expired cert, WAF rule, backend down. The agent has to exclude them, in writing, before you trust the conclusion. Agent action table # Action Type Detail 1 Investigate gateway Read HTTP 502, failed requests, latency, backend counts 2 Inspect backend health Read Identifies four unhealthy Customer Portal backends 3 Review configuration Read Settings, probes, protocol, port, TLS, routing 4 Test backend state Read App responds on 8443 while gateway uses 443 5 Correlate changes Read Links mismatch to Customer Portal release 9.2 6 Rule out networking Read NSGs, routes, DNS, TLS, WAF, platform health 7 Assess blast radius Read Confirms the Customer Portal pool is unavailable 8 Create SNOW INC Write (ITSM) P1 against the portal/gateway CI 9 Update INC evidence Write (ITSM) 502s, backend, port, deployment, known-good configuration 10 Classify response Decision Restore the known-good backend listener 11 Request approval Decision Approval to restore source-controlled configuration 12 Restore listener Write (Application) Restores the application listener to approved port 443 13 Validate backend health Validation All four backends become healthy 14 Validate application Validation HTTP 502 declines; synthetic transactions pass 15 Verify controls Read Confirms no WAF, TLS, routing, or NSG control was weakened 16 Update/resolve INC Write (ITSM) Cause, restoration, approval, recovery 17 Create SNOW CHG Write (ITSM) Coordinated change for the intended port migration 18 Create SNOW PRB Write (ITSM) Cross-component deployment-validation work Step 12 is a genuinely important choice. There were two ways to fix this: change the application back to 443, or change the gateway to 8443. The agent restores the application to the known-good, source-controlled state rather than mutating the gateway to match an unapproved change. One of those is a rollback; the other is ratifying an unreviewed change during an outage. Then step 17 files a proper change record for the migration the team clearly intended to do. Step 15 exists because the fastest way to make a 502 disappear is to disable TLS validation. The agent must prove it didn't take the fast way. Recovery note Customer Portal release 9.2 changed the backend listener from port 443 to 8443 without a coordinated gateway change. The application listener was restored to the previous configuration. All four backends are healthy, HTTP 502 responses returned to baseline, and synthetic login tests passed for 15 minutes. Try it yourself Ask it: appgw-portal is returning 502s and all backends are unhealthy. Read-only. Walk me through the exclusion, explicitly, for each of: NSG, UDR/route table, DNS resolution, backend TLS certificate, WAF rule blocking, backend process down, and probe configuration mismatch. State which you ruled out and the evidence for each. Then tell me the known-good configuration and where it is source-controlled. Verify it: az network application-gateway show-backend-health \ -g $RG -n appgw-portal \ --query "backendAddressPools[].backendHttpSettingsCollection[].servers[].{addr:address,health:health}" -o table Guardrails Do not disable TLS validation. Not to test, not temporarily, not "just to confirm." Do not weaken NSGs or WAF policies as a mitigation. Use source-controlled configuration as the definition of "known-good." Restore a known-good state during the incident; migrate through a change record afterwards. Require approval for gateway or backend changes. Validate full application transactions, not just health probes. A probe returning 200 on /health proves very little. Use case #10 — Azure Service Bus: queue and dead-letter backlog The one that teaches the most important lesson in the entire post. What happened Release fulfillment-worker:6.4.0 couldn't deserialize messages containing a new deliveryWindow field. Consumer throughput dropped by 92%. The active backlog grew rapidly, and incompatible messages entered the dead-letter queue. How Azure Monitor detected it Increasing active-message count Increasing oldest-message age Dead-letter growth Reduced completed-message rate Consumer application errors Delayed downstream business processing P1 – Production order-event backlog delaying fulfillment How the agent found the cause Reviewed active, incoming, outgoing, and dead-letter counts. Calculated message arrival and completion rates. Confirmed the backlog was growing. Reviewed consumer instance health. Reviewed consumer errors and restarts. Checked downstream dependency health. Checked Service Bus authentication and authorization. Correlated the throughput decline with release 6.4.0. Found deserialization errors for the new field. Determined scaling more broken consumers would amplify failures. Agent finding: The order-events queue grew from 3,000 to 185,000 active messages in 35 minutes. Consumer throughput dropped by 92% immediately after release fulfillment-worker:6.4.0. Application logs show deserialization failures involving the new deliveryWindow field. Step 10 is the whole reason to use a reasoning agent instead of an autoscale rule. Every metric here screams "scale out the consumers." An HPA would have done exactly that, and every new replica would have dead-lettered messages faster. Agent action table # Action Type Detail 1 Investigate queue Read Active, incoming, outgoing, scheduled, DLQ counts 2 Calculate flow rates Read Confirms arrival exceeds completion; backlog growing 3 Inspect consumers Read Health, instance count, scaling, errors, dependencies 4 Analyze failures Read Deserialization exceptions involving the new field 5 Correlate release Read Links the 92% throughput reduction to release 6.4.0 6 Rule out Service Bus Read Health, authorization, throttling, networking, service status 7 Assess blast radius Read Backlog age and fulfillment impact 8 Protect message data Decision Prevents payloads or personal data entering ServiceNow 9 Create SNOW INC Write (ITSM) P1 against the fulfillment integration CI 10 Update INC evidence Write (ITSM) Backlog, age, flow, exception, release, business impact 11 Classify response Decision Rollback, not scaling broken consumers 12 Request approval Decision Approval to restore consumer 6.3.7 13 Roll back consumer Write (Azure/K8s) Rolls back through the approved deployment platform 14 Restore capacity Write (Azure/K8s) Restores approved consumer instance count 15 Validate processing Validation Consumer and downstream health 16 Validate backlog Validation Completion exceeds arrival; DLQ growth stops 17 Update INC Write (ITSM) Rollback, rates, estimated drain time, approval 18 Maintain incident Decision Keeps the incident open until backlog age meets the objective 19 Create SNOW CHG Write (ITSM) Separate controlled change for DLQ replay 20 Create SNOW PRB Write (ITSM) Message-contract compatibility remediation Recovery note Consumer release 6.4.0 could not deserialize messages containing the new deliveryWindow field. The fulfillment worker was rolled back to 6.3.7. Consumer throughput recovered, new dead-letter growth stopped, and the active backlog is draining at approximately 7,500 messages per minute. Dead-letter replay requires a separately approved procedure. The lesson: technical recovery is not business recovery Step 18 is the most important row in this entire post. At the moment of rollback, every technical signal is green. Consumers are healthy. Throughput has recovered. The DLQ has stopped growing. An agent optimizing for metrics would resolve the incident right there and go back to sleep. But there are still 185,000 unshipped orders and a dead-letter queue full of messages that need a separately approved replay procedure. Customers are still affected. The incident stays open until backlog age meets the business objective, not until the graphs look nice. Encode this in the response plan explicitly: Do not resolve this incident when consumer health recovers. Resolution criteria: 1. Completion rate exceeds arrival rate for 15 consecutive minutes, AND 2. Oldest active message age is under 5 minutes, AND 3. Dead-letter count has not increased for 30 minutes. DLQ replay is out of scope for this incident. File a separate change record. Try it yourself Break it: # Flood the queue while no consumer is running for i in $(seq 1 5000); do az servicebus queue message send -g $RG --namespace-name sb-sre-demo \ -q order-events --body "{\"orderId\":$i,\"deliveryWindow\":\"2026-08-09T10:00Z\"}" 2>/dev/null done az servicebus queue show -g $RG --namespace-name sb-sre-demo -n order-events \ --query "countDetails" -o json Ask it: order-events on sb-sre-demo has a growing backlog. Read-only. Give me: arrival rate, completion rate, current active count, oldest message age, DLQ count and DLQ growth rate, and the projected drain time at current rates. Then tell me why scaling out consumers is or is not the correct action here. Do not include any message payloads or customer data in your answer. That last line is not optional. Message bodies routinely contain names, addresses, and payment references — and everything the agent writes goes into a ticket. Verify it: az servicebus queue show -g $RG --namespace-name sb-sre-demo -n order-events \ --query "{active:countDetails.activeMessageCount, dlq:countDetails.deadLetterMessageCount}" -o json Guardrails Never automatically purge queues. Do not automatically replay dead-letter messages. Replay without idempotency guarantees means duplicate charges and duplicate shipments. Do not place message payloads in ServiceNow. Confirm idempotency before replay. Scale consumers only when the processing path is healthy. Require separate approval for replay or queue configuration changes. Keep the incident open until business recovery is confirmed. 7. The ITSM integration model Recommended incident fields Field Example Short description Production Orders API pods failing after deployment Configuration item prod-aks-orders-api Assignment group Container Platform Operations Impact High Urgency High Environment Production Azure resource ID Full affected Azure resource ID Azure alert ID Azure Monitor alert correlation identifier SRE investigation Link to the SRE Agent investigation thread Current impact Eight of ten replicas unavailable Probable cause Missing configuration in latest release Confidence High Proposed action Roll back to revision 41 Approval Approver and UTC timestamp Validation Ten replicas ready and synthetic tests passing Resolution Service restored through rollback The Confidence field earns its place. An agent that says "probable cause: missing configuration (confidence: low)" is far more useful than one that always sounds certain, because it tells the human how much to verify before approving. Fields the agent can set directly (preview): assignment_group , category , subcategory , impact , urgency , priority , short_description , and any custom u_* field. It cannot change incident state through field updates — acknowledge and resolve are separate, dedicated tools. Recommended agent-generated timeline Every work note should carry: Element Example Timestamp 2026-03-18 14:26 UTC Observation HTTP 500 rate increased to 18% Evidence Link to the Application Insights query Change correlation Incident started three minutes after deployment Probable cause Missing production application setting Confidence High Proposed action Swap to previous healthy slot Risk Temporary deployment rollback Approval Incident commander and timestamp Execution Slot-swap operation and result Validation 5xx below 1% for 15 minutes Follow-up Problem record for configuration validation Note that Evidence is a link, not a paste. This is a deliberate data-protection pattern: the ticket carries a pointer to the query, and the query results stay in the system that already has the right access controls. Deduplication strategy Do not create one incident per alert, pod, queue, or VMSS instance. Correlate on: application/business service + Azure resource ID + environment (production) + alert-rule family + active incident time window Related alerts attach to the existing incident as evidence or child alerts. Azure Monitor already merges recurring alerts into a single thread when it's the bound platform; for ServiceNow, this correlation key is yours to implement. Get this wrong and your first AKS incident produces eight incidents, eight investigations, and eight rollback proposals for the same deployment. Record responsibilities Record Purpose Example Incident (INC) Restore service quickly and safely App Service HTTP 500 outage Problem (PRB) Identify and remove the underlying cause Missing deployment configuration validation Change (CHG) Govern permanent or higher-risk production changes Coordinated Application Gateway port migration Engineering defect/task Correct application or automation behavior Add retry backoff to the Linux application The agent must clearly distinguish temporary mitigation from permanent correction. Every single use case above ends with a follow-up record, and that's not bureaucratic theatre — an agent that mitigates flawlessly and never files a problem record is an agent that lets the same outage recur forever while making the metrics look great. 8. Reality check: where you have to build This is the section that will save you a month. The PDF this post is built from is explicit that these are target response patterns, not guaranteed zero-configuration behavior. Having now checked each pattern against the product documentation, here is exactly where the gaps are and what fills them. # The pattern assumes What's actually documented What you must build 1 Agent creates a ServiceNow INC ServiceNow is an inbound platform. Documented writes: post discussion entries, acknowledge, resolve, plus field updates (preview) Incidents should originate in ServiceNow (via its own Azure Monitor integration) and flow in. If you truly need agent-initiated creation, add a Python tool or MCP server against the ServiceNow Table API 2 Agent creates PRB / CHG / defect records Not a documented first-class ServiceNow action Same: a custom tool against /api/now/table/problem and /change_request . This is ~30 lines of Python and worth doing properly, with a least-privileged integration user 3 ServiceNow and PagerDuty both connected Only one incident platform active at a time; switching disconnects the other Bind the agent to your system of record (ServiceNow). Reach the pager through a connector, Teams/Slack, or a webhook 4 Agent runs guest-OS cleanup ( rm , rotate, restart) delete and remove commands are blocked outright. az keyvault blocked. Management locks respected Wrap all guest-OS work in fixed-purpose Azure Automation runbooks or a constrained az vm run-command script, invoked with allowlisted parameters. See use case #5 5 Agent "pauses the release pipeline" Requires the GitHub or Azure DevOps connector, plus permissions on that pipeline Connect source control; grant pipeline permissions explicitly; test the pause path before you need it 6 Approval gate on every action Review mode shows Approve/Deny only for Azure infrastructure operations. Emails, Teams posts, and external queries proceed on the agent's reasoning Use hooks or tool access policies to gate non-Azure actions 7 Agent resolves incidents Supported — but during a pilot you don't want it Require human confirmation before resolve. Encode it in the response plan and enforce it with a Stop hook 8 One agent handles everything Response plans route to custom agents; skills cap at five concurrent active Build domain specialists (§4.6). A single mega-agent thrashes its skill budget 9 Autonomous mode by default is fine Per-plan default is Autonomous, and connecting a platform auto-creates an autonomous quickstart_handler Delete the quickstart plan. Set every plan to Review explicitly 10 Agent has broad subscription rights You can't remove individual permissions — only whole resource groups Design resource groups as blast-radius boundaries before onboarding None of these are blockers. All of them are a week of work you'd rather discover now than during your pilot readout. 9. Approval and autonomy policy The policy I would actually ship: Action category Recommended initial policy Read metrics, logs, traces, resource health Automatic Correlate deployments and configuration changes Automatic Create a ServiceNow incident Automatic after deduplication Add sanitized work notes Automatic Prepare a remediation plan Automatic Create a draft ServiceNow change Automatic, but not approve it Modify an Azure production resource Human approval required Execute a VM guest runbook Human approval required Roll back an application Human approval required Delete or replace a stateless VMSS instance Human approval required Resolve a ServiceNow incident Human confirmation during the pilot Delete data, purge queues, replay DLQ messages Separate explicit approval Autonomous remediation Only after a proven, bounded pilot Two notes on making this real: Start in Review and stay there longer than feels necessary. The documented recommendation is to observe for two to four weeks and then promote specific triggers you consistently approve. Not the agent — the triggers. Promotion should be per-response-plan and evidence-based: "we approved this exact rollback proposal eleven times without modification" is a reason to go autonomous. "It seems good" is not. Autonomy should be earned per action type, not per environment. "Autonomous in staging" is a fine starting rule, but the durable version is "autonomous for VMSS single-instance reimage where the workload is stateless and healthy capacity exceeds 80%" — a narrow, well-characterized action with a mechanical precondition. 10. Cross-cutting security controls Use a dedicated managed identity for SRE Agent. Scope Azure roles to selected resources or resource groups. Avoid broad Contributor and Owner assignments. Use fixed-purpose Automation runbooks for guest operations. Do not provide unrestricted SSH, shell, or PowerShell execution. Use a dedicated least-privileged ServiceNow integration identity. Prefer OAuth or a managed connector over stored credentials. Store required secrets in Key Vault — never in prompts. (The agent blocks az keyvault commands entirely, which helps.) Sanitize logs before posting them into ServiceNow. Do not post tokens, personal data, SQL text, message payloads, or memory dumps. Record every approval and production action. Define remediation cooldowns and maximum retry counts. Require post-action application validation. Retain existing manual runbooks as fallback. Use Azure Cost Management alerts for temporary scaling actions. What the platform gives you for free Worth knowing so you don't rebuild it: Layer Isolation model Compute Dedicated sandbox (micro VM) per agent; tool execution separate from the reasoning loop Database Separate database per agent Blob storage Separate blob storage per agent Network Per-agent proxy instance validating every outbound request Credentials Identity sidecar issues short-lived, per-call tokens; credentials never enter the reasoning context Token lifetimes: managed identity ~1 hour (auto-refreshed), OAuth refreshed 20 minutes before expiry, per-tool-call action tokens are single-use, blob SAS 1 hour refreshed at 45 minutes. Each tool invocation launches a fresh process whose entire tree terminates on completion — there are no persistent process pools, so one tool call cannot see another's environment. The audit trail Every az command is logged to your Application Insights as an AgentAzCliExecution custom event. This is your evidence for change management: customEvents | where name == "AgentAzCliExecution" | where timestamp > ago(30d) | project timestamp, command = tostring(customDimensions.command), resource = tostring(customDimensions.resourceId), succeeded = tostring(customDimensions.success), thread = tostring(customDimensions.threadId) | order by timestamp desc Run that query in front of your auditor once and most of the "but can we prove what it did" conversation ends. 11. A 30/60/90 pilot that survives contact with your CAB Phase Enabled capability 1 Detect Azure Monitor alerts 2 Create or correlate ServiceNow incidents 3 Perform read-only investigation 4 Add sanitized findings to ServiceNow 5 Recommend remediation without execution 6 Execute bounded actions after approval in Review mode 7 Validate technical and business recovery 8 Prepare incident resolution and follow-up records 9 Consider autonomy only for proven low-risk actions Phases 1–5 have zero production write risk and deliver most of the MTTR reduction. Do not rush past them to get to the demo-friendly part. The best first five candidates App Service deployment-slot rollback — clean trigger, reversible action, unambiguous validation AKS deployment rollback — same shape, one GitOps caveat VMSS unhealthy-instance replacement — stateless, bounded, easy precondition check Restricted VM disk-recovery runbook — high toil, high value, forces you to build the runbook pattern properly Automatic ServiceNow incident creation and timeline updates — the compounding one; every incident from here on is better documented than any incident before it These five share the properties you want: clear triggers, tightly bounded actions, measurable validation criteria, and practical escalation paths. What to measure in week one Before you enable a single write action, capture your baseline: Median time from alert to first accurate human diagnosis Percentage of incidents where the first hypothesis was wrong Median time from diagnosis to mitigation Percentage of incidents with a complete timeline in the ticket Percentage of incidents that produced a follow-up problem record The read-only phase moves the first, second, and fourth of those immediately. If it doesn't, your telemetry is the problem, not the agent — and that's a genuinely useful thing to discover in week one rather than week twelve. 12. Measuring whether it's actually working Under Monitor → Incident metrics: Metric What it shows Incidents reviewed Total incidents the agent processes Mitigated by agent Resolved autonomously Assisted by agent Agent helped; a human completed it Mitigated by user Human resolved using agent-provided information Pending user action Waiting on a human The counter-intuitive read: "Assisted by agent" and "Mitigated by user" are the healthy numbers during a pilot. A high "Mitigated by agent" count in month one means someone left autonomy on. Watch Pending user action closely. A growing queue there means either your approval routing is broken or the agent is proposing things nobody is comfortable approving — both are important signals, and both are invisible without this dashboard. Also check Monitor → Session insights periodically. Each insight card links back to the thread that generated it, so you can trace any learned pattern to its origin. If the agent has learned something wrong, this is where you find it — and #forget is how you fix it. 13. Resources Core documentation Overview of Azure SRE Agent Security and trust model Agent permissions Run modes Incident response Incident management platforms Incident response plans ServiceNow incident indexing Root cause analysis Execute mitigations Extensibility Custom agents Skills Agent hooks Scheduled tasks Memory and knowledge Closing The framing that makes this work isn't "AI runs my production." It's this: Your agent is the most junior person on the rotation — and the most thorough. It will never skip the Resource Health check. It will never forget to compare against the previous slot. It will never write "restarted it, seems fine" in a work note at 4 AM. And it will never, ever be allowed to rm -rf anything. Every guardrail in this post exists to keep it in that role. Scope the identity to resource groups. Keep production writes in Review. Wrap guest-OS work in runbooks with allowlists. Never let it purge a queue or replay a dead-letter message on its own. Keep the incident open until customers are actually served, not until the graphs look nice. Do that, and the ten workflows above stop being a slide deck and start being your Tuesday. Start with use case #1. One App Service, one slot, one alert rule, one response plan in Review mode. Watch it assemble an evidence chain you'd have spent twenty minutes building by hand, and then decide how much further you want to go. The ten scenarios in this post are target response patterns. Each one requires appropriate telemetry, scoped Azure RBAC, response-plan instructions, approved remediation tooling, and ITSM integration. Confirm current Azure SRE Agent and ServiceNow connector capabilities against Microsoft documentation before implementing — the product is moving quickly, and several capabilities referenced here are in preview.556Views1like0CommentsAzure OpenAI Architecture: The Decisions That Actually Matter (Part 3)
Introduction Part 1 of this series tackled the architectural decisions that shape any Azure OpenAI / Microsoft Foundry Models workload — capacity model, deployment scope, governance layer, grounding strategy, and quota engineering. Part 2 turned those decisions into a Well-Architected Framework discipline. Part 3 looks at the part that makes GenAI architecture genuinely different from a traditional service: the platform itself never stops moving. Models are released, promoted to GA, moved to Legacy, deprecated, and eventually retired. New regions come online; certain features (such as Priority Processing) light up only on specific model versions and deployment scopes. Fine-tuned models inherit the lifecycle of their base. Performance characteristics shift between releases. Reliability in this world is not just uptime — it is the ability to absorb continuous change without disrupting production. That discipline is GenAIOps: the people, processes, and tooling that turn model upgrades from emergency events into routine operations. Part 2 already covers the core lifecycle mechanics and upgrade policy trade-offs through a Well-Architected lens. Part 3 stays focused on the operational and architectural practices that make change safe: evaluation of pipelines, observability, routing patterns, prompt governance, and abstraction. Where details are time-sensitive — stage thresholds, SLA windows, regional rollout delays, capacity tier eligibility — they are flagged with "At the time of writing". Always confirm current behavior against Microsoft Learn before committing to a design. Who is this series for? Cloud and Solution Architects Platform and product owners Senior developers responsible for operating Azure OpenAI workloads in production What you’ll learn in Part 3: How to build an evaluation pipeline that promotes model upgrades the way CI/CD promotes code. How to instrument full-stack observability so regressions surface early (latency, errors, token trends, quality drift). How the Model Router pattern, canary releases, and tier-aware fallbacks turn model change into a configuration concern. How to govern prompts as production artifacts with versioning, feature-flagged rollouts, and regression testing. How to manage lifecycle-dependent assets (fine-tuned models) and regional rollout realities without firefighting — plus a GenAIOps Decision Matrix you can reuse as a checklist. We’ve also included a summary decision matrix at the end of this post for quick reference. 1. Model lifecycle (recap) Azure OpenAI/Microsoft Foundry models are living dependencies: new versions are released, promoted from Preview to GA, then eventually move through deprecation toward retirement. To avoid surprises, treat every deployed model version as having an expiration date and design so you can swap versions without rewriting application code. In general, use the Standard deployment auto-upgrade mode that preserves stability but guarantees continuity at retirement, and plan to deliberate blue/green migrations for dedicated (provisioned) capacity where auto-upgrade is not available. For the deeper mechanics (upgrade modes, retirement behavior, and migration playbooks), refer to Part 2’s Reliability section; the rest of this article focuses on the GenAIOps practices that make those upgrades routine. Figure 1 — Models lifecycle 2. GenAIOps: Evaluating Before Promoting Upgrading a model should not be a manual, subjective exercise. Azure AI Foundry provides evaluation capabilities that, combined with a regression prompt suite, turn model upgrades into measurable, repeatable decisions: Side-by-side prompt comparisons across model versions. Automated quality scoring (relevance, coherence, groundedness, safety, and fluency). Structured-output validation (JSON conformance, schema validation). Batch testing across comprehensive prompt libraries representative of real production traffic. Custom evaluation metrics tailored to your domain. Architectural best practice: Maintain a curated regression prompt suite that mirrors real production traffic — including the long tail. Run evaluation pipelines against candidate models before any production cut-over. Integrate evaluation into CI/CD using Azure DevOps, GitHub Actions, or similar automation. Define quality gates that must pass before promotion (e.g., groundedness ≥ a target threshold, p95 latency under a target budget). Pick numbers that fit your workload, not the article. Model promotion should require passing the evaluation gates the same way application code requires passing unit tests. Without automated evaluation, model upgrades become high-risk, low-visibility events that teams avoid until forced by retirement deadlines — the exact pattern that keeps lifecycle work in the "emergency" column instead of the "scheduled" column. Example evaluation workflow: Trigger — a new model version reaches GA, or your migration playbook hits the R-90 step. Deploy — the candidate model goes to a staging deployment. Regress — the prompt suite (typically several hundred to several thousand prompts) is run against the candidate. Compare — the candidate's outputs are scored against the current production model. Inspect — humans review flagged differences; metrics, latency distributions, and cost-per-request go on the dashboard. Gate — an approval step (manual or automated) decides whether the candidate proceeds to blue/green production deployment. Figure 2 — Evaluation Pipeline 3. Observability: Full-Stack or It Didn't Happen GenAIOps is more than one-time evaluation. Once a candidate's model has been promoted, you need continuous, end-to-end observability across the request path — not just at the model boundary. Without it, you are operating blind during model transitions. At a minimum, instrument: Prompt processing time (gateway through model invocation). Model inference latency, expressed as p50, p95, and p99 — averages hide the experience of the slowest 5% of users. Token consumption (prompt tokens, completion tokens, total) trended over time. Error rates by class (429 throttling, 503 service unavailable, 400 validation errors, content-filter rejections). Model version distribution — which versions are actually serving traffic right now. User-satisfaction signals (thumbs-up/down, explicit feedback, session abandonment). Many performance regressions only surface at scale. A model version that performs well in evaluation against a few hundred prompts may behave differently under production traffic patterns. Plan for that. A practical metrics architecture on Azure tends to combine: Application Insights for end-to-end request tracing across the application and gateway. Azure Monitor for infrastructure, quota, and PTU utilization of metrics. Custom telemetry for prompt-level success/failure tracking and quality scoring. Log Analytics for forensic analysis when a regression is suspected. Drift in model behavior rarely shows up as a single broken request — it surfaces as a slow shift in tail latency, fallback rate, or user-satisfaction signal. Monitoring that only looks at average will miss it. 4. The Model Router Pattern As GenAI systems mature, a static single-model architecture becomes both limiting and expensive. A Model Router introduces dynamic, intelligent model selection in front of one or more model deployments. Typical responsibilities of a router: Send simple queries to a smaller, faster model and complex reasoning to a larger one. Run canary releases of new model versions with percentage-based rollouts. A/B test model variants to measure quality, latency, and cost differences. Route to the right capacity tier — including falling back from Provisioned to Standard during migrations or capacity constraints. Where the workload also needs lower-variance latency on the Standard side, route latency-critical traffic through Priority Processing on a Global Standard or Data Zone Standard (US) deployment, on a model version that supports it. (At the time of writing, Priority Processing is enabled by setting the service_tier attribute on the request and requires a model version released on or after 2025-12-01 — verify both eligibility constraints on Microsoft Learn before depending on it. Decision logic can be driven by any combination of: Query complexity (simple heuristics or a lightweight classifier). User tier (e.g., free vs premium). Response-time requirements (interactive vs background). Cost constraints — pick the cheapest model that meets the quality bar. Regional model availability and capacity. Implementation options: Azure API Management — built-in routing policies, weighted backends, retry policies. Azure Front Door — global routing with health probes. Custom routing service — maximum flexibility, more operational overhead. Semantic Kernel or LangChain — framework-level routing logic embedded in the application. Beyond cost and performance, the Model Router pattern decouples the application layer from any single model version. That decoupling is what makes lifecycle management tractable: when a model moves to Legacy, you change a router rule, not application code. Figure 3 — Model Router Architecture vs Blue/Green Deployment 5. Prompt Lifecycle Governance Prompts are not strings embedded in code. They are production artifacts that influence quality, cost, and safety, and they evolve almost as often as the models behind them. Treat them as first-class assets. Prompt templates Separate stable system instructions from dynamic content (user input and retrieved context). This lets you version, test, and audit each layer independently. Version control Store prompts in Git — full history, code review, branching, and tagging. Treat prompt changes the way you treat code changes: pull request, review, and test before merging. Feature-flagged rollouts Roll out prompt changes gradually using feature flags. Monitor the impact on a subset of users before exposing the change broadly. The same observability stack that watches model upgrades should watch prompt rollouts. Regression testing Maintain a regression suite of expected prompt behaviors and run it whenever prompts or models change. The suite reuses the same evaluation pipeline you built in Section 2. Prompt-level metrics Success rate — did the prompt achieve its intended outcome? Fallback rate — how often did users rephrase or abandon? Satisfaction score — explicit user feedback. Token efficiency — average tokens per successful completion (a leading indicator of cost regression). PII and privacy safeguards Customer prompts and completions are not used to train base models. That means logging is safe for debugging — but defense in depth still applies: Redact PII (names, emails, phone numbers, addresses) before logs are written. Apply RBAC on Log Analytics workspaces so only the right roles can access raw prompt data. Govern data retention with automated purging after a defined window. Keep audit trails of who accessed which logs and when. Prompt quality is not a one-time effort. It is an ongoing operational discipline that needs tooling, processing, and measurement, in the same way application code does. Figure 4 — Prompt Lifecycle Governance 6. Fine-Tuned Models: The Hidden Retirement Risk Fine-tuned models inherit the lifecycle of their base model. That creates a cascading retirement risk that many teams overlook. During base-model deprecation: New fine-tuning jobs against that base are blocked — you can no longer create new fine-tuned versions. Existing fine-tuned deployments continue serving inference, with no immediate impact. When the base model is retired: Fine-tuned deployments stop responding (HTTP 404), exactly like any other deployment pinned to a retired version. The migration imperative is straightforward: retrain fine-tuned models on the successor base model well before the retirement date, ideally during the predecessor's Legacy or Deprecated stage. Architectural considerations: Track base-model dependencies explicitly in your asset inventory — the same place you track library and runtime versions. Schedule retraining workflows aligned with base-model lifecycle dates, not with team availability. Validate fine-tuned model quality on the new base; behavior can shift between base versions. Keep training datasets in version-controlled storage, so retraining is reproducible. Re-evaluate whether fine-tuning is still necessary; newer base models, combined with better prompting (few-shot, chain-of-thought, structured outputs), sometimes remove the need entirely. Common mistake: investing heavily in fine-tuning without budgeting for the recurring retraining cost and lifecycle overhead. Improved prompting on a newer base model is often the cheaper path. 7. Regional Rollouts and Multi-Region Strategy Successor models are not always available in every Azure region simultaneously. Microsoft typically releases a new version in a subset of regions first, with broader rollout following over weeks or months. At the time of writing, the regional rollout schedule is published per model on Microsoft Learn — confirm before assuming a particular region will receive a release on a particular day. Maintain staging deployments in early-release regions Even if production runs elsewhere, maintain a staging deployment in regions that tend to receive new models earliest. That gives you visibility into the successor's behavior before it auto-upgrades into your primary region. Pre-test successor models before primary auto-upgrades If your production deployment uses "Once the current version expires", the upgrade will happen automatically. Pre-testing in an early-release region lets you catch behavioral changes before they hit live traffic. Multi-region routing for lifecycle flexibility Azure Front Door or Azure API Management with multi-region back-ends lets you route based on model availability, capacity headroom (one region may have quota while another is exhausted), and latency. Combined with the Model Router pattern from Section 6, this turns regional staggering from a constraint into an option. Account for capacity-tier eligibility in your routing Some capacity tiers are scoped to specific deployment scopes — Priority Processing, for example, is offered on Global Standard and Data Zone Standard (US) deployments at the time of writing. Bake those eligibility constraints into routing rules, so a fallback path does not silently land in an ineligible deployment. Multi-region strategy is no longer just a disaster-recovery concern. It is also lifecycle resilience — the ability to test, stage, and absorb model changes without coupling your platform to a single region release schedule. 8. Future-Proofing Through Abstraction Future-proofing is architectural, not procedural. The goal is to design systems that adapt to change without requiring code rewrites every time a model is promoted, deprecated, or retired. Abstract model calls behind a service layer Avoid calling Azure OpenAI APIs directly from the application code. Introduce an internal Model Service that owns model selection, retry and fallback, prompt-template lookup, and response validation. The application asks for an outcome ("summarize this", "classify that"); the Model Service decides which model and which prompt to use. Externalize model names and configuration Store model identifiers, versions, and parameters in configuration or feature flags — never as hard-coded strings. Changing models then becomes a configuration change, not a deployment. Centralize prompt logic Maintain prompts in a registry or template repository, not scattered across codebases. This enables centralized versioning, A/B testing without code changes, and prompt optimization that is decoupled from application releases. Avoid scattering model identifiers across the codebase Use constants, enums, or configuration references rather than literal model strings repeated across many files. The number of files that have to change at upgrade time is a leading indicator of how painful the upgrade will be. Benefits of abstraction: Seamless model replacement — swap models without touching application logic. Multi-model strategies — the Model Router pattern becomes trivial to add. Provider flexibility — integrating additional or alternative providers becomes a service-layer change, not an application to rewrite. Faster adoption of new capabilities — reasoning controls, function calling, structured outputs land in one place. Common mistake: Prototyping with direct API calls for speed and never refactoring. The technical debt accumulates until a model upgrade requires an emergency engineering sprint. Figure 5 — Abstraction Layer for Future-Proofing. Final Perspective The most important shift this article asks for is a change in operational mindset: Model upgrades are not emergencies. They are scheduled events. Retirement deadlines are not surprising. They are published timelines, often with months of notice. Architecture fails when teams treat models as static dependencies. They succeed when they treat models as evolving infrastructure. In practice, GenAIOps means: Automated evaluation that runs continuously, not just during migrations. Controlled rollouts using blue/green or canary patterns. Observability-driven decisions based on metrics, not intuition. Lifecycle-aware planning, with retirement dates tracked alongside library and runtime upgrades. Modular design that decouples applications from specific model versions. Across the three parts of this series we have covered the architectural decisions that frame an Azure OpenAI / Microsoft Foundry Models workload (Part 1), the Well-Architected Framework discipline that keeps it sustainable (Part 2), and the GenAIOps practices that let it evolve without firefighting (Part 3). The organizations that succeed long-term are the ones that plan for model evolution from day one, invest in evaluation and observability tooling, decouple application logic from model specifics, and treat prompts and configurations as versioned artifacts. Generative AI architecture is not about deploying a model endpoint. It is about building a platform that absorbs change gracefully as the AI landscape shifts. The retirement of a model should be a routine operational event, not a crisis. If your architecture makes model upgrades feel risky or expensive, refactor before the next retirement deadline forces your hand. Lifecycle & GenAIOps Decision Matrix Use this as a checklist when reviewing or signing off on the GenAIOps posture of an Azure OpenAI / Microsoft Foundry Models platform. One row per decision; one rule of thumb per row. Area Decision Rule of thumb Watch out for Lifecycle Version expiry tracking Treat model versions as expiring dependencies: inventory every deployed model/version, track deprecation/retirement dates, and design so swapping versions is a configuration change (details on upgrade modes in Part 2). Pinning versions without an owner; discovering retirement dates after an outage or emergency migration window. Evaluation Promotion gates Pass the regression suite + meet domain-specific quality and latency thresholds before promoting any model. Subjective "feels better" sign-off; gates that exist on paper but never block a release. Evaluation Pipeline integration Evaluation runs in CI/CD on every candidate; the same suite watches prompt changes. Manual evaluation runs that only happen under retirement pressure. Observability Latency and error metrics Track p50/p95/p99 latency, 429/503/4xx rates, token trend, and model-version distribution. Alert on tail latency and sustained throttling. Average-only dashboards; missed Service Health notifications for model retirements. Observability Quality drift Trend per-prompt success rate, fallback rate, and user-satisfaction signals; surface drift before users complain. Treating quality as a one-time evaluation event. Architecture Model Router Centralize model selection, canary, and fallback (including Priority Processing on eligible deployments) behind a router service. Application code that calls a specific model deployment by name; routing logic scattered across services. Architecture Abstraction layer Application code asks for an outcome; the Model Service decides which model and prompt; configuration drives model selection. Hard-coded model identifiers across many files; bypass paths that skip the service layer. Prompts Prompt governance Prompts in Git, behind feature flags, with regression tests, prompt-level metrics, and PII redaction in logs. Prompts copy-pasted across services; PII in logs; no rollback path for a regressed prompt. Fine-tune Fine-tuned model lifecycle Track fine-tuned models against base-model dates; schedule retraining during the predecessor's Legacy/Deprecated window. Treating fine-tuned models as permanent infrastructure; lost or unversioned training datasets. Regional Multi-region for lifecycle resilience Maintain staging in early-release regions; route across regions to absorb staggered rollouts and capacity gaps. Single-region production with no early-release staging; routing rules that ignore tier-eligibility constraints. Disclaimer I am a Microsoft employee. The views and opinions expressed in this article are my own and do not necessarily reflect those of Microsoft. This content is informational and educational; it is not an official Microsoft statement, recommendation, or commitment. Service tiers, model availability, lifecycle stages, deprecation timelines, regional rollouts, pricing, and SLAs evolve — always validate against the latest Microsoft Learn documentation before making architectural or migration decisions. References Azure OpenAI model deprecations and retirements Working with Azure OpenAI models — versioning and upgrades Provisioned throughput for Azure OpenAI Enable Priority Processing for Microsoft Foundry Models Azure AI Foundry — evaluation of generative AI applications Monitor Azure OpenAI Azure API Management — GenAI Gateway capabilities Azure Front Door routing for AI back-ends Use managed identities with Azure OpenAI Azure AI Content Safety Fine-tune models with Azure OpenAI Azure Well-Architected Framework463Views0likes0CommentsAzure Availability Zone Mapping and VM Resilience Analysis Guidance using SRE.AZURE.COM Agent
Overview This guidance, supported and tested using SRE.Azure.com, helps Azure platform engineers understand how Availability Zones are mapped within their subscription and how virtual machines (VMs) are distributed across those zones. SRE.Azure.com enables discovery and analysis of zone mappings, VM placement, and infrastructure resilience. Why This Matters Azure uses logical zones (1, 2, 3), but these map differently to physical datacenter zones (az1, az2, az3) in each subscription. This means workloads in the same logical zone across subscriptions may not be physically co-located. Understanding this is critical for high availability, disaster recovery, compliance, and resilience planning. Example sub-prod-eastus-01 -> Zone 1 → az3 sub-prod-eastus-01 -> Zone 2 → az1 sub-prod-eastus-01 -> Zone 3 → az2 sub-prod-weu-01 -> Zone 1 → az1 sub-prod-weu-01 -> Zone 2 → az2 sub-prod-weu-01 -> Zone 3 → az3 Key takeaway: Logical zone numbers do not guarantee physical separation across subscriptions. What SRE.Azure.com agent Enables - Discover logical-to-physical zone mappings - Analyze VM distribution across zones - Identify resilience gaps - Generate presentation-ready reports Suggested Prompt “Act as an Azure platform engineer and generate a clean, presentation-ready analysis for availability zone design. For Azure subscription <subscription-id>, produce two outputs inline in chat. Output 1 — Zone Mapping Summary - Query Azure directly for region availability zone mappings - Show how logical zones map to physical zones - Include a takeaway and tables Output 2 — VM Resilience Distribution - List VMs with zone, physical mapping, and protection level Formatting: - Use markdown tables - No raw JSON - Screenshot-friendly layout - End with 3 observations” Example output: And so on …… Next Steps: Get Started | Azure SRE Agent What is SRE Agent? | Azure SRE Agent350Views2likes0Comments🎉 Save the Date: FY26 Fabric Partner Community Year‑End Celebration
As we prepare to wrap up FY26, we’re closing the year the same way we built it — together. This year‑end celebration will be held as part of the final Fabric Engineering Connection calls of FY26, giving us space to pause, look back on what we built together, and celebrate the partners who make this community what it is. 🌎Americas & EMEA Wednesday, June 24 | 8:00–9:00 AM PT 🌍APAC Thursday, June 25 | 1:00–2:00 AM UTC / Wednesday, June 24 | 5:00–6:00 PM PT) ✨ What to expect: A look back at the moments that defined FY26 along with partner updates to take you into FY27 Fun & games — including a Mad Libs–style community story built live by partners A community toast and a few surprises along the way 👉 Important: This call is open to members of the Fabric Partner Community on Microsoft Teams. If you’re not already a member, you can join here: https://aka.ms/JoinFabricPartnerCommunity This isn’t just a year‑end recap. It’s a thank‑you to the partners who showed up, shared openly, asked great questions, and helped each other grow real Microsoft Fabric practices. Mark your calendars. We can't wait to celebrate with you! 🥳 🥂119Views1like0Comments