connection pooling
7 TopicsLesson Learned #455:Optimizing Connection Pooling for Application Workloads: Thread Contention
This week, I have been working on a support case where our client experienced a 5-second delay in database connectivity. They were measuring this using StopWatch. As they informed me, they were launching a series of processes, 50-100 concurrent processes to be precise. I would like to share the experience gained in understanding the reasons behind this 5-second delay.4.3KViews1like0CommentsLesson Learned #453:Optimizing Connection Pooling for Application Workloads: A single journey
In recent days, we have received several requests how to reduce the latency of a connection for an application designed to check database availability for receiving requests. I would like to share with you my experience, along with other articles that will be published shortly.3.1KViews1like0CommentsLesson Learned #38: Which is the impact using connection pooling in my application
First published on MSDN on Mar 30, 2018 In this video in Spanish and English we are going to show you an example about which is the impact to use or not connection pooling, using a C# application.2.4KViews0likes0CommentsLesson Learned #519: Reusing Connections in Azure SQL DB: How Connection Pooling Caches Your Session
A few days ago, I was working on a case where a customer reported an unexpected behavior in their application: even after switching the connection policy from Proxy to Redirect, the connections were still using Proxy mode. After investigating, we found that the customer was using connection pooling, which caches connections for reuse. This meant that even after changing the connection policy, the existing connections continued using Proxy mode because they had already been established with that setting. The new policy would only apply to newly created connections, not the ones being reused from the pool. To confirm this, we ran a test using .NET and Microsoft.Data.SqlClient to analyze how the connection pool behaves and whether connections actually switch to Redirect mode when the policy changes. How Connection Pooling Works Connection pooling is designed to reuse existing database connections instead of creating a new one for every request. This improves performance by reducing latency and avoiding unnecessary authentication handshakes. However, once a connection is established, it is cached with the original settings, including: Connection policy (Proxy or Redirect) Authentication mode Connection encryption settings This means that if you change the connection policy but reuse a pooled connection, it will retain its original mode. The only way to apply the new policy is to create a new physical connection that does not come from the pool. Testing Connection Pooling Behavior For Testing the connection pooling behavior, I developed this small code in C# that basically, opens the connection, provides information about the port using and close the connection. Repeating this process 10000 times. The idea was to track active connections and check if the port and connection policy were changing after modifying the connection policy. Initially, I attemped to use netstat -ano to track active connections and monitor the local port used by each session. Unfortunately, in Azure SQL Database, local port information is not reported, making it difficult to confirm whether a connection was truly being reused at the OS level. Despite this limitation, by analyzing the session behavior and connection reuse patterns, we were able to reach a clear conclusion. using System; using System.Collections.Generic; using System.Linq; using System.Text; using System.Threading; using System.Threading.Tasks; using Microsoft.Data.SqlClient; namespace InfoConn { using System; using System.Data; using System.Diagnostics; using System.Text.RegularExpressions; using System.Threading; using Microsoft.Data.SqlClient; class Program { static void Main() { string connectionStringProxy = "Server=tcp:servername.database.windows.net,1433;Database=db1;User Id=user1;Password=..;Pooling=True;"; Console.WriteLine("Starting Connection Pooling Test"); for (int i = 0; i < 10000; i++) { using (SqlConnection conn = new SqlConnection(connectionStringProxy)) { conn.Open(); ShowConnectionDetails(conn, i); } Thread.Sleep(5000); } Console.WriteLine("Test complete."); } static void ShowConnectionDetails(SqlConnection conn, int attempt) { string query = "SELECT session_id, client_net_address, local_net_address, auth_scheme FROM sys.dm_exec_connections WHERE session_id = @@SPID;"; using (SqlCommand cmd = new SqlCommand(query, conn)) { using (SqlDataReader reader = cmd.ExecuteReader()) { while (reader.Read()) { Console.WriteLine($"[Attempt {attempt + 1}] Session ID: {reader["session_id"]}"); Console.WriteLine($"[Attempt {attempt + 1}] Client IP: {reader["client_net_address"]}"); Console.WriteLine($"[Attempt {attempt + 1}] Local IP: {reader["local_net_address"]}"); Console.WriteLine($"[Attempt {attempt + 1}] Auth Scheme: {reader["auth_scheme"]}"); } } } RetrievePortInformation(attempt); } static void RetrievePortInformation(int attempt) { try { int currentProcessId = Process.GetCurrentProcess().Id; Console.WriteLine($"[Attempt {attempt + 1}] PID: {currentProcessId}"); string netstatOutput = RunNetstatCommand(); var match = Regex.Match(netstatOutput, $@"\s*TCP\s*(\S+):(\d+)\s*(\S+):(\d+)\s*ESTABLISHED\s*{currentProcessId}"); if (match.Success) { string localAddress = match.Groups[1].Value; string localPort = match.Groups[2].Value; string remoteAddress = match.Groups[3].Value; string remotePort = match.Groups[4].Value; Console.WriteLine($"[Attempt {attempt + 1}] Local IP: {localAddress}"); Console.WriteLine($"[Attempt {attempt + 1}] Local Port: {localPort}"); Console.WriteLine($"[Attempt {attempt + 1}] Remote IP: {remoteAddress}"); Console.WriteLine($"[Attempt {attempt + 1}] Remote Port: {remotePort}"); } else { Console.WriteLine($"[Attempt {attempt + 1}] No active TCP connection found in netstat."); } } catch (Exception ex) { Console.WriteLine($"[Attempt {attempt + 1}] Error retrieving port info: {ex.Message}"); } } static string RunNetstatCommand() { using (Process netstatProcess = new Process()) { netstatProcess.StartInfo.FileName = "netstat"; netstatProcess.StartInfo.Arguments = "-ano"; netstatProcess.StartInfo.RedirectStandardOutput = true; netstatProcess.StartInfo.UseShellExecute = false; netstatProcess.StartInfo.CreateNoWindow = true; netstatProcess.Start(); string output = netstatProcess.StandardOutput.ReadToEnd(); netstatProcess.WaitForExit(); return output; } } } }713Views0likes0CommentsAzure PostgreSQL Lesson Learned #3: Fix FATAL: sorry, too many clients already
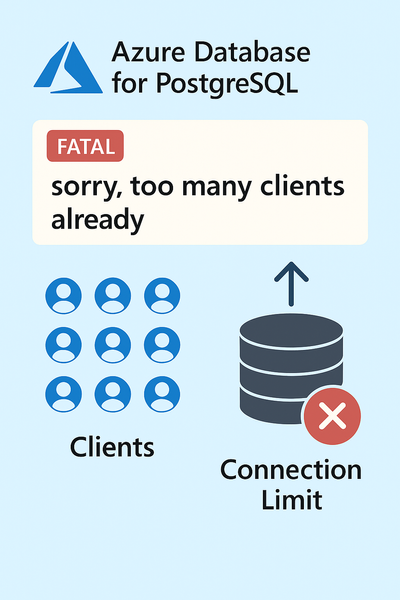
We encountered a support case involving Azure Database for PostgreSQL Flexible Server where the application started failing with connection errors. This blog explains the root cause, resolution steps, and best practices to prevent similar issues.600Views4likes0CommentsHow to Get Database‑Wise Session Details in an Azure SQL Elastic Pool Using T‑SQL
When you run multiple databases inside an Azure SQL Database elastic pool, it’s common to hit questions like: Which database is using the most sessions right now? Are we getting close to the pool’s session limit? Which application(s) are opening connections? Is connection pooling configured correctly? The Azure portal can be helpful, but you don’t always have portal access—and even when you do, you may want a quick, scriptable approach you can run from SSMS / Azure Data Studio / sqlcmd. This post provides copy‑paste T‑SQL queries to: check pool‑level session pressure, list active sessions “by database”, summarize active session counts per database, and capture a connection inventory—and then ties it all back to one of the most common root causes of high session counts: connection pooling behavior in the application. What you should know up front (setting expectations) 1) Elastic pool DMVs give you pool context from inside any pooled database The DMV sys.dm_elastic_pool_resource_stats returns usage for the elastic pool that contains the current database, including concurrent session utilization, and it can be queried from any user database in the same elastic pool. 2) Connection/session DMVs can show pool‑wide connections (with sufficient permissions) Microsoft documentation notes you can use sys.dm_exec_connections to retrieve connection details—and if a database is in an elastic pool and you have sufficient permissions, the view returns the set of connections for all databases in the elastic pool. It also calls out sys.dm_exec_sessions as a companion DMV for session details. If you run the queries below and only see your own session, it typically indicates a permissions scope limitation (the documentation notes this behavior for DMV visibility). Quick “Which query should I run?” guide Are we close to pool session limits? → Query A Which database is busy right now (active work)? → Query B Give me a ranked list of active sessions per database → Query C Which apps/hosts/users are connecting? → Query D Query A — Check elastic pool session pressure (near real‑time) Run this in any user database in the elastic pool: SELECT TOP (60) end_time, avg_cpu_percent, avg_data_io_percent, avg_log_write_percent, max_worker_percent, max_session_percent, used_storage_percent FROM sys.dm_elastic_pool_resource_stats ORDER BY end_time DESC; How to interpret it max_session_percent tells you how close your pool is to its session limit (peak session utilization in the interval). This DMV is intended for real‑time monitoring and troubleshooting and retains data for ~40 minutes. Query B — Active sessions by database (best for “what’s happening right now?”) This query focuses on sessions that are currently executing requests, and attributes them to a database by using the request’s SQL context (DB_NAME(st.dbid)). The st.dbid approach is widely used in troubleshooting patterns to show the execution context database. SELECT DB_NAME(st.dbid) AS database_name, s.session_id, s.login_name, s.host_name, s.program_name, s.client_interface_name, c.net_transport, c.encrypt_option, c.auth_scheme, c.connect_time, s.login_time, r.status AS request_status, r.command, r.start_time, r.cpu_time, r.total_elapsed_time FROM sys.dm_exec_requests AS r JOIN sys.dm_exec_sessions AS s ON r.session_id = s.session_id JOIN sys.dm_exec_connections AS c ON c.session_id = s.session_id CROSS APPLY sys.dm_exec_sql_text(r.sql_handle) AS st WHERE s.is_user_process = 1 AND r.session_id <> @@SPID ORDER BY database_name, r.cpu_time DESC; What customers typically use this for Identify which database has the most active work right now See which client program and host are responsible Spot heavy or long‑running requests using cpu_time and total_elapsed_time Query C — Count active sessions per database (simple ranked view) If you want a quick summary like “DB1 has 18 active sessions; DB2 has 5…” WITH active_pool_sessions AS ( SELECT DB_NAME(st.dbid) AS database_name, r.session_id FROM sys.dm_exec_requests AS r JOIN sys.dm_exec_sessions AS s ON r.session_id = s.session_id CROSS APPLY sys.dm_exec_sql_text(r.sql_handle) AS st WHERE s.is_user_process = 1 ) SELECT database_name, COUNT(*) AS active_sessions FROM active_pool_sessions GROUP BY database_name ORDER BY active_sessions DESC; This is a great “top list” during incidents and uses the same execution context mapping pattern (st.dbid). Query D — Connection inventory (who is connected?) Use this when you suspect connection storms, too many open sessions, or connection pooling issues. SELECT c.session_id, c.net_transport, c.encrypt_option, c.auth_scheme, s.host_name, s.program_name, s.client_interface_name, s.login_name, s.original_login_name, c.connect_time, s.login_time FROM sys.dm_exec_connections AS c JOIN sys.dm_exec_sessions AS s ON c.session_id = s.session_id WHERE s.is_user_process = 1 ORDER BY c.connect_time DESC; Microsoft documentation provides this exact join pattern (connections + sessions) as the baseline way to retrieve connection metadata and notes elastic pool behavior when permissions allow. Connection pooling: the #1 reason session counts spike (and how to fix it) Now that you can see sessions and connections, here’s the most common “why”: connection pooling configuration and behavior in the application. What connection pooling is? Creating a new database connection includes several time‑consuming steps: establishing a physical channel, handshake, parsing the connection string, authenticating, and other checks. To reduce that overhead, ADO.NET uses connection pooling: when your application calls Open(), the pooler tries to reuse an existing physical connection; when your application calls Close()/Dispose, the connection is returned to the pool instead of being physically closed—ready for reuse on the next Open(). Important (and often misunderstood): pooling is client‑side, but it has a very real effect on how many concurrent sessions you consume in an elastic pool. Common pooling pitfalls that cause “too many sessions” 1) Connections are not being returned to the pool (connection leaks) Pooling relies on the application calling Close()/Dispose so the pooler can return the connection to the pool for reuse. If connections aren’t closed properly, the pool can’t reuse them, and your app may keep creating new ones. What it looks like in SQL: Query D shows a growing number of sessions from the same program/host over time. Practical fix: Ensure every DB usage pattern disposes the connection (e.g., using blocks in .NET). (General best practice; the pooling mechanism’s reliance on Close/return is documented.) 2) Pool fragmentation (you accidentally create multiple pools) ADO.NET keeps separate pools for different configurations. Connections are separated into pools by connection string and (when integrated security is used) by Windows identity. Pools can also vary based on transaction enlistment and credential instances. What this means: Small differences in connection strings across services/environments can create multiple pools—each with its own connections—so total sessions can be much higher than expected. What it looks like in SQL: Query D shows many sessions from the same overall application family but with slightly different connection contexts (different apps/services). Practical fix: Keep connection strings consistent across instances where possible (same keywords, same security settings, same app identity strategy). (The “separate pools by configuration” concept is documented.) 3) “Max pool size reached” (client-side pool exhaustion) mistaken for Azure SQL limits A Microsoft Tech Community troubleshooting post shows that if you set a small Max Pool Size, you can hit client-side errors such as: “Timeout expired… prior to obtaining a connection from the pool… all pooled connections were in use and max pool size was reached.” That is not the same as hitting an Azure SQL tier limit—it’s the application waiting because it can’t obtain a connection from its own pool. How to differentiate quickly If you see “max pool size reached” / “timeout obtaining connection from the pool” → client pooling pressure. If max_session_percent in Query A is consistently high → pool-level session pressure. 4) Holding connections open longer than necessary Even with pooling enabled, if your application opens a connection and then holds it while doing non-database work, those connections remain “in use” and can’t return to the pool—causing waits and more concurrent sessions under load. (This follows directly from the documented “Open returns a pooled connection; Close returns it to the pool” behavior.) What it looks like in SQL: Query D shows many sessions from the same application. Query B/C shows many active sessions tied to one database during spikes. Practical fix: Open connections as late as possible; close as early as possible around each DB unit of work. (General best practice derived from pooling mechanics.) A simple customer checklist (quick wins) Confirm every DB call closes/disposes the connection so it can return to the pool. Avoid varying connection strings unnecessarily (prevents pool fragmentation). If you see pool wait errors (“max pool size reached”), treat it as an application pooling signal first. Use the T‑SQL queries above to validate: pool pressure (Query A) busiest databases / active sessions (Query B/C) connection sources (Query D) Wrap‑up With the queries in this post, you can troubleshoot elastic pool session behavior without relying on the Azure portal: Query A: real-time pool session/worker pressure Query B/C: database-wise view of active workload (most actionable during incidents) Query D: connection inventory (great for pooling issues and connection storms) And when session counts spike, don’t overlook the application side: connection pooling behavior (leaks, fragmentation, pool sizing, and holding connections open) is one of the most common drivers.120Views0likes0CommentsLessons Learned #551: Azure SQL Connection Timeouts: Three Things to Check
An application starts reporting intermittent timeouts when connecting to Azure SQL Database. Some requests succeed, others fail, and a test from a developer’s laptop works perfectly. The database appears online, no recent deployment seems related, and the natural reaction is to ask: Is Azure SQL unavailable? Is the firewall blocking the connection? Should we increase the connection timeout? Should we change the driver or scale the database? Those are reasonable questions, but they may lead the investigation in the wrong direction. The most important lesson is simple: A timeout tells us how long the application waited. It does not tell us what the application was waiting for. Not every “SQL timeout” happens inside Azure SQL From the application’s point of view, opening a database connection may involve several operations: Resolving the server name. Reaching the SQL endpoint. Obtaining a Microsoft Entra access token. Waiting for an available pooled connection. Completing the SQL login. Executing the first command. When all these operations are reported through the same application method or log entry, it can look as though Azure SQL took thirty seconds to accept the connection. In reality, only part of that time may have been spent connecting to the database. In one anonymized support scenario, the application experienced problems mainly on its first connection. Network tests were successful and no corresponding SQL connection failure was identified. The investigation eventually showed that access-token acquisition was consuming a significant part of the available time. Increasing the SQL timeout or changing the firewall would not have addressed the real delay. Check 1: Capture the complete error and the exact time A screenshot containing only “Connection Timeout Expired” is rarely enough. Capture: The complete exception and inner exception. The operation being performed. The driver and version. The authentication method. The exact timestamp in UTC. Whether the issue affects every connection or only some of them. The wording around the timeout matters. For example, a timeout while obtaining a connection from the pool points toward the application’s pooling and concurrency behavior. A pre-login or TLS error belongs to a different investigation. A command timeout after the connection was established is usually a query-performance problem rather than a connection problem. Check 2: Measure the application timeline The application should record important operations separately. A simple timeline can completely change the investigation: 10:14:20.100 Token acquisition started 10:14:28.400 Token acquired 10:14:28.405 SQL connection started 10:14:29.050 SQL connection established The complete operation took almost nine seconds, but Azure SQL connection establishment took less than one second. Useful measurements include: Token-acquisition duration. Time waiting for a pooled connection. SQL connection-open duration. SQL command duration. Number of retry attempts. Applications using Microsoft Entra authentication must obtain an access token before authenticating to Azure SQL. Measuring that operation separately helps distinguish an identity delay from a database connectivity problem. This is particularly useful when the issue appears: On the first connection after startup. After a token expires. Only with Managed Identity or Workload Identity. Intermittently, while SQL authentication connections remain unaffected. Check 3: Test from the application environment A successful connection from a laptop does not validate the path used by an application running in: Azure App Service. Azure Functions. Azure Kubernetes Service. A virtual machine. An on-premises application server. A container or integration runtime. The laptop and the application may use different DNS servers, routes, firewalls, proxies and identities. Connectivity and DNS tests should therefore be performed from the environment that is actually failing. This becomes especially important when Private Endpoint is used. The application should continue connecting with: <server>.database.windows.net It should not use the Private Endpoint IP address or the privatelink.database.windows.net hostname directly. Direct login attempts using the private IP or the private-link FQDN fail; the normal logical-server FQDN must remain in the connection string. From the affected environment, confirm that: The expected DNS server answers the request. The server FQDN resolves to the expected private IP. The Private Endpoint connection is approved. The Private DNS zone is linked correctly. The resolved address is reachable through the intended route. A test from an unrelated machine is still useful for comparison, but it does not prove that the application path is healthy. Observed symptom Likely investigation area Timeout while obtaining a connection from the pool Application connection pooling Server name cannot be resolved DNS TCP connection to the endpoint cannot be established Network path, firewall or routing Error during the pre-login handshake TLS, driver, network interruption or pre-login processing Authentication or access-token error Microsoft Entra authentication, identity or token acquisition Timeout during the post-login phase Login completion, session initialization or server-side processing Execution or command timeout after connecting Query execution and database performance Avoid changing several things at once During a production incident, it is tempting to: Increase the timeout. Add firewall rules. Change the connection policy. Upgrade the driver. Restart the application. Clear connection pools. Applying several changes together makes it difficult to determine which one helped, and some may only hide the symptom. A better approach is to define one hypothesis: We believe DNS in the application environment is resolving the public endpoint instead of the Private Endpoint. Then define: The evidence supporting the hypothesis. One controlled change. The expected result. How the result will be measured. How the change will be reverted. Azure SQL supports Proxy and Redirect connection policies, which determine how traffic flows after reaching the Azure SQL gateway. The policy is configured for the logical server, so it should be verified before making firewall assumptions or changes. What should we collect before opening a support request? A small but precise evidence package can avoid several rounds of questions: Complete error and inner exception. Exact UTC timestamps. Application platform and location. Public or Private Endpoint. Server FQDN used by the application. Driver and version. Authentication method. Token, pool, connection and command durations. DNS result from the affected environment. Whether the issue is constant, intermittent or limited to the first connection. Recent application, network, identity or configuration changes.