azure cognitive services
49 TopicsFrom AI Adoption to AI Governance - Using APIM as the Gateway for Azure AI Foundry
Co-authored by Gaurav Jain (Senior Cloud Solution Architect @ Microsoft) and Abhishek Mittal (Cloud Solution Architect @ Microsoft) Enterprises move through three phases of AI adoption: evaluating models, building apps and agents, and operationalizing them in production. The first two are easier to accelerate. The third is where governance becomes critical. Once multiple teams share an AI endpoint, leaders need clear answers to practical questions: which model consumed tokens, which team used them, and who is authorized to call it? This post shows how to place Azure API Management (APIM) in front of Azure AI Foundry as an AI Gateway, turning a shared endpoint into a governed control point for per-model token visibility, chargeback, and budget alerts — with no changes to client code. It also shows where Azure Front Door and Web Application Firewall (WAF) fit in a secure AI Landing Zone. The problem: AI adoption is outpacing AI governance A common starting point is an Azure OpenAI resource running multiple models. The team already has operational telemetry, but governance needs a different view: per-model token usage for chargeback, budget alerts, and capacity planning, captured in one place. Azure gives you rich resource-level telemetry out of the box, and that is exactly where we started: Azure Monitor — Metrics blade: shows token usage split by model and deployment in near real time. Diagnostic settings: stream the resource's metrics and request logs into Log Analytics (the AzureMetrics and AzureDiagnostics tables). Azure Monitor provides useful resource-level telemetry, including metrics and diagnostic logs. A governance view needs something different: model identity and token counts correlated in a single record, so teams can build a per-model, month-to-date ledger for chargeback and alerting. The AzureMetrics table carries the token totals, aggregated at the resource level. The AzureDiagnostics logs carry the model and deployment name at the request level. Each stream does its job well. Correlating them into one per-model, month-to-date ledger — and alerting on it — is a governance concern that sits above any single resource. Azure Monitor metric alerts, for instance, work on a rolling 24-hour window that maps cleanly onto a per-day token budget; a month-to-date, per-model chargeback ledger is simply a different shape of question — and a natural fit for a dedicated control point. This transition is the focus of this post: moving from AI adoption to AI governance by introducing a control point where model identity and token usage are captured together by design. The natural home for that control point is an AI gateway — and we build it next with Azure API Management in front of Azure AI Foundry. The pattern: APIM as the AI Gateway for Azure AI Foundry The AI gateway in Azure API Management is a set of capabilities to secure, scale, monitor, and govern the AI models, agents, and tools behind your apps. It isn't a separate product — it extends the existing API Management gateway. As Microsoft's guidance puts it, as AI adoption matures the gateway helps you authenticate and authorize access to AI services, load balance across endpoints, monitor and log AI interactions, and manage token usage and quotas across multiple applications. APIM becomes the governed front door for Azure AI Foundry. Clients continue calling an OpenAI-compatible endpoint; APIM authenticates to Foundry with a system-assigned managed identity, forwards the request, and emits per-model token telemetry to Azure Monitor and Application Insights. The result is per-model visibility without client-side changes. Models behind the gateway The gateway can front any model deployment in Azure AI Foundry — Azure OpenAI models, other Foundry models, or a mix — and the pattern is identical no matter which you run. For a concrete reference, the walkthrough in this post sits in front of two existing deployments: Deployment Model Provisioned capacity (TPM) gpt-4.1 gpt-4.1 500K gpt-5 gpt-5 50K Example deployments referenced throughout this post. Note the deliberate capacity gap — gpt-5 at 50K TPM versus 500K for gpt-4.1 — exactly the kind of asymmetry that makes per-model visibility a governance requirement, not a nice-to-have. Architecture Figure 1 — Architecture / component flow: consumers call one governed API; the inbound policy authenticates with a managed identity, resolves the model, and emits per-model token metrics to Azure Monitor and Application Insights. The starting point (“before”): a pass-through without a usage signal By default, APIM operates as a straightforward proxy. If you import a Foundry API and keep the default configuration, the policy simply selects the backend service: <policies> <inbound> <base /> <set-backend-service id="apim-generated-policy" backend-id="foundry-backend" /> </inbound> <backend><base /></backend> <outbound><base /></outbound> <on-error><base /></on-error> </policies> A plain pass-through API. It forwards traffic faithfully — it simply doesn't surface a usage signal yet. This is our “before.” Pass-through configuration works, but it does not distinguish traffic by model. All requests flow through the same stream, with no per-model chargeback signal, no capacity warning, and no clear view of which deployment is driving consumption. To govern the workload, the gateway must understand the traffic — not just relay it. The governed gateway (“after”): a policy that sees every token The custom inbound policy below is the heart of the pattern. It does four things in order: set-backend-service — select the Azure AI Foundry backend. authentication-managed-identity — obtain an Entra ID token for cognitiveservices.azure.com using the APIM system-assigned identity. No keys ever leave the gateway. set-variable deployment-id — resolve the model name from either the URL path or the request body (more on why below). azure-openai-emit-token-metric — emit prompt, completion, and total token counts to Azure Monitor, dimensioned by model. <policies> <inbound> <base /> <set-backend-service backend-id="foundry-backend" /> <authentication-managed-identity resource="https://cognitiveservices.azure.com" /> <!-- Resolve the model/deployment name. The Foundry Model Inference API (/models/chat/completions, /models/embeddings, /anthropic/v1/messages) passes it in the JSON body as "model". The Azure OpenAI-style surface (/openai/deployments/{name}/...) passes it in the URL path. Handle both. --> <set-variable name="deployment-id" value="@{ var path = context.Request.Url.Path ?? ""; var m = System.Text.RegularExpressions.Regex.Match(path, "/deployments/([^/?]+)"); if (m.Success) { return m.Groups[1].Value; } try { var body = context.Request.Body?.As<JObject>(preserveContent: true); var model = body?["model"]; if (model != null && !string.IsNullOrEmpty(model.ToString())) { return model.ToString(); } } catch (Exception) { } return "unknown"; }" /> <!-- Emit token-usage metrics dimensioned by model, so consumption can be sliced per model in Azure Monitor / Application Insights. --> <azure-openai-emit-token-metric namespace="genai-tokens"> <dimension name="ModelDeploymentName" value="@((string)context.Variables["deployment-id"])" /> <dimension name="ModelName" value="@((string)context.Variables["deployment-id"])" /> <dimension name="APIId" value="@(context.Api.Id)" /> <dimension name="Subscription" value="@(context.Subscription?.Id ?? "none")" /> <dimension name="Client IP" value="@(context.Request.IpAddress)" /> <dimension name="Product ID" value="@(context.Product?.Id ?? "none")" /> </azure-openai-emit-token-metric> </inbound> <backend> <base /> </backend> <outbound> <base /> </outbound> <on-error> <base /> </on-error> </policies> The full custom policy, applied at API scope. The highlighted value is the model-name resolution feeding a per-model token metric. Request flow, end to end Figure 2 traces a single chat request from top to bottom — from the caller, through the gateway's inbound policy, out to Azure AI Foundry, and into your telemetry. Figure 2 — Per-request flow: authentication, model resolution, forwarding, and token-metric emission. The request flow is straightforward: the client calls the APIM endpoint, the gateway selects the Foundry backend, authenticates with managed identity, resolves the model name, forwards the request, emits token metrics, and returns the response unchanged. Governance is added at the gateway without requiring client-side changes. Why dual-shape model resolution matters The azure-openai-emit-token-metric policy can emit usage, but it still needs a model dimension. Different API surfaces place the model name in different locations: Foundry Model Inference and Anthropic-style requests use the body, while Azure OpenAI-compatible calls use the URL path. The policy handles both shapes, so one gateway can govern all callers consistently. Observability: per-model token visibility and chargeback Metrics land in Azure Monitor / Application Insights under the namespace genai-tokens. The policy records Total Tokens, Prompt Tokens, and Completion Tokens, each tagged with Model Name, Model Deployment Name, API Id, APIM Product Subscription, Client IP, and Product ID. The data can then be queried directly. Per-model consumption over time: customMetrics | where name == "Total Tokens" | where timestamp >= startofmonth(now()) | extend ModelName = tostring(customDimensions["ModelName"]) | summarize TotalTokens = sum(valueSum), Calls = sum(valueCount) by ModelName Per-model token consumption (Application Insights customMetrics). And a per-model, per- API product subscription view for chargeback: customMetrics | where name == "Total Tokens" | where timestamp >= startofmonth(now()) | extend Model = tostring(customDimensions["ModelName"]), Sub = tostring(customDimensions["Subscription"]) | summarize Tokens = sum(value) by Model, Sub, name | order by Tokens desc Chargeback: tokens by model and consuming subscription. The gateway records model identity and token usage together, so the chargeback view is built in. The same signal supports dashboards, daily budget alerts, capacity planning, and cost allocation by subscription or product — without changing client code. Turning the signal into a Cost Guardrail: a 24-hour token alert Because the token totals now carry the model name, you can put a hard guardrail on spend. Wrap a query in an Azure Monitor log search alert rule that sums Total Tokens over the last 24 hours per model and returns only the deployments that breach a daily budget: // Rolling 24-hour token-budget guardrail — returns any model over its daily cap let dailyTokenBudget = 50000; // max Total Tokens per model in a rolling 24h window customMetrics | where name == "Total Tokens" | where timestamp > ago(24h) extend Model = tostring(customDimensions["ModelName"]) | summarize TokensLast24h = sum(value) by Model | where TokensLast24h > dailyTokenBudget | extend OverBudgetBy = TokensLast24h - dailyTokenBudget | project Model, TokensLast24h, DailyBudget = dailyTokenBudget, OverBudgetBy A rolling 24-hour token-budget check. The alert rule fires whenever this query returns one or more rows. Configure this as a scheduled log search alert: evaluate on a short cadence (for example, hourly over the trailing 24-hour window), set the alert logic to fire when the result count is greater than zero, and attach an action group that notifies the team through an email distribution list or Microsoft Teams channel. When any model crosses its rolling 24-hour token budget, the owning team is alerted, so overspend is detected within the day rather than at invoice time. Tune dailyTokenBudget per model, or add a single all-up cap, and translate token budgets into estimated daily cost ceilings to maintain continuous spend visibility. Completing the picture: securing the AI Landing Zone with Front Door + WAF APIM governs model usage; Azure Front Door with WAF governs public access. Placing WAF at the edge protects the AI endpoint from common web attacks, malicious bots, abusive callers, and unwanted source IP ranges before traffic reaches APIM or Foundry. What Front Door + WAF adds OWASP protection: The Azure-managed Microsoft_DefaultRuleSet_2.1 helps defend against OWASP Top 10 web attacks and known CVEs; Microsoft_BotManagerRuleSet_1.0 helps block malicious bots. Run the policy in prevention mode so offending requests are rejected with a 403, not just logged. IP restriction and rate limiting: Custom WAF rules restrict access to known IP ranges and throttle abusive callers before they reach APIM or Foundry. Global edge: Front Door terminates TLS at the edge and provides a single, DDoS-protected public entry point for the workload. Defense in depth across the landing zone Layered against the Azure AI Foundry landing zone baseline, the request path looks like this: Defense in depth: WAF at the edge, governance at the gateway, isolation on the network, Foundry reachable over a private endpoint. The baseline Azure AI Foundry landing zone reinforces every layer: private endpoints keep PaaS services (Foundry, Key Vault, Storage, AI Search) off the public internet; a system-assigned managed identity helps remove API keys; a hub-and-spoke topology routes egress through Azure Firewall; Azure Key Vault holds the Front Door TLS certificate; and Azure Policy enforces guardrails across the subscription. The gateway pattern from Sections 2–6 slots directly into this architecture as the governed control point for model traffic. Outcomes and what to extend next With APIM and the security edge in place, the shared endpoint supports per-model chargeback, capacity planning, zero client changes, and a stronger security baseline. The same gateway pattern can then be extended with token quotas, semantic caching, content safety, resiliency, and a unified model API (preview). Closing thoughts Moving from AI adoption to AI governance does not require re-architecting every app; it requires a control point. APIM in front of Azure AI Foundry provides that point: one policy turns token usage into a per-model governance signal, and Front Door with WAF provides a hardened edge. Start with visibility, then add quotas, safety, and resiliency as adoption scales. References AI gateway capabilities in Azure API Management — Microsoft Learn Baseline Microsoft Foundry Chat Reference Architecture in an Azure Landing Zone - Azure Architecture Center Protect Azure OpenAI using Azure Web Application Firewall on Azure Front Door — Microsoft Learn LLM token limit policy — Microsoft Learn Emit token consumption metrics (llm-emit-token-metric) — Microsoft Learn2.3KViews1like0CommentsEvaluating Generative AI Models with Azure Machine Learning
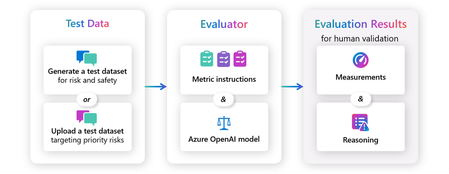
LLM evaluation assesses the performance of a large language model on a set of tasks, such as text classification, sentiment analysis, question answering, and text generation. The goal is to measure the model's ability to understand and generate human-like language.5KViews3likes0CommentsMicrosoft 365 multi-agent workflow with Microsoft Agent Framework
Learn how to design and run a multi‑agent workflow with Microsoft Agent Framework: from building a coordinated set of specialized agents and tools, to hosting and deploying them with Azure AI Foundry, and finally exposing the same workflow to users in Microsoft 365 (Teams or Copilot). This walkthrough demonstrates a practical end‑to‑end pattern for orchestrating agents, adding tools, and packaging the solution for real‑world applications.792Views0likes0CommentsAutonomous AKS Incident Response with Azure SRE Agent: From Alert to Verified Recovery in Minutes
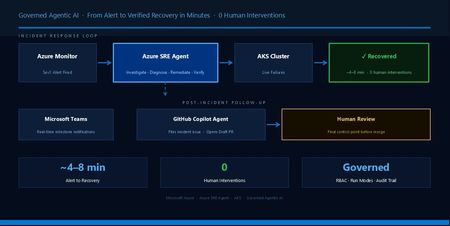
When a Sev1 alert fires on an AKS cluster, detection is rarely the hard part. The hard part is what comes next: proving what broke, why it broke, and fixing it without widening the blast radius, all under time pressure, often at 2 a.m. Azure SRE Agent is designed to close that gap. It connects Azure-native observability, AKS diagnostics, and engineering workflows into a single incident-response loop that can investigate, remediate, verify, and follow up, without waiting for a human to page through dashboards and run ad-hoc kubectl commands. This post walks through that loop in two real AKS failure scenarios. In both cases, the agent received an incident, investigated Azure Monitor and AKS signals, applied targeted remediation, verified recovery, and created follow-up in GitHub, all while keeping the team informed in Microsoft Teams. Core concepts Azure SRE Agent is a governed incident-response system, not a conversational assistant with infrastructure access. Five concepts matter most in an AKS incident workflow: Incident platform. Where incidents originate. In this demo, that is Azure Monitor. Built-in Azure capabilities. The agent uses Azure Monitor, Log Analytics, Azure Resource Graph, Azure CLI/ARM, and AKS diagnostics without requiring external connectors. Connectors. Extend the workflow to systems such as GitHub, Teams, Kusto, and MCP servers. Permission levels. Reader for investigation and read oriented access, privileged for operational changes when allowed. Run modes. Review for approval-gated execution and Autonomous for direct execution. The most important production controls are permission level and run mode, not prompt quality. Custom instructions can shape workflow behavior, but they do not replace RBAC, telemetry quality, or tool availability. The safest production rollout path: Start: Reader + Review Then: Privileged + Review Finally: Privileged + Autonomous. Only for narrow, trusted incident paths. Demo environment The full scripts and manifests are available if you want to reproduce this: Demo repository: github.com/hailugebru/azure-sre-agents-aks. The README includes setup and configuration details. The environment uses an AKS cluster with node auto-provisioning (NAP), Azure CNI Overlay powered by Cilium, managed Prometheus metrics, the AKS Store sample microservices application, and Azure SRE Agent configured for incident-triggered investigation and remediation. This setup is intentionally realistic but minimal. It provides enough surface area to exercise real AKS failure modes without distracting from the incident workflow itself. Azure Monitor → Action Group → Azure SRE Agent → AKS Cluster (Alert) (Webhook) (Investigate / Fix) (Recover) ↓ Teams notification + GitHub issue → GitHub Agent → PR for review How the agent was configured Configuration came down to four things: scope, permissions, incident intake, and response mode. I scoped the agent to the demo resource group and used its user-assigned managed identity (UAMI) for Azure access. That scope defined what the agent could investigate, while RBAC determined what actions it could take. I used broader AKS permissions than I would recommend as a default production baseline so the agent could complete remediation end to end in the lab. That is an important distinction: permissions control what the agent can access, while run mode controls whether it asks for approval or acts directly. For this scenario, Azure Monitor served as the incident platform, and I set the response plan to Autonomous for a narrow, trusted path so the workflow could run without manual approval gates. I also added Teams and GitHub integrations so the workflow could extend beyond Azure. Teams provided milestone updates during the incident, and GitHub provided durable follow up after remediation. For the complete setup, see the README. A note on context. The more context you can provide the agent about your environment, resources, runbooks, and conventions, the better it performs. Scope boundaries, known workloads, common failure patterns, and links to relevant documentation all sharpen its investigations and reduce the time it spends exploring. Treat custom instructions and connector content as first-class inputs, not afterthoughts. Two incidents, two response modes These incidents occurred on the same cluster in one session and illustrate two realistic operating modes: Alert triggered automation. The agent acts when Azure Monitor fires. Ad hoc chat investigation. An engineer sees a symptom first and asks the agent to investigate. Both matter in real environments. The first is your scale path. The second is your operator assist path. Incident 1. CPU starvation (alert driven, ~8 min MTTR) The makeline-service deployment manifest contained a CPU and memory configuration that was not viable for startup: resources: requests: cpu: 1m memory: 6Mi limits: cpu: 5m memory: 20Mi Within five minutes, Azure Monitor fired the pod-not-healthy Sev1 alert. The agent picked it up immediately. Here is the key diagnostic conclusion the agent reached from the pod state, probe behavior, and exit code: "Exit code 1 (not 137) rules out OOMKill. The pod failed at startup, not at runtime memory pressure. CPU limit of 5m is insufficient for the process to bind its port before the startup probe times out. This is a configuration error, not a resource exhaustion scenario." That is the kind of distinction that often takes an on call engineer several minutes to prove under pressure: startup failure from CPU starvation vs. runtime termination from memory pressure. The agent then: Identified three additional CPU-throttled pods at 112 to 200% of configured limit using kubectl top. Patched four workloads: makeline-service, virtual-customer, virtual-worker, and mongodb. Verified that all affected pods returned to healthy running state with 0 restarts cluster wide. Azure SRE Agent's Incident History blade confirming full cluster recovery: 4 patches applied, 0 unhealthy pods — no human intervention required. Outcome. Full cluster recovery in ~8 minutes, 0 human interventions. Incident 2. OOMKilled (chat driven, ~4 min MTTR) For the second case, I deployed a deliberately undersized version of order-service: kubectl apply -f .\manifests\aks-store\order-service-changed.yaml -n pets I started this case from chat before the pod-phase alert fired to demonstrate the interactive troubleshooting flow. That was a demo choice, not an alerting gap. CrashLoopBackOff is a container waiting reason, not a pod phase, so production coverage should come from Prometheus based crash-loop signals rather than pod phase alone. Here is the PromQL query I use in Azure Monitor to catch this class of failure: sum by (namespace, pod) ( ( max_over_time( kube_pod_container_status_waiting_reason{ namespace="pets", reason="CrashLoopBackOff" }[5m] ) == 1 ) and on (namespace, pod, container) ( increase( kube_pod_container_status_restarts_total{ namespace="pets" }[15m] ) > 0 ) ) > 0 This query fires when a container has been in CrashLoopBackOff within the last 5 minutes and its restart count has increased in the last 15 minutes. In production, replace the hardcoded namespace with a regex matcher or remove it entirely to cover all namespaces. The order-service pod in the pets namespace is not healthy. Please investigate, identify the root cause, and fix it. The agent's reasoning: "Container logs are empty. The process was killed before it could write its first log line. Exit code 137 confirms OOMKill. No NODE_OPTIONS in the ConfigMap rules out a V8 heap misconfiguration. The 20Mi limit is 12.8x below the pod's observed 50Mi runtime baseline. This limit was never viable for this workload." The agent increased the memory limit (20Mi to 128Mi) and request (10Mi to 50Mi), then verified the new pod stabilized at 74Mi/128Mi (58% utilization) with 0 restarts. Outcome. Service recovered in ~4 minutes without any manual cluster interaction. Side by side comparison Dimension Incident 1: CPU starvation Incident 2: OOMKilled Trigger Azure Monitor alert (automated) Engineer chat prompt (ad hoc) Failure mode CPU too low for startup probe to pass Memory limit too low for process to start Key signal Exit code 1, probe timeout Exit code 137, empty container logs Blast radius 4 workloads affected cluster wide 1 workload in target namespace Remediation CPU request/limit patches across 4 deployments Memory request/limit patch on 1 deployment MTTR ~8 min ~4 min Human interventions 0 0 Why this matters Most AKS environments already emit rich telemetry through Azure Monitor and managed Prometheus. What is still manual is the response: engineers paging through dashboards, running ad-hoc kubectl commands, and applying hotfixes under time pressure. Azure SRE Agent changes that by turning repeatable investigation and remediation paths into an automated workflow. The value isn't just that the agent patched a CPU limit. It's that the investigation, remediation, and verification loop is the same regardless of failure mode, and it runs while your team sleeps. In this lab, the impact was measurable: Metric This demo with Azure SRE Agent Alert to recovery ~4 to 8 min Human interventions 0 Scope of investigation Cluster wide, automated Correlate evidence and diagnose ~2 min Apply fix and verify ~4 min Post incident follow-up GitHub issue + draft PR These results came from a controlled run on April 10, 2026. Real world outcomes depend on alert quality, cluster size, and how much automation you enable. For reference, industry reports from PagerDuty and Datadog typically place manual Sev1 MTTR in the 30 to 120 minute range for Kubernetes environments. Teams + GitHub follow-up Runtime remediation is only half the story. If the workflow ends when the pod becomes healthy again, the same issue returns on the next deployment. That is why the post incident path matters. After Incident 1 resolved, Azure SRE Agent used the GitHub connector to file an issue with the incident summary, root cause, and runtime changes. In the demo, I assigned that issue to GitHub Copilot agent, which opened a draft pull request to align the source manifests with the hotfix. The agent can also be configured to submit the PR directly in the same workflow, not just open the issue, so the fix is in your review queue by the time anyone sees the notification. Human review still remains the final control point before merge. Setup details for the GitHub connector are in the demo repo README, and the official reference is in the Azure SRE Agent docs. Azure SRE Agent fixes the live issue, and the GitHub follow-up prepares the durable source change so future deployments do not reintroduce the same configuration problem. The operations to engineering handoff: Azure SRE Agent fixed the live cluster; GitHub Copilot agent prepares the durable source change so the same misconfiguration can't ship again. In parallel, the Teams connector posted milestone updates during the incident: Investigation started. Root cause and remediation identified. Incident resolved. Teams handled real time situational awareness. GitHub handled durable engineering follow-up. Together, they closed the gap between operations and software delivery. Key takeaways Three things to carry forward Treat Azure SRE Agent as a governed incident response system, not a chatbot with infrastructure access. The most important controls are permission levels and run modes, not prompt quality. Anchor detection in your existing incident platforms. For this demo, we used Prometheus and Azure Monitor, but the pattern applies regardless of where your signals live. Use connectors to extend the workflow outward. Teams for real time coordination, GitHub for durable engineering follow-up. Start where you're comfortable. If you are just getting your feet wet, begin with one resource group, one incident type, and Review mode. Validate that telemetry flows, RBAC is scoped correctly, and your alert rules cover the failure modes you actually care about before enabling Autonomous. Expand only once each layer is trusted. Next steps Add Prometheus based alert coverage for ImagePullBackOff and node resource pressure to complement the pod phase rule. Expand to multi cluster managed scopes once the single cluster path is trusted and validated. Explore how NAP and Azure SRE Agent complement each other — NAP manages infrastructure capacity, while the agent investigates and remediates incidents. I'd like to thank Cary Chai, Senior Product Manager for Azure SRE Agent, for his early technical guidance and thorough review — his feedback sharpened both the accuracy and quality of this post.1.2KViews0likes0CommentsAI Transcription & Text Analytics for Health
Industry Challenge Healthcare organizations depend on qualitative research, patient interviews, and clinical documentation to improve care delivery. Traditional transcription services often create bottlenecks: Manual Processes: Require manual uploads and lack automation. Delayed Turnaround: Transcripts can take days, slowing research and decision-making. Limited Integration: Minimal interoperability with EMR systems or analytics platforms. Cost Inefficiencies: Pricing models that scale poorly for large volumes. The need for real-time, HIPAA-compliant transcription and integrated analytics has never been greater. Azure AI Solution Overview Azure provides a comprehensive, cloud-native transcription and analytics pipeline that addresses these challenges head-on. By leveraging Azure AI Services, organizations can: Transcribe audio/video recordings in real time. Process PDFs and text documents for structured data extraction. Apply Text Analytics for Health to identify medical entities and structure data into FHIR format. Generate summaries and insights using cutting edge LLMs including Azure OpenAI. This approach accelerates workflows, improves compliance, and reduces costs compared to traditional transcription vendors. Azure Speech Service Options Azure Speech Service offers multiple transcription modes to fit different scenarios: Real-Time Transcription: Converts live audio streams into text instantly for telehealth sessions and interviews. Batch Transcription: Processes large volumes of pre-recorded audio asynchronously for research studies. Fast Transcription: Optimized for quick turnaround on short recordings for rapid documentation needs. Azure Text Analytics for Health One of the most powerful components of this solution is Azure AI Language – Text Analytics for Health, which transforms raw text into structured clinical insights. Key capabilities include: Named Entity Recognition (NER): Automatically identifies clinical entities such as symptoms, diagnoses, medications, procedures, and anatomy from transcripts and documents. Relation Extraction: Detects relationships between entities (e.g., linking a medication to its dosage or a condition to its treatment), enabling richer context for clinical decision-making. Entity Linking to UMLS Codes: Maps recognized entities to Unified Medical Language System (UMLS) concepts, ensuring interoperability and standardization across healthcare systems. Assertion Detection: Determines the status of an entity (e.g., present, absent, conditional, or hypothetical), which is critical for accurate interpretation of patient data. These features allow healthcare organizations to move beyond simple transcription and unlock structured, actionable insights that can feed downstream analytics and reporting. Other Azure Resources Azure AI Document Intelligence – Extracts structured data from PDFs and scanned documents. Azure OpenAI Service – Summarizes transcripts and generates clinical insights. Azure Storage & Functions – Securely stores raw and processed data; orchestrates workflows for transcription and analytics. Integration with Microsoft Fabric OneLake Once FHIR JSON output is generated from Text Analytics for Health, it can be stored in Microsoft Fabric OneLake. This unlocks powerful downstream capabilities: Unified Data Lake: Centralized storage for structured healthcare data. Analytics & Reporting: Use Fabric’s Lakehouse and Power BI to build dashboards for clinical research trends, patient outcomes, and operational metrics. AI-Driven Insights: Combine transcription data with other datasets for predictive modeling and advanced analytics. This integration ensures that transcription and clinical insights are not siloed—they become part of a broader data ecosystem for research and decision-making. Why Azure Stands Out Compared to other transcription solutions in the market, Azure offers: Real-Time Processing: Immediate access to transcripts versus multi-day turnaround. Integrated Analytics: Built-in medical entity recognition and AI summarization. Compliance & Security: HIPAA-ready architecture with enterprise-grade governance. Cost Efficiency: Pay-as-you-go pricing with elastic scaling for large datasets. End-to-End Data Flow: From transcription to Fabric OneLake for analytics. Step-by-Step Deployment Guide As part of the Azure Field team working in the Healthcare and Life Sciences industry, this challenge has emerged as a common theme among organizations seeking to modernize transcription and analytics workflows. To assist organizations exploring Azure AI solutions to address these challenges, the following demo application was developed by Solution Engineer Samuel Tauil and Cloud & AI Platform Specialist Hannah Abbott. This application is intended to allow organizations to quickly stand up and test these Azure services for their needs and is not intended as a production-ready solution. This Azure-powered web application demonstrates how organizations can modernize transcription and clinical insights using cloud-native AI services. Users can upload audio files in multiple formats, which are stored in Azure Storage and trigger an Azure Function to perform speech-to-text transcription with speaker diarization. The transcript is then enriched through Azure Text Analytics for Health, applying advanced capabilities like named entity recognition, relation extraction, UMLS-based entity linking, and assertion detection to deliver structured clinical insights. Finally, Azure OpenAI generates a concise summary and a downloadable clinical report, while FHIR-compliant JSON output seamlessly integrates with Microsoft Fabric OneLake for downstream analytics and reporting—unlocking a complete, scalable, and secure solution for healthcare data workflows. The following video clip uses AI-generated dialog for a fictitious scenario to demonstrate the capabilities of the sample application. Sample application developed by Samuel Tauil Microsoft Solution Engineer (25) Samuel Tauil | LinkedIn Prerequisites Azure Subscription GitHub account Azure CLI installed locally (optional, for manual deployment) 1. Fork the Repository GitHub - samueltauil/transcription-services-demo: Azure Healthcare Transcription Services Demo - Speech-to-text with Text Analytics for Health for HIPAA-compliant medical transcription 2. Create Azure Service Principal for GitHub Actions Copy the JSON output. 3. Add GitHub Secrets (Settings → Secrets and variables → Actions): AZURE_CREDENTIALS: Paste the service principal JSON from step 2 4. Run the deployment workflow: Go to Actions tab → "0. Deploy All (Complete)" Click "Run workflow" Enter your resource group name and Azure region Click "Run workflow" 5. After infrastructure deploys, add these additional secrets: AZURE_FUNCTIONAPP_NAME: The function app name (shown in workflow output) AZURE_STATIC_WEB_APPS_API_TOKEN: Get from Azure Portal → Static Web App → Manage deployment token Benefits Accelerated Research: Reduce transcription time from days to minutes. Enhanced Accuracy: AI-driven entity recognition for clinical terms. Scalable & Secure: Built on Azure’s compliance-ready infrastructure. Analytics-Ready: Seamless integration with Fabric for reporting and insights. Reference Links: Transcription Service: Speech to text overview - Speech service - Foundry Tools | Microsoft Learn Batch transcription overview - Speech service - Foundry Tools | Microsoft Learn Speech to text quickstart - Foundry Tools | Microsoft Learn Real-time diarization quickstart - Speech service - Foundry Tools | Microsoft Learn Text Analytics: Watch this: Embedded Video | Microsoft Learn What is the Text Analytics for health in Azure Language in Foundry Tools? - Foundry Tools | Microso… Fast Healthcare Interoperability Resources (FHIR) structuring in Text Analytics for health - Foundr… azure-ai-docs/articles/ai-services/language-service/text-analytics-for-health/quickstart.md at main… AI Foundry: Model catalog - Azure AI Foundry957Views0likes0CommentsCompose for Agents on Azure Container Apps and Serverless GPU (public preview)
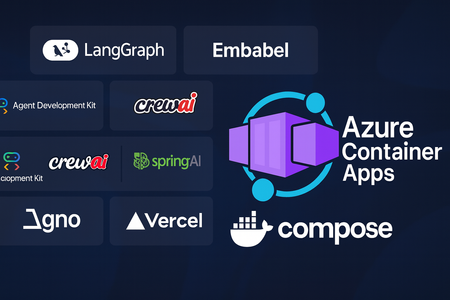
Empowering intelligent applications The next wave of AI is agentic – systems that can reason, plan, and act on our behalf. Whether you’re building a virtual assistant that books travel or a multi‑model workflow that triages support tickets, these applications rely on multiple models, tools, and services working together. Unfortunately, building them has not been easy: Tooling sprawl. Developers must wire together LLMs, vector databases, MCP (Model Context Protocol) tools and orchestration logic, often across disparate SDKs and running processes. Keeping those dependencies in sync for local development and production is tedious and error‑prone. Specialized hardware. Large language models and agent orchestration frameworks often require GPUs to run effectively. Procuring and managing GPU instances can be costly, particularly for prototypes and small teams. Operational complexity. Agentic applications are typically composed of many services. Scaling them, managing health and secure connectivity, and reproducing the same environment from a developer laptop into production quickly becomes a full‑time job. Why Azure Container Apps is the right home With Azure Container Apps (ACA), you can now tackle these challenges without sacrificing the familiar Docker Compose workflow that so many developers love. We’re excited to announce that Compose for Agents is in public preview on Azure Container Apps. This integration brings the power of Docker’s new agentic tooling to a platform that was built for serverless containers. Here’s why ACA is the natural home for agentic workloads: Serverless GPUs with per‑second billing. Container Apps offers serverless GPU compute. Your agentic workloads can run on GPUs only when they need to, and you only pay for the seconds your container is actually running. This makes it economical to prototype and scale complex models without upfront infrastructure commitments. Media reports on the preview note that Docker’s Offload service uses remote GPUs via cloud providers such as Microsoft to overcome local hardware limits, and ACA brings that capability directly into the Azure native experience. Sandboxed dynamic sessions for tools. Many agentic frameworks execute user‑provided code as part of their workflows. ACA’s dynamic sessions provide secure, short‑lived sandboxes for running these tasks. This means untrusted or transient code (for example, evaluation scripts or third‑party plugins) runs in an isolated environment, keeping your production services safe. Fully managed scaling and operations. Container Apps automatically scales each service based on traffic and queue length, and it can scale down to zero when idle. You get built‑in service discovery, ingress, rolling updates and revision management without having to operate your own orchestrator. Developers can focus on building agents rather than patching servers. First‑class Docker Compose support. Compose remains a favourite tool for developers’ inner loop and for orchestrating multi‑container systems. Compose for Agents extends the format to declare open‑source models, agents and tools alongside your microservices. By pointing docker compose up at ACA, the same YAML file you use locally now deploys automatically to a fully managed container environment. Model Runner and MCP Gateway built in. Docker’s Model Runner lets you pull open‑weight language models from Docker Hub and exposes them via OpenAI‑compatible endpoints, and the MCP (Model Context Protocol) Gateway connects your agents to curated tools. ACA integrates these components into your Compose stack, giving you everything you need for retrieval‑augmented generation, vector search or domain‑specific tool invocation. What this means for developers The Compose for Agents public preview on Container Apps brings together the simplicity of Docker Compose and the operational power of Azure’s serverless compute platform. Developers can now: Define agent stacks declaratively. Instead of cobbling together scripts, you describe your entire agentic application in a single compose.yaml file. Compose already supports popular frameworks like LangGraph, Embabel, Vercel AI SDK, Spring AI, Crew AI, Google ADK and Agno. You can mix and match these frameworks with your own microservices, databases and queues. Run anywhere with the same configuration. Docker emphasizes that you can “define your open models, agents and MCP‑compatible tools, then spin up your full agentic stack with a simple docker compose up”. By bringing this workflow to ACA, Microsoft ensures that the same compose file runs unchanged on your laptop and in the cloud. Scale seamlessly. Large language models and multi‑agent orchestration can be compute‑intensive. News coverage notes that Docker’s Offload service provides remote GPUs for these workloads ACA extends that capability with serverless GPUs and automated scaling, letting you test locally and then burst to the cloud with no changes to your YAML. Collaboration with Docker This preview is the result of close collaboration between Microsoft and Docker. A Docker has always been focused on simplifying complex developer workflows. “With Compose for Agents, we’re extending that same experience that developers know and love from containers to agents, bringing the power of Compose to the emerging world of AI-native, agentic applications. It delivers the same simplicity and predictability to prototyping, testing, and deploying across local and cloud environments” said Elyi Aleyner, VP of Strategy and Head of Tech Alliances at Docker. “We’re excited to partner with Microsoft to bring this innovation to Azure Container Apps, enabling developers to go from ‘compose up’ on their laptops to secure, GPU-backed workloads in the cloud with zero friction.” Empowering choice Every team has its own favourite frameworks and tools. We’ve ensured that Compose for Agents on ACA is framework‑agnostic: you can use LangGraph for complex workflows, CrewAI for multi‑agent coordination, or Spring AI to integrate with your existing Java stack. Want to run a vector store from the MCP catalog alongside your own service? Simply add it to your Compose file. Docker’s curated catalog provides over a hundred ready‑to‑use tools and services for retrieval, document summarization, database access and more. ACA’s flexibility means you’re free to choose the stack that best fits your problem. Get started today The public preview of Compose for Agents support in Azure Container Apps is available now. You can: Install the latest Azure Container Apps Extension Define your application in a compose.yaml file, including models, tools and agent code and deploy to ACA via az containerapp compose up. ACA will provision GPU resources, dynamic sessions and auto‑scaling infrastructure automatically. Iterate locally using standard docker compose up commands, then push the same configuration to the cloud when you’re ready. For more detailed instructions please go to https://aka.ms/aca/compose-for-agents944Views2likes0CommentsFrom Timeouts to Triumph: Optimizing GPT-4o-mini for Speed, Efficiency, and Reliability
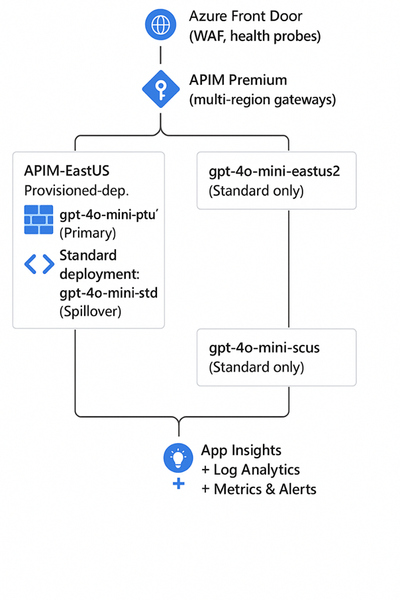
The Challenge Large-scale generative AI deployments can stretch system boundaries — especially when thousands of concurrent requests require both high throughput and low latency. In one such production environment, GPT-4o-mini deployments running under Provisioned Throughput Units (PTUs) began showing sporadic 408 (timeout) and 429 (throttling) errors. Requests that normally completed in seconds were occasionally hitting the 60-second timeout window, causing degraded experiences and unnecessary retries. Initial suspicion pointed toward PTU capacity limitations, but deeper telemetry revealed a different cause. What the Data Revealed Using Azure Data Explorer (Kusto), API Management (APIM) logs, and OpenAI billing telemetry, a detailed investigation uncovered several insights: Latency was not correlated with PTU utilization: PTU resources were healthy and performing within SLA even during spikes. Time-Between-Tokens (TBT) stayed consistently low (~8–10 ms): The model was generating tokens steadily. Excessive token output was the real bottleneck: Requests generating 6K–8K tokens simply required more time than allowed in the 60-second completion window. In short — the model wasn’t slow; the workload was oversized. The Optimization Opportunity The analysis opened a broader optimization opportunity: Balance token length with throughput targets. Introduce architectural patterns to prevent timeout or throttling cascades under load. Enforce automatic token governance instead of relying on client-side discipline. The Solution Three engineering measures delivered immediate impact: token optimization, spillover routing, and policy enforcement. Right-size the Token Budget Empirical throughput for GPT-4o-mini: ~33 tokens/sec → ~2K tokens in 60s. Enforced max_tokens = 2000 for synchronous requests. Enabled streaming responses for longer outputs, allowing incremental delivery without hitting timeout limits. Enable Spillover for Continuity Implemented multi-region spillover using Azure Front Door and APIM Premium gateways. When PTU queues reached capacity or 429s appeared, requests were routed to Standard deployments in secondary regions. The result: graceful degradation and uninterrupted user experience. Govern with APIM Policies Added inbound policies to inspect and adjust max_tokens dynamically. On 408/429 responses, APIM retried and rerouted traffic based on spillover logic. The Results After optimization, improvements were immediate and measurable: Latency Reduction: Significant improvement in end-to-end response times across high-volume workloads Reliability Gains: 408/429 errors fell from >1% to near zero. Cost Efficiency: Average token generation decreased by ~60%, reducing per-request costs. Scalability: Spillover routing ensured consistent performance during regional or capacity surges. Governance: APIM policies established a reusable token-control framework for future AI workloads. Lessons Learned Latency isn’t always about capacity: Investigate workload patterns before scaling hardware. Token budgets define the user experience: Over-generation can quietly break SLA compliance. Design for elasticity: Spillover and multi-region routing maintain continuity during spikes. Measure everything: Combine KQL telemetry, latency and token tracking for faster diagnostics. The Outcome By applying data-driven analysis, architectural tuning, and automated governance, the team turned an operational bottleneck into a model of consistent, scalable performance. The result: Faster responses. Lower costs. Higher trust. A blueprint for building resilient, high-throughput AI systems on Azure.660Views4likes0CommentsUnderstanding the Fundamentals of AI Concepts for Nonprofits
Artificial Intelligence (AI) has become a cornerstone of modern technology, driving innovation across various sectors. Nonprofits, too, can harness the power of AI to enhance their operations and amplify their impact. In this blog, we'll explore fundamental AI concepts, common AI workloads, Microsoft's Responsible AI policies, and the tools and services available through Azure AI, all tailored for the nonprofit sector. Understanding AI Workloads AI workloads refer to the different types of tasks that AI systems can perform. Here are some common AI workloads relevant to nonprofits: Machine Learning: This involves training a computer model to make predictions and draw conclusions from data. Nonprofits can use machine learning to predict donor behavior, optimize fundraising strategies, and analyze program outcomes. Computer Vision: This capability allows software to interpret the world visually through cameras, video, and images. Applications include identifying and tracking wildlife for conservation efforts or analyzing images to assess disaster damage. Natural Language Processing (NLP): NLP enables computers to understand and respond to human language. Nonprofits can use NLP for sentiment analysis of social media posts, language translation for multilingual communities, and developing conversational AI like chatbots for donor engagement. Anomaly Detection: This involves automatically detecting errors or unusual activity. It is useful for fraud detection in financial transactions, monitoring network security, and ensuring data integrity. Conversational AI: This refers to the capability of a software agent to engage in conversations with humans. Examples include chatbots and virtual assistants that can answer questions, provide recommendations, and perform tasks, enhancing donor and beneficiary interactions. Responsible AI Practices As AI technology continues to evolve, it is crucial to ensure it is developed and used responsibly. Microsoft's Responsible AI policies emphasize the importance of fairness, reliability, safety, privacy, security, inclusiveness, transparency, and accountability in AI systems. These principles guide the development and deployment of AI solutions to ensure they benefit everyone and do not cause harm. To learn more about Microsoft Responsible AI Practices click here: Empowering responsible AI practices | Microsoft AI Azure AI Services for Nonprofits Microsoft Azure offers a suite of AI services that enable nonprofits to build intelligent applications. Some key services include: Azure Machine Learning: A comprehensive platform for building, training, and deploying machine learning models. It supports a wide range of machine learning frameworks and tools, helping nonprofits analyze data and make informed decisions. To learn more or get started with Azure Machine Learning click here: Azure Machine Learning - ML as a Service | Microsoft Azure Azure AI Bot Service: A service for building conversational AI applications. It provides tools for creating, testing, and deploying chatbots that can interact with users through various channels, improving donor engagement and support services. To learn more or get started with Azure AI Bot Service click here: Azure AI Bot Service | Microsoft Azure Azure Cognitive Services: A collection of APIs that enable developers to add AI capabilities to their applications. These services include vision, speech, language, and decision-making APIs, which can be used for tasks like image recognition, language translation, and sentiment analysis. To learn more about the various Cognitive Service please click here: Azure AI Services – Using AI for Intelligent Apps | Microsoft Azure Conclusion AI has the potential to transform the nonprofit sector by enhancing efficiency, driving innovation, and providing valuable insights. By understanding AI workloads, adhering to responsible AI practices, and leveraging Azure AI services, nonprofits can unlock the full potential of AI to better serve their communities and achieve their missions. Embrace the power of AI to take your nonprofit organization to new heights and make a greater impact. For a deeper dive into the fundamental concepts of AI, please visit the module Fundamental AI Concepts. This resource will provide you with essential insights and a solid foundation to enhance your knowledge in the ever-evolving field of artificial intelligence.368Views0likes0CommentsCalculating Chargebacks for Business Units/Projects Utilizing a Shared Azure OpenAI Instance
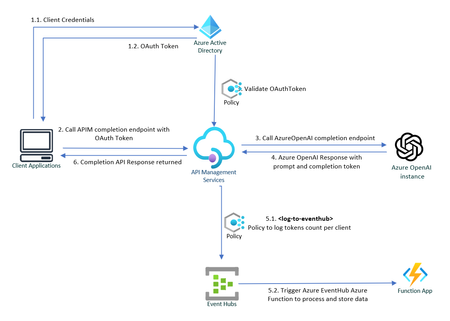
Azure OpenAI Service is at the forefront of technological innovation, offering REST API access to OpenAI's suite of revolutionary language models, including GPT-4, GPT-35-Turbo, and the Embeddings model series. Enhancing Throughput for Scale As enterprises seek to deploy OpenAI's powerful language models across various business units, they often require granular control over configuration and performance metrics. To address this need, Azure OpenAI Service is introducing dedicated throughput, a feature that provides a dedicated connection to OpenAI models with guaranteed performance levels. Throughput is quantified in terms of tokens per second (tokens/sec), allowing organizations to precisely measure and optimize the performance for both prompts and completions. The model of provisioned throughput provides enhanced management and adaptability for varying workloads, guaranteeing system readiness for spikes in demand. This capability also ensures a uniform user experience and steady performance for applications that require real-time responses. Resource Sharing and Chargeback Mechanisms Large organizations frequently provision a singular instance of Azure OpenAI Service that is shared across multiple internal departments. This shared use necessitates an efficient mechanism for allocating costs to each business unit or consumer, based on the number of tokens consumed. This article delves into how chargeback is calculated for each business unit based on their token usage. Leveraging Azure API Management Policies for Token Tracking Azure API Management Policies offer a powerful solution for monitoring and logging the token consumption for each internal application. The process can be summarized in the following steps: ** Sample Code: Refer to this GitHub repository to get a step-by-step instruction on how to build the solution outlined below : private-openai-with-apim-for-chargeback 1. Client Applications Authorizes to API Management To make sure only legitimate clients can call the Azure OpenAI APIs, each client must first authenticate against Azure Active Directory and call APIM endpoint. In this scenario, the API Management service acts on behalf of the backend API, and the calling application requests access to the API Management instance. The scope of the access token is between the calling application and the API Management gateway. In API Management, configure a policy (validate-jwt or validate-azure-ad-token) to validate the token before the gateway passes the request to the backend. 2. APIM redirects the request to OpenAI service via private endpoint. Upon successful verification of the token, Azure API Management (APIM) routes the request to Azure OpenAI service to fetch response for completions endpoint, which also includes prompt and completion token counts. 3. Capture and log API response to Event Hub Leveraging the log-to-eventhub policy to capture outgoing responses for logging or analytics purposes. To use this policy, a logger needs to be configured in the API Management: # API Management service-specific details $apimServiceName = "apim-hello-world" $resourceGroupName = "myResourceGroup" # Create logger $context = New-AzApiManagementContext -ResourceGroupName $resourceGroupName -ServiceName $apimServiceName New-AzApiManagementLogger -Context $context -LoggerId "OpenAiChargeBackLogger" -Name "ApimEventHub" -ConnectionString "Endpoint=sb://<EventHubsNamespace>.servicebus.windows.net/;SharedAccessKeyName=<KeyName>;SharedAccessKey=<key>" -Description "Event hub logger with connection string" Within outbound policies section, pull specific data from the body of the response and send this information to the previously configured EventHub instance. This is not just a simple logging exercise; it is an entry point into a whole ecosystem of real-time analytics and monitoring capabilities: <outbound> <choose> <when condition="@(context.Response.StatusCode == 200)"> <log-to-eventhub logger-id="TokenUsageLogger">@{ var responseBody = context.Response.Body?.As<JObject>(true); return new JObject( new JProperty("Timestamp", DateTime.UtcNow.ToString()), new JProperty("ApiOperation", responseBody["object"].ToString()), new JProperty("AppKey", context.Request.Headers.GetValueOrDefault("Ocp-Apim-Subscription-Key",string.Empty)), new JProperty("PromptTokens", responseBody["usage"]["prompt_tokens"].ToString()), new JProperty("CompletionTokens", responseBody["usage"]["completion_tokens"].ToString()), new JProperty("TotalTokens", responseBody["usage"]["total_tokens"].ToString()) ).ToString(); }</log-to-eventhub> </when> </choose> <base /> </outbound> EventHub serves as a powerful fulcrum, offering seamless integration with a wide array of Azure and Microsoft services. For example, the logged data can be directly streamed to Azure Stream Analytics for real-time analytics or to Power BI for real-time dashboards With Azure Event Grid, the same data can also be used to trigger workflows or automate tasks based on specific conditions met in the incoming responses. Moreover, the architecture is extensible to non-Microsoft services as well. Event Hubs can interact smoothly with external platforms like Apache Spark, allowing you to perform data transformations or feed machine learning models. 4: Data Processing with Azure Functions An Azure Function is invoked when data is sent to the EventHub instance, allowing for bespoke data processing in line with your organization’s unique requirements. For instance, this could range from dispatching the data to Azure Monitor, streaming it to Power BI dashboards, or even sending detailed consumption reports via Azure Communication Service. [Function("TokenUsageFunction")] public async Task Run([EventHubTrigger("%EventHubName%", Connection = "EventHubConnection")] string[] openAiTokenResponse) { //Eventhub Messages arrive as an array foreach (var tokenData in openAiTokenResponse) { try { _logger.LogInformation($"Azure OpenAI Tokens Data Received: {tokenData}"); var OpenAiToken = JsonSerializer.Deserialize<OpenAiToken>(tokenData); if (OpenAiToken == null) { _logger.LogError($"Invalid OpenAi Api Token Response Received. Skipping."); continue; } _telemetryClient.TrackEvent("Azure OpenAI Tokens", OpenAiToken.ToDictionary()); } catch (Exception e) { _logger.LogError($"Error occured when processing TokenData: {tokenData}", e.Message); } } } In the example above, Azure function processes the tokens response data in Event Hub and sends them to Application Insights telemetry, and a basic Dashboard is configured in Azure, displaying the token consumption for each client application. This information can conveniently be used to compute chargeback costs. A sample query used in dashboard above that fetches tokens consumed by a specific client: customEvents | where name contains "Azure OpenAI Tokens" | extend tokenData = parse_json(customDimensions) | where tokenData.AppKey contains "your-client-key" | project Timestamp = tokenData.Timestamp, Stream = tokenData.Stream, ApiOperation = tokenData.ApiOperation, PromptTokens = tokenData.PromptTokens, CompletionTokens = tokenData.CompletionTokens, TotalTokens = tokenData.TotalTokens Azure OpenAI Landing Zone reference architecture A crucial detail to ensure the effectiveness of this approach is to secure the Azure OpenAI service by implementing Private Endpoints and using Managed Identities for App Service to authorize access to Azure AI services. This will limit access so that only the App Service can communicate with the Azure OpenAI service. Failing to do this would render the solution ineffective, as individuals could bypass the APIM/App Service and directly access the OpenAI Service if they get hold of the access key for OpenAI. Refer to Azure OpenAI Landing Zone reference architecture to build a secure and scalable AI environment. Additional Considerations If the client application is external, consider using an Application Gateway in front of the Azure APIM If "streaming" is set to true, tokens count is not returned in response. In that that case libraries like tiktoken (Python), orgpt-3-encoder(javascript) for most GPT-3 models can be used to programmatically calculate tokens count for the user prompt and completion response. A useful guideline to remember is that in typical English text, one token is approximately equal to around 4 characters. This equates to about three-quarters of a word, meaning that 100 tokens are roughly equivalent to 75 words. (P.S. Microsoft does not endorse or guarantee any third-party libraries.) A subscription key or a custom header like app-key can also be used to uniquely identify the client as appId in OAuth token is not very intuitive. Rate-limiting can be implemented for incoming requests using OAuth tokens or Subscription Keys, adding another layer of security and resource management. The solution can also be extended to redirect different clients to different Azure OpenAI instances. For example., some clients utilize an Azure OpenAI instance with default quotas, whereas premium clients get to consume Azure Open AI instance with dedicated throughput. Conclusion Azure OpenAI Service stands as an indispensable tool for organizations seeking to harness the immense power of language models. With the feature of provisioned throughput, clients can define their usage limits in throughput units and freely allocate these to the OpenAI model of their choice. However, the financial commitment can be significant and is dependent on factors like the chosen model's type, size, and utilization. An effective chargeback system offers several advantages, such as heightened accountability, transparent costing, and judicious use of resources within the organization.23KViews10likes10Comments