azure cloud service
26 TopicsAdjusting VM Size in Classic Cloud Services Without .csdef access for Migration to CSES
With the deprecation of Classic Cloud Service, many customers are moving to Cloud Service Extended Support, however, it is common for some customers to not have or have lost the code used by the application. Some customers try to use in-place migration and run into problems related to the VM size, however this can only be modified through the .csdef, this blog hopes to help customers who have these types of problems.3.9KViews1like0Comments
Migrate classic Cloud Service to CSES when SKU is unsupported without original project
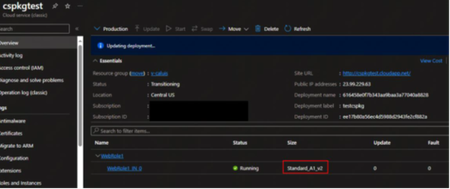
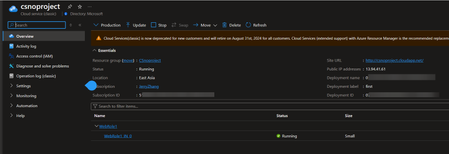
With the impending retirement of the classic Cloud Service (CS) on August 31st, 2024, an increasing number of users have initiated the migration of their classic Cloud Service to Cloud Service Extended Support (CSES). To facilitate this transition, an official feature known as in-place migration has been introduced, enabling the seamless migration of classic CS to CSES without incurring any downtime. However, certain limitations exist, with the VM size used by the CS role being a notable factor. As per documentation, the A-series, encompassing Small, Medium, and Large VM sizes, is no longer supported in CSES, necessitating their conversion to corresponding VM sizes as a preliminary step. To apply a change in the VM size utilized in classic CS, a redeployment/upgrade is required subsequent to modifying the VM size in the .csdef file. While this is generally a straightforward operation, in cases where the project deployed in the classic CS is considerably dated, there is a possibility that the original project may be lost. Consequently, re-packaging the project into .cspkg and .cscfg files for redeployment/upgrade becomes unfeasible. This blog will primarily address this specific scenario and outline strategies for resolving this predicament. Pre-requirement: A healthy and running classic CS with project deployed in production slot. The used VM size of at least one role is A-series. A classic Storage Account under same subscription as classic CS. (The UI to create classic Storage Account in Azure Portal is already invisible because this resource type is supposed to be retired for new creation. But it’s still possible to use command to create it for now. Sample command like: New-AzResource -ResourceName <accountname> -ResourceGroupName <resourcegroupname> -ResourceType "Microsoft.ClassicStorage/StorageAccounts" -Location <location> -Properties @{ AccountType = "Standard_LRS" } -ApiVersion "2015-06-01") Install Az PowerShell module in local machine. Attention! By following this way, a short downtime is unavoidable. If this needs to be applied on a production environment, please do the same test in another environment at first. Details: Refer to New Deployment Based On Existing Classic Cloud Service - Microsoft Community Hub to get the .cspkg and .cscfg files at first. (Please remember to install the .pfx certificate in the machine where the Get Package request will be sent.) The expected result is that the .cspkg and .cscfg files will be found in the classic storage account container. Please download them to local machine. (optional) If the new CSES needs to use same IP address as original classic CS, please follow these steps. Install legacy Azure PowerShell module Reserve current IP as reserved IP address New-AzureReservedIP –ReservedIPName <reserved ip name> –Location <classic CS location> -ServiceName <classic CS name> The reserved IP address will be found in a resource group called Default-Networking. c. Cut down the association between reserved IP and classic CS. After running this command, the classic CS IP address will be changed. If the application/client side is using IP address to connect to classic CS, it will start failing. Remove-AzureReservedIPAssociation –ReservedIPName <reserved ip name> -ServiceName <classic CS name> Reference of step b and c can be found here: Manage Azure reserved IP addresses (Classic) | Microsoft Learn d. Refer to this document, convert the reserved IP address into a public IP address which can be used by CSES. Move-AzureReservedIP -ReservedIPName <reserved IP name> -Validate Move-AzureReservedIP -ReservedIPName <reserved IP name> -Prepare Move-AzureReservedIP -ReservedIPName <reserved IP name> -Commit After the command is finished, you will find the converted public IP in a resource group called <publicipaddress-name>-Migrated. 3. By default the public IP address is without any domain name. If it’s needed, please configure it in Configuration page. 4. Move the public IP address to the same resource group where the new CSES resource will be created. (optional) If the classic CS is using certificate, create a Key Vault resource in the same subscription and same region, then upload the certificate(s) into Key Vault, Certificates. For more information, please refer to here. Create a Virtual Network in the same resource group and same region as new CSES resource. Open the downloaded .cscfg file with any text editor and add/modify the NetworkConfiguration part: <NetworkConfiguration> <VirtualNetworkSite name="xxx" /> <AddressAssignments> <InstanceAddress roleName="xxx"> <Subnets> <Subnet name="xxx" /> </Subnets> </InstanceAddress> </AddressAssignments> </NetworkConfiguration> (optional) If the step 2 is followed, please also add ReservedIPs part. <NetworkConfiguration> <VirtualNetworkSite name="xxx" /> <AddressAssignments> <InstanceAddress roleName="xxx"> <Subnets> <Subnet name="xxx" /> </Subnets> </InstanceAddress> <ReservedIPs> <ReservedIP name="xxx" /> </ReservedIPs> </AddressAssignments> </NetworkConfiguration> After modifying the .cscfg file, please upload the .cscfg and .cspkg file into a storage account, blob container, then generate and note down the SAS URL of these two files. If the step 2 is not followed, please manually create a public IP address with Basic sku and static IP address assignment mode. To create the new CSES resource, there are two possible ways: Using PowerShell command and using ARM template. The key point is to use the SKU override feature to replace the VM size setting in the .csdef file. (Attention! Since the VM size configured inside of the .csdef file is still the unsupported VM size, please remember to use the override SKU feature in ARM template or PowerShell command every time in the future as well. Otherwise the deployment/upgrade will be failed.) Using PowerShell script: If the Key Vault is not used, remove the first $osProfile part and the last OSProfile parameter of New-AzCloudService command. $keyVault = Get-AzKeyVault -ResourceGroupName <key vault resource group> -VaultName <key vault resource name> $certificate = Get-AzKeyVaultCertificate -VaultName <key vault resource name> -Name <certificate name in Key Vault> $secretGroup = New-AzCloudServiceVaultSecretGroupObject -Id $keyVault.ResourceId -CertificateUrl $certificate.SecretId $osProfile = @{secret = @($secretGroup)} $cspkgSAS = <SAS URL of cspkg file> $cscfgSAS = <SAS URL of cscfg file> $role1 = New-AzCloudServiceRoleProfilePropertiesObject -Name <Role1 name> -SkuName <new supported vm size> -SkuTier 'Standard' -SkuCapacity <instance number> $role2 = New-AzCloudServiceRoleProfilePropertiesObject -Name <Role2 name> -SkuName <new supported vm size> -SkuTier 'Standard' -SkuCapacity <instance number> $roleProfile = @{role = @($role1, $role2)} $publicIP = Get-AzPublicIpAddress -ResourceGroupName <public IP resource group> -Name <public IP name> $feIpConfig = New-AzCloudServiceLoadBalancerFrontendIPConfigurationObject -Name <frontend IP config name> -PublicIPAddressId $publicIP.Id $loadBalancerConfig = New-AzCloudServiceLoadBalancerConfigurationObject -Name <load balancer config> -FrontendIPConfiguration $feIpConfig $networkProfile = @{loadBalancerConfiguration = $loadBalancerConfig} # Create Cloud Service New-AzCloudService -Name <CSES name> -ResourceGroupName <resource group name> -Location <CSES Location> -AllowModelOverride -PackageUrl $cspkgSAS -ConfigurationUrl $cscfgSAS -UpgradeMode 'Auto' -RoleProfile $roleProfile -NetworkProfile $networkProfile -OSProfile $osProfile Using ARM template: If Key Vault is not used, remember to remove the secrets in osprofile, keep it empty as "osProfile": {}, remove secrets parameter part in template file and remove secrets parameter from parameter file. Template file: { "$schema": "https://schema.management.azure.com/schemas/2015-01-01/deploymentTemplate.json#", "contentVersion": "1.0.0.0", "parameters": { "cloudServiceName": { "type": "string", "metadata": { "description": "Name of the cloud service" } }, "location": { "type": "string", "metadata": { "description": "Location of the cloud service" } }, "deploymentLabel": { "type": "string", "metadata": { "description": "Label of the deployment" } }, "packageSasUri": { "type": "securestring", "metadata": { "description": "SAS Uri of the CSPKG file to deploy" } }, "configurationSasUri": { "type": "securestring", "metadata": { "description": "SAS Uri of the service configuration (.cscfg)" } }, "roles": { "type": "array", "metadata": { "description": "Roles created in the cloud service application" } }, "publicIPName": { "type": "string", "defaultValue": "contosocsIP", "metadata": { "description": "Name of public IP address" } }, "upgradeMode": { "type": "string", "defaultValue": "Auto", "metadata": { "UpgradeMode": "UpgradeMode of the CloudService" } }, "secrets": { "type": "array", "metadata": { "description": "The key vault id and certificates referenced in the .cscfg file" } } }, "variables": { "cloudServiceName": "[parameters('cloudServiceName')]", "subscriptionID": "[subscription().subscriptionId]", "lbName": "[concat(variables('cloudServiceName'), 'LB')]", "lbFEName": "[concat(variables('cloudServiceName'), 'LBFE')]", "resourcePrefix": "[concat('/subscriptions/', variables('subscriptionID'), '/resourceGroups/', resourceGroup().name, '/providers/')]" }, "resources": [ { "apiVersion": "2020-10-01-preview", "type": "Microsoft.Compute/cloudServices", "name": "[variables('cloudServiceName')]", "location": "[parameters('location')]", "tags": { "DeploymentLabel": "[parameters('deploymentLabel')]" }, "properties": { "packageUrl": "[parameters('packageSasUri')]", "configurationUrl": "[parameters('configurationSasUri')]", "upgradeMode": "[parameters('upgradeMode')]", "allowModelOverride": true, "roleProfile": { "roles": "[parameters('roles')]" }, "networkProfile": { "loadBalancerConfigurations": [ { "id": "[concat(variables('resourcePrefix'), 'Microsoft.Network/loadBalancers/', variables('lbName'))]", "name": "[variables('lbName')]", "properties": { "frontendIPConfigurations": [ { "name": "[variables('lbFEName')]", "properties": { "publicIPAddress": { "id": "[concat(variables('resourcePrefix'), 'Microsoft.Network/publicIPAddresses/', parameters('publicIPName'))]" } } } ] } } ] }, "osProfile": { "secrets": "[parameters('secrets')]" } } } ] } Parameter file: { "$schema": "https://schema.management.azure.com/schemas/2015-01-01/deploymentParameters.json#", "contentVersion": "1.0.0.0", "parameters": { "cloudServiceName": { "value": <CSES name> }, "location": { "value": <CSES region> }, "deploymentLabel": { "value": "deployment label of cses by ARM template" }, "packageSasUri": { "value": <.csdef SAS URL> }, "configurationSasUri": { "value": <.cscfg SAS URL> }, "roles": { "value": [ { "name": <role1 name>, "sku": { "name": <new supported VM size>, "tier": "Standard", "capacity": <instance number> } }, { "name": <role2 name>, "sku": { "name": <new supported VM size>, "tier": "Standard", "capacity": <instance number> } } ] }, "publicIPName": { "value": <public IP address name> }, "upgradeMode": { "value": "Auto" }, "secrets": { "value": [ { "sourceVault": { "id": "/subscriptions/<subscription id>/resourceGroups/<resource group name>/providers/Microsoft.KeyVault/vaults/<key vault name>" }, "vaultCertificates": [ { "certificateUrl": "https://<key vault name>.vault.azure.net/secrets/<certificate name>/<secret ID>" } ] } ] } } } Result:3.9KViews0likes0Comments
Instance level public ip address configuration in the cloud service.
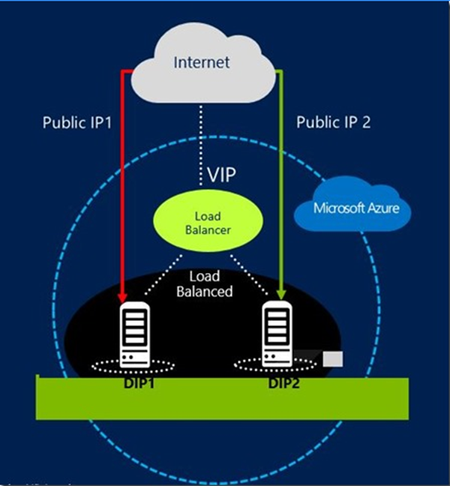
An Instance-Level Public IP Address (PIP) unlike the Virtual IP Address (VIP) is not load balanced. While the virtual ip is assigned to the cloud service and shared by all virtual machines and role instances in it, the public ip is associated only with a single instance’s NIC. The public ip is particularly useful in multi-instance deployments where each instance can be reachable independently from the Internet. The picture below illustrates the value of PIP and differentiates it from the VIP.4.8KViews2likes2CommentsHow to manage the VIP swap in cloud service extended support via Powershell
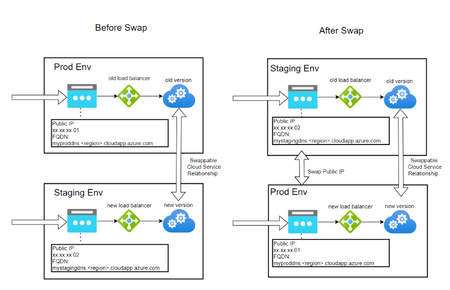
You can swap between two independent cloud service deployments in Azure Cloud Services (extended support). Unlike in Azure Cloud Services (classic), the Azure Resource Manager model in Azure Cloud Services (extended support) doesn't use deployment slots. In Azure Cloud Services (extended support), when you deploy a new release of a cloud service, you can make the cloud service "swappable" with an existing cloud service in Azure Cloud Services (extended support). In this blog, we can see how to have a version update via Powershell and REST API.6.1KViews3likes1CommentHow to use Azure DevOps to publish cloud service extended support
Azure cloud service extended support(CSES) is a new Azure Resource Manager based deployment model for Azure Cloud Services product. Cloud Services (extended support) has the primary benefit of providing regional resiliency along with feature parity with Azure Cloud Services deployed using Azure Service Manager. It also offers some ARM capabilities such as role-based access and control (RBAC), tags, policy, and supports deployment templates. For the classic cloud service, we have Azure DevOps built-in pipeline task Azure Cloud Service Deployment task - Azure Pipelines | Microsoft Learn to help us manage the CI/CD progress easily and the task for CSES is not ready yet. In this blog, I have a brief guide on how to use the Azure ARM template to create or update the CSES deployment.6.3KViews4likes0CommentsRetrieve Cloud Service Extended Support detail via PowerShell
This blog is mainly about how to retrieve the CSES configuration via PowerShell and REST API. It will cover the following sections: PowerShell command to get the CSES configuration PowerShell to send out REST API request to get the CSES configuration Sample to retrieve OS Family, OS Version and any other data Prerequisites No matter PowerShell command or Rest API request will be used to get the information, the PowerShell Azure Az module is necessary. For the installation details, please refer to this document. PowerShell command to get the CSES configuration To use Get-AzCloudService (Az.CloudService) | Microsoft Learn to get the CSES configuration data, we can follow these steps: Use command Connect-AzAccount to login Use command Get-AzCloudService to get the full picture of your CSES resource and save it into a PowerShell variable such as $cses in the following example Convert the configuration of the CSES into XML format. The used commands will be: Connect-AzAccount $cses = Get-AzCloudService -ResourceGroupName “xxx” -CloudServiceName “xxx” [xml]$xml = $cses.Configuration PowerShell to send out REST API call to get the CSES configuration To use Cloud Services - Get - REST API (Azure Compute) | Microsoft Learn to get the CSES configuration data by sending out REST API call in PowerShell, we can follow these steps: Use command Connect-AzAccount to login Use command Invoke-AzRestMethod to send out the REST API call. The path in the command will be the same for every user except the value such as your own subscription ID, resource group name and CSES resource name. Once we get the response, we can use some additional PowerShell function like convertfrom-json to proceed the data and then save it into a PowerShell variable such as $csesapi in the example Convert the configuration of the CSES into XML format The used commands will be: Connect-AzAccount $csesapi = (Invoke-AzRestMethod -Path "/subscriptions/{subscription-id}/resourceGroups/{resource-group-name}/providers/Microsoft.Compute/cloudServices/{CSES-resource-name}?api-version=2021-03-01").Content | convertfrom-json [xml]$xml = $csesapi.properties.configuration Sample about how to get OS Family, OS Version and any other data No matter PowerShell command or REST API is used, with above instruction, the $xml from both ways will be the same. Basically, this is how my example CSES configuration data looks like: The $xml is the whole configuration file in XML format. In order to get the data, such as osFamily, osVersion or VirtualNetworkSite, following the construction of this XML file to add related name to identify the data of which level is needed will be enough. For example, for osVersion/osFamily, the path to it will be ServiceConfiguration -> osVersion/osFamily. So the expression to use in PowerShell to get the data will be: $xml.ServiceConfiguration.osVersion / $xml.ServiceConfiguration.osFamily And for the VirtualNetworkSite, the path to it will be ServiceConfiguration -> NetworkConfiguration -> VirtualNetworkSite -> name. So the expression to use in PowerShell to get the data will be: $xml.ServiceConfiguration.NetworkConfiguration.VirtualNetworkSite.name Note: It’s possible that we have more than one role in our configuration, the expression to locate a role which is not the first role will be $xml.ServiceConfiguration.Role[1]. The number “1” here means the second role in the configuration data because this counter starts from 0. If there are two roles in same configuration data, the expression $xml.ServiceConfiguration.Role[1].Instances.count will be able to return how many instances there are for the second role.3.6KViews0likes0CommentsTroubleshoot Cloud Service Application issue with Application Insight – Part 2 Common Scenarios
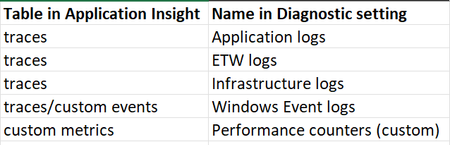
When we use Azure Cloud Service to host website or proceed some data process, it’s always recommended to integrate a custom log system to collect more detailed information and log records. Application Insight is a such kind of official tool provided and supported by Azure. In part 1, we learn how to use the basic features of Application Insight with Cloud Service. In this blog (part 2), we’ll talk about some common issues which we can benefit from using Application Insight and how to troubleshoot them. In this blog, Cloud Service stands for both classic Cloud Service and Cloud Service Extended Support because the Application Insight works on both of them in same way. This blog will contain the following parts: The relationship between Windows Azure Diagnostic setting and Application Insight Common advanced way to use Application Insight with Cloud Service The way to add custom log The way to record the running WorkerRole application as request Check the failed request and related exception of WebRole Check the failed request and related exception of WorkerRole Common scenarios and related guidelines Monitor the Memory and Request status of the Cloud Service WebRole by Application Insight Troubleshoot performance issues such as slow response time Troubleshoot performance issues such as high CPU/Memory of WorkerRole Pre-requisites: Please kindly follow the part 1 of this blog at first to have general knowledge about using Application Insight on Cloud Service. The relationship between Windows Azure Diagnostic setting and Application Insight As explained in part 1, when we enable Application Insight on Cloud Service project, we must enable Azure Diagnostic setting at same time. The reason is except the default setting, some metrics data and log collected Azure Diagnostic setting will also be sent into Application Insight. Since this blog is focusing on the Application Insight, there will not be a detailed presentation of the Diagnostic setting of Cloud Service. About the different options in Diagnostic setting, please kindly check document about their definition. Here we’ll only point out one important piece of information which may be confusing: When the Diagnostic setting is enabled, the performance counter setting works differently on WebRole and WorkerRole: For WebRole, the following 9 metrics data will be automatically collected even if we disable the performance counter in Diagnostic Setting. These 9 metrics data will be saved in performanceCounter table of Application Insight. The custom additional setting which we select in performance counter of Diagnostic Setting, such as \Process(w3wp)\% Processor Time, will be saved into customMetrics table if it’s enabled. \Process(??APP_WIN32_PROC??)% Processor Time \Memory\Available Bytes .NET CLR Exceptions(??APP_CLR_PROC??)# of Exceps Thrown / sec \Process(??APP_WIN32_PROC??)\Private Bytes \Process(??APP_WIN32_PROC??)\IO Data Bytes/sec \Processor(_Total)% Processor time \ASP.NET Applications(??APP_W3SVC_PROC??)\Requests/sec \ASP.NET Applications(??APP_W3SVC_PROC??)\Request Execution Time \ASP.NET Applications(??APP_W3SVC_PROC??)\Requests In Application Queue 2. For WorkerRole, if we disable the performance counter in Diagnostic Setting, there will be no metrics data of the performance automatically collected and saved in Application Insight. 3. For both WebRole and WorkerRole, there is always a kind of metric data which will be saved into Application Insight automatically, HeartBeatState. This metric is to identify whether the instance is still healthy at server level. It will be triggered every 15 minutes and saved into customMetrics table. For all the other performance metric data, like WebRole, we need to manually enable it in performance counter of Diagnostic Setting. Please keep in mind that Application Insight will generate record only when there is really data collected. For example, if we deploy a WebRole but never send request to it, or if we deploy a WorkerRole but the code will not read/write data from/into disk at all, or the amount of data IO is quite low, it’s possible that Application Insight will not record any information. As shared in part 1, the relationship between the options in Diagnostic setting and table name in Application Insight logs page is: Common advanced way to use Application Insight with Cloud Service In this part, we’ll provide several common advanced ways to use Application Insight with Cloud Service. Compared to part 1, we will dig deeper into the advanced features such as using Azure Application Insight SDK in Cloud Service project to generate or modify the data saved into Application Insight. The way to add custom log It’s usual that the developers need to add some custom log in their application. This feature is also supported by Application Insight. For that, comparing to the basic setup which we presented in part 1, we need to additionally install the SDK in the project. For details, please kindly refer to this document. The startup function of WebRole can normally be Application_Start() in Global.asax. And the one of WorkerRole can normally be OnStart() in WorkerRoleName.cs. In the official document, the recommended code to set the instrumentation key is: TelemetryConfiguration configuration = TelemetryConfiguration.CreateDefault(); configuration.InstrumentationKey = RoleEnvironment.GetConfigurationSettingValue("APPINSIGHTS_INSTRUMENTATIONKEY"); var telemetryClient = new TelemetryClient(configuration); This way can only set the configuration for one specific telemetryClient, which is used to communicate with Application Insight and send data. Since we may need to create telemetry clients in different classes, we can more easily set a default setting as what official example does. TelemetryConfiguration.Active.InstrumentationKey = RoleEnvironment.GetConfigurationSettingValue("APPINSIGHTS_INSTRUMENTATIONKEY"); Then no matter where we want to add custom log, we simply need to: using Microsoft.ApplicationInsights; TelemetryClient ai = new TelemetryClient(); ai.TrackTrace("The custom log context"); With the above lines, the information will be logged into Application Insight, traces table. Except the trace log, we can also use this way to record down the handled exceptions. More details will be explained in next two parts. ai.TrackException(exception); The way to record the running WorkerRole application as request By design of Cloud Service, the request of WebRole is automatically marked with unique ID to identify the correlation. In WorkerRole, there isn’t such a system. But it’s possible to simulate the result of the WorkerRole application progress as a request and record this request into Application Insight. This can simplify our way to check the working status of the application in WorkerRole. For more details about ai, please refer to the previous part, The way to add custom log. The following is my WorkerRole application as example. This worker role will always keep adding trace logs into Application Insight every 30 seconds. But it will not always be added successfully because I use one changing bool variable select to make the Run function return a handled exception in every two loops. The trace log recorded into Application Insight will contain the timestamp, a fully random GUID as correlation ID to identify the relationship between request record and other records. Every loop is considered as a request, so it will generate a record of request with the start timestamp, the duration, the success status, the response code (200 for success and 500 for exception) and the correlation ID. For the information of the request recorded, only Duration and Success status are necessary according to the document. All the other information can be removed. The reason why I put it into the request record is: Start timestamp and response code can make it like a real request and different response code, for example 400 and 500 for failed requests can help when we want to identify different failure reasons. If your application is simple thread, then the ID might not be so important because we can track different trace logs, exceptions and requests simply by timestamp. But if your application is multiple thread, imagine at same moment, there will be trace logs, exceptions and request records for different threads, it will not be possible any longer for us to track them by timestamp. A correlation ID which is used through all steps will be very important. According to the document, the ID of a request should be globally unique. To make sure the example works perfectly, we should add a function to verify if a newly generated random GUID is already used by any request records in same Application Insights. using Microsoft.WindowsAzure.ServiceRuntime; using System; using System.Diagnostics; using Microsoft.ApplicationInsights; using Microsoft.ApplicationInsights.Extensibility; using Microsoft.ApplicationInsights.DataContracts; namespace WorkerRole1 { public class WorkerRole : RoleEntryPoint { private TelemetryClient ai = new TelemetryClient(); private bool select = true; private int a = 0; private int b; private volatile bool onStopCalled = false; private volatile bool returnedFromRunMethod = false; private Stopwatch requestTimer; private bool requestResult; public override void Run() { ai.TrackTrace("WorkerRole1 is running AI"); var request = new RequestTelemetry(); while (true) { request.Name = "A test request"; request.Id = Guid.NewGuid().ToString(); request.StartTime = DateTimeOffset.UtcNow; ai.TrackTrace("New cycle. AI " + DateTimeOffset.UtcNow.ToString() + " " + request.Id); requestTimer = Stopwatch.StartNew(); try { if (onStopCalled == true) { ai.TrackTrace("Onstopcalled WorkerRole AI"); returnedFromRunMethod = true; return; } if (select == true) { select = false; b = 100 / a; } else { select = true; b = 100 / 10; } ai.TrackTrace("normal WorkerRole AI " + DateTimeOffset.UtcNow.ToString() + " " + request.Id); requestResult = true; } catch (Exception ex) { ai.TrackTrace("Exception WorkerRole AI " + DateTimeOffset.UtcNow.ToString() + " " + request.Id); ai.TrackException(ex, new Dictionary<string, string>() { { "id", request.Id } }); requestResult = false; } request.Success = requestResult; request.Duration = requestTimer.Elapsed; request.ResponseCode = requestResult ? "200" : "500"; ai.TrackRequest(request); System.Threading.Thread.Sleep(30*1000); } } public override bool OnStart() { TelemetryConfiguration.Active.InstrumentationKey = RoleEnvironment.GetConfigurationSettingValue("APPINSIGHTS_INSTRUMENTATIONKEY"); bool result = base.OnStart(); return result; } public override void OnStop() { onStopCalled = true; while (returnedFromRunMethod == false) { System.Threading.Thread.Sleep(1000); } } } } P.S. We can use custom telemetry to do the same thing, but there will be many more configurations and more concepts to understand, so I don’t use it here. For more information, please kindly refer to the official example. Please pay attention to the specific lines in the above example project which are necessary to record request into Application Insight: Line 4 to 6 are to import the Application Insight SDK Line 12 is to define a private TelemetryClient Line 25 is a generate a RequestTelemetry. Once it’s created, all the changes should be saved into this RequestTelemetry and SDK will save this RequestTelemetry into Application Insight. Line 29 to 31 are to configure the Name, Id and StartTime property of the request. Line 66 to 69 are to set Success, Duration and ResponseCode property of the request, then save it into Application Insight. Except the above necessary steps, please also pay attention to the way how we save the custom Trace log and Exception, such as line 61 and 62. The unique specific ID will be very helpful for us to track the request workflow in Application Insight if your application is multi thread. With the above way, we can easily track the operation result of WorkerRole application as request result of WebRole application in Application Insights. Check the failed request and related exception of WebRole Usually, when we need to check the exception of WebRole, there must be requests sent and handled by IIS. For such kind of failed request, the unhandled exception and the handled exception (which is in try function) with ai.TrackException will be automatically collected into exception table. (For more details about ai, please refer to the previous part, The way to add custom log) P.S. For the example exception in the screenshot, if there isn’t ai.TrackException in line 47, the exception will be considered as handled exception, but it will not be recorded into Application Insight. There are two possible ways to find the exception record by a failed request record. One way is explained in the “How to check the performance summary of Cloud Service WebRole” in part 1. We only need to find the failed request in Operations page by adjusting the time range and selecting corresponding operation. By clicking on the operation name, the failed requests with specific exception type or specific response code will be listed automatically and we can check the details. The other way is using the Logs page of Application Insights. This way is more complicated, but it can allow you to use more custom filters to look for the specific types of exception and provide more details which will not be displayed by first way. By design of Cloud Service, the request of WebRole is automatically marked with unique ID to identify the correlation. We only need to know how we can find them in Application Insight. What we need to do is: Locate the failed request in requests table and record its id requests | where resultCode == "500" Find the exception with same id in exceptions table exceptions | where operation_ParentId == "8d1adf11abf73c42" The way of tracking exceptions based on a failed request will be very helpful when we want to troubleshoot an intermittent failure issue since it will contain the complete callstack of that request. Check the failed request and related exception of WorkerRole Since the unhandled exception of WorkerRole may cause the whole application downtime, we consider that all the exceptions in WorkerRole should be handled, which means to be included by try function. As WebRole, for the handled exceptions, we need to use ai.TrackException to record the exceptions into Application Insight. (For more details about ai, please refer to the previous part, The way to add custom log) For the exception in WorkerRole, the way to check them is quite like the one of WebRole. The only difference is that there isn’t a built-in system to capture, or we say to record the exceptions automatically, so some additional code is needed for that. Here we need to talk about the multiple possible situations: Our WorkerRole doesn’t include a system of recording custom requests (refer to previous part, The way to record the function of WorkerRole application as request), the only data which we can use to track the relationship between exception record and real operation in application is the timestamp. In this situation, the way of checking Failures page is still possible for user to use, but we will need to switch to Exceptions page and check the timestamp by ourselves. The way to check accurate data in Logs page can also be used. The following is an example query to check exceptions between a specific time range. exceptions | where timestamp between (datetime(2022-05-11 00:00) .. datetime(2022-05-13 00:00)) Our WorkerRole includes a system of recording custom requests with custom ID but it’s not included in the exception record, it will be the same as situation 1. Our WorkerRole includes a system of recording custom requests with custom ID and it’s included in the exception record, such as the line 62 of the example of previous part The way to record the function of WorkerRole application as request, it will be the same as situation of WebRole. We’ll be able to use both ways of checking Failures page and Logs page to find the related requests and exceptions. The query used in Logs page will be like: requests | where success == False exceptions | where * contains "ade4308c-28cb-4aca-bda1-0ba7c32b8c36" Common scenarios and related guidelines In this part, we’ll provide several commonly asked scenarios and their related guidelines about how to use Application Insight to meet the requirements. Monitor the Memory and Request status of the Cloud Service WebRole by Application Insight It’s an often-asked question how we can monitor the Memory of the Cloud Service. For WebRole, we can also monitor the request status including the number of total requests, failed requests, exceptions etc. It’s reasonable because in the default metrics page of Cloud Service, the only collected data are CPU percentage, disk read/write and network in/out. To meet this requirement, it’s the most basic usage of Application Insight. What we need to do is to only enable Application Insight on the role where we want to collect metrics data from and that’s all. We do not need any additional configuration in the diagnostic setting. The automatically collected data will contain all needed data for Memory usage and request status of a WebRole. To see the collected data, it’s recommended to use the Metrics page of the Application Insight. Under Application Insight standard metrics as Metric Namespace, we can find the Available memory under Server part for the memory. Also we can find Server requests under Server part, Failed requests and exceptions under Failure part or some other metric type to monitor the request status. After checking the metrics data, if we need to get more detailed information such as which kind of exceptions the application is returning, we can switch to corresponding page, such as Failures or Performance page. Monitor the Memory and Request status of the Cloud Service WorkerRole by Application Insight Similar to WebRole, we can also monitor the memory and request status of the Cloud Service. But there will be some additional limitations: For WorkerRole, the memory metrics data will not be automatically collected. To monitor the memory status, we need to enable the \Memory\Available MBytes from Performance Counters of Diagnostic Setting. The collected data will be in custom metrics table of Logs page. To view the metrics chart of the collected memory data, we can switch to the Metrics page of Application Insight, select Log-based metrics in Metric Namespace and \Memory\Available MBytes under CUSTOM in Metric. The chart of the Available Memory of selected time range will be displayed. rt P.S. Please pay attention to the following 2 points: The dotted line in the chart means that the data is not accurate enough to generate the data or the data is missed during that time range. From the Logs, we can see the interval of collecting the Memory data is about 3 minutes. In the chart above, since the time range is set to Last hour, the time difference between every two points will be less than 3 minutes so the collected data will not be accurate enough. Thus, it’s dotted line. The unit of the data here is 2.5B. It’s not 2.5 byte, but 2.5 billion. 2.5 billion bytes are almost 2.5 GBytes so we can think it’s almost the same as a chart with unit GByte. Troubleshoot performance issues such as slow response time This is also a commonly asked question. For example, when our Cloud Service WebRole receives a request, it needs to get some data from a remote server, such as SQL Database, then generate the data into a web page and return it to the user. Imagine that this progress is much slower than expected but still successful, it’s reasonable that we want to clarify whether most of time spent is during the communication with SQL Database or during the progress inside the Cloud Service. For that we need to add some additional custom log to record the timestamp of each step, such as start of the progress, start of the communication with SQL Database, end of the communication with SQL Database and end of generating the webpage etc. The above is only one possible scenario as example. The design of the custom log system needs to be done by developers for different scenarios. In this blog, we’ll only provide a few tips about how to design a such kind of custom log: For both WorkerRole and WebRole, please check previous part The way to add custom log to save custom trace log into Application Insights. It’s recommended to save trace log at every process start step. For example, in the above example scenario, we can add trace log at following points: When the WebRole receives the request When the WebRole starts to build communication with SQL server When the WebRole receives the data returned by SQL server and starts generating the webpage When the WebRole generates the webpage and returns it to user If the main process is an application in WorkerRole, please check previous part The way to record the function of WorkerRole application as request to add custom correlation ID into custom request record and exception record. Once the system is online, we can check the requests in the Performance page of Application Insights and focus on the request durations by following: Select a specific operation which we want to check (optional) Scale the duration distribution chart to the longest duration part Click on Drill into x Samples Click on one request as example and get the built-in or custom ID of this request If the system is not quite complicated, the time spent by different steps will be displayed in the End-to-end transaction chart. If the system is complicated or we’re using a custom ID which causes it unable to display the data in chart, we can get all related trace logs containing same correlation ID by following query: traces | where * contains "ade4308c-28cb-4aca-bda1-0ba7c32b8c36" By this way, we can calculate the difference between every trace log to get the time spent by every step. Troubleshoot performance issues such as high CPU/Memory of WorkerRole Sometimes we also need to identify issues such as a WorkerRole consuming very high CPU/Memory. What we can observe from outside of the Cloud Service is that the WorkerRole is consuming much CPU/Memory but we cannot know what exactly is happening in the instance. To troubleshoot such kind of issue, we mainly could do it by two steps: We need to add a custom log to track every step which the WorkerRole application will do. This is very important because with this step, we can identify if the application is still running well and compare the time spent in each step with the normal situation. This can help us to identify whether the application is affected by the high CPU/Memory issue. About how to add custom log system, please kindly refer to the previous part The way to add custom log. We may also need to capture the dump file. But since this blog is mainly regarding the usage of Application Insight, we’ll only give some simple ideas: We can RDP into the instance having high CPU/Memory issue and verify which process is consuming most of the CPU/Memory. If it’s WaWorkerHost, then it means that it’s the application itself consuming so much CPU/Memory. If the instances are having high CPU/Memory and the application is just with low-performance but not crashed, then we can try to RDP into the instance and capture a dump file for this. For more details about how to capture the dump file, please kindly refer to this document. For example, we can use following command to capture a dump file when the CPU consumed by WaWorkerHost is higher than 85 for at least 3 seconds. 5 dump files will be captured and saved into c:\procdumps directory. procdump.exe -accepteula -c 85 -s 3 -n 5 WaWorkerHost.exe c:\procdumps In the diagnostic setting page of Cloud Service, we could also set the crash dump file auto-generation. For more details of this part, please refer to this document.4.3KViews1like0CommentsIntermittently Succeed to RDP to the Cloud Service (Extended Support)
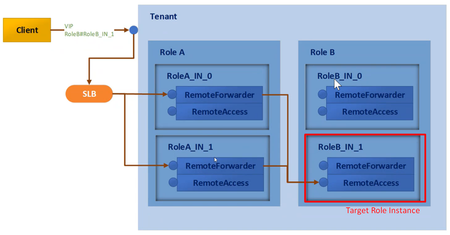
Symptom Users can only intermittently succeed to RDP to the Cloud Service (Extended Support). Users can RDP to the Cloud Service (Extended Support) after different times attempts and the RDP connection is stable once it is built. In the following, I will use "CSES" instead of "Cloud Service (Extended Support)". Cause The following picture explains the whole workflow of the RDP request. “SLB” means Load Balancer. “RoleA” and “RoleB” are the role kinds like “WebRole” and “WorkerRole”. “Tenant” means the whole CSES deployment. If the user targets RDP to “RoleB_IN_1”, the Load Balancer may decide to firstly send the request to the “RoleA_IN_0”. For the next RDP attempt with the same target role instance, the Load Balancer may decide the “RoleA_IN_1” as the first jump. For the third RDP attempt, the Load Balancer may decide to send the RDP request to the target “RoleB_IN_1” directly without any jump instance. If users configure multiple NSG rules on the CSES and do not allow communication between the role instances, users may succeed in RDP to role instances if the Load Balancer sends the request directly to the target instance. But users may fail to RDP to the instance due to the NSG rules blocking it if the Load Balancer sends the request to another jump instance before forwarding this RDP request to the target role instance. Users cannot control how the RDP request is transferred by the Load Balancer so the RDP connection may be built successfully intermittently. Reference doc: Network security group - how it works | Microsoft Docs The following is a sample NSG that will lead to this issue. The no.300 rule opens port 3389 and port 20000 to users’ local IPs but the no.400 rule does not allow internal discussion between different role instances. Solution If the CSES is protected by an NSG, in order to ensure that each RDP connection can be successfully established, users need to configure the NSG rules which not only allow the communication from local to role instances (no.300 rule below) but also allow communications between different role instances RDP ports (no.350 rule below).3KViews1like0Comments