automation
477 Topics
More security around using Custom Script Extensions and Session Host Configuration
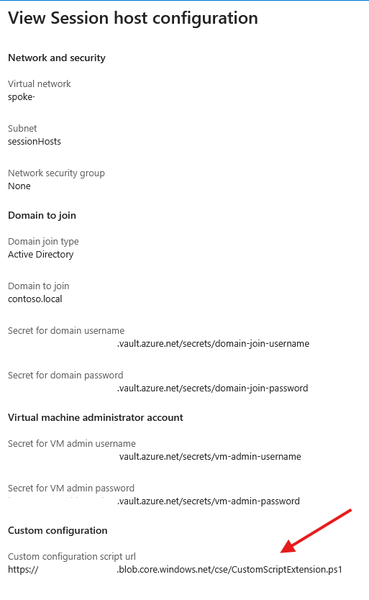
We are currently implementing and testing the new Session Host Configuration and Session Host Management features. We rely on Custom Script Extensions to implement some functionality immediately to the newly deployed Session Hosts instead of waiting for GPOs or other to take effect. We don't add these changes to the golden images. Currently the Custom Script Extensions functionality definable in the Session Host Configuration only allows to define a script URL. What is the intended mechanism of authentication for this solution? Currently it seems that its only possible to use an anonymous access level Blob. Defining a token within the script URL is not great due to the fact that the URL is viewable in plain text via the Azure Portal. Neither of those will satisfy. Key vault references are used when defining credentials for domain join and local admin accounts for the Session Hosts. Would it be possible to have key vault references for CSE Storage Account Name/Key or SAS token or the possibility to define a Managed Identity instead. These can be defined when deploying the CSEs manually. Please guide me as to what the best solution would be to this topic. Many thanks in advance.
Microsoft Defender XDR / Defender for Endpoint data connectors inconsistent failures
Hello, We are deploying our SOC (Sentinel) environments via Bicep. Now the Defender XDR ( MicrosoftThreatProtection) and Defender for Endpoint ( MicrosoftDefenderAdvancedThreatProtection) data connectors are failing to deploy inconsistantly. It seems to be a known issue due to the following posts: - https://github.com/Azure/SimuLand/issues/23 - https://techcommunity.microsoft.com/t5/microsoft-sentinel/quot-missing-consent-invalid-license-quot-defender-for-endpoint/m-p/3027212 - https://github.com/Azure/Azure-Sentinel/issues/5007 Next to this issue I see almost no development on the data connectors API, is there some news to be spread how to enable data connectors automated in the future, since it seems to be moving to Content Hub. It is hard to find any docs about how to deploy this for example via Bicep!? Also I have a question regarding 'Tenant-based Microsoft Defender for Cloud (Preview)' data connector. We deploy this now via GenericUI data connector kind, but this has no option to enable it via automation. Same as the question in the previous paragraph, how would this be made possible?1.2KViews0likes1CommentIntegrating ServiceNow with Azure DevOps: Use Cases That Actually Show Up in Practice
I have been working in the integration space for quite some time. Though I work as a Content Manager, I am always curious to see how users handle integrations between multiple systems. Usually, the service desk runs on ServiceNow, and the build happens in Azure DevOps. But these tools aren't inherently connected, and someone has to manually relay information between them. So, the records never show consistent data. You need a way for the data to pass automatically between them. Even within this setup, a lot of scenarios come forth: from a single ServiceNow instance connecting to a single Azure DevOps org, up to companies running six or seven orgs off a shared service layer. Here's the full range of use cases I keep seeing, organized by what they're actually solving. Native Tools vs. a Dedicated Integration Layer Before the use cases, it's worth being clear on when you need more than what's built in. ServiceNow's IntegrationHub can push data through flows, and there's a spoke for looking up and creating basic Azure DevOps work items. Azure DevOps also has a native extension for pipeline-to-change-management syncing. These native options work fine when the integration is simple: one team, clean field mappings, developers on hand to maintain it. They start to struggle once you're crossing org boundaries, crossing company lines, or dealing with fields and states that don't line up between the two systems. At that point, a dedicated integration layer that handles the mapping and keeps each side's access separate is usually the better fit. Core Sync Use Cases 1. Sync ServiceNow Requests to Azure DevOps User Stories Current setup: Support or service teams work in ServiceNow. When a request needs development, someone has to get it onto an Azure DevOps board as a User Story. Problem: A person creates the work item by hand, copies the request details, and checks back later for updates. When the work item closes, the ServiceNow request often doesn't reflect that, so the requester never hears back. The two records aren't linked. Solution: A trigger, filtered by assignment group, category, or a manual send action, creates the User Story automatically. The link between the two records gets stored on both sides. Updates to the work item flow back to the request, and closing one side closes the other. 2. Sync Comments and State Back to ServiceNow Current setup: ServiceNow holds the ticket the requester sees. Azure DevOps holds the actual dev work. Problem: When the work item moves in Azure DevOps, the ServiceNow ticket's state doesn't follow. Comments the dev team adds stay in Azure DevOps, so the service team keeps pinging developers for status. Solution: As the work item's state changes, it updates the linked ServiceNow ticket. Comments from the dev side sync back too. The service team sees progress without opening Azure DevOps or chasing anyone. 3. Sync ServiceNow Catalog Items to Azure DevOps Current setup: Users order catalog items in ServiceNow. Fulfilling some of them takes real development work tracked in Azure DevOps. Problem: The catalog task sits in ServiceNow while the work happens somewhere the requester can't see. Someone bridges the two manually, and the catalog item's status stops meaning anything. Solution: The catalog item creates a matching work item in Azure DevOps with the request details attached. As the dev team works, status and comments sync back, so the catalog task shows real progress and closes when the work item does. 4. Cut Duplication Between Incidents and User Stories Current setup: Incidents land in ServiceNow. Some get tracked as User Stories in Azure DevOps so the dev team can work them alongside the rest of the backlog. Problem: The same information gets documented twice, updated twice, and the two records drift apart over time. Solution: Incidents create linked User Stories automatically, with comments and status syncing both ways. Update one side and the other reflects it, so nobody's working the same incident twice without realizing it. 5. Sync Bugs with Attachments Across Multiple Orgs Current setup: Bugs get raised in ServiceNow, often by a separate first-line support team, while product teams work across several distinct Azure DevOps orgs. Problem: Recreating bugs by hand loses attachments and context, and there's no clean way to route each bug to the right org out of several. When a bug's fixed, ServiceNow doesn't hear about it. Solution: A bug creates a matching Bug work item in the correct Azure DevOps org, attachments included. Status and comments flow back to ServiceNow when it's resolved. Each connection runs independently, so the first-line team stays in ServiceNow without needing access to the other side. 6. Project-to-Hypercare Handover Current setup: During a build, everyone works in Azure DevOps. Once it goes live and moves into maintenance, incidents and requests need to land in ServiceNow, sometimes a brand-new instance. Problem: Teams used to living in Azure DevOps now need a maintenance process in ServiceNow, with no link back to the developers who built the thing. Solution: Incidents raised during hypercare reach the dev team in Azure DevOps, and fixes flow back to ServiceNow. Because the connection is independent of either team's existing workflow, you can add it without disrupting how people already work. 7. Bidirectional Field and Lifecycle Sync Current setup: A demand owner in ServiceNow needs to track a Feature as it moves through scoping, active work, testing, and deployment in Azure DevOps. Problem: If effort, status, and assignment only live in Azure DevOps, the ServiceNow record goes stale. Fields on each side use different names and values, so a raw pass-through just creates mismatches. Solution: Key fields sync in both directions with explicit mappings. From Azure DevOps: iteration path, change reference, estimated effort, assignment, and lifecycle status. From ServiceNow: design documents, portfolio area, demand type, and requirement details. As the Feature moves through its stages, the ServiceNow record updates in real time. 8. Multiple Azure DevOps Orgs to a Central ServiceNow Instance Current setup: Each business unit runs its own Azure DevOps org, often from an acquisition or separate supplier setup. A central ServiceNow layer needs visibility across all of them without forcing a shared workflow. Problem: Without a sync, someone manually pulls data between systems and chases updates. It doesn't scale as orgs get added. Solution: Each org gets its own connection, configured independently, feeding the central ServiceNow instance. Every org keeps its own states and fields while leadership gets a single view across all of them. 9. Selective Field Sharing Between Separately Hosted Environments Current setup: One side runs cloud-hosted, the other on-prem or in a regulated environment, and neither can open full network-level access to the other. Problem: A basic integration either oversprays fields it shouldn't, or requires a network connection security won't approve. Each side wants control over exactly what leaves its environment. Solution: Outgoing and incoming rules configured independently on each side let each admin decide what leaves and what gets accepted. The two environments sync over a secured channel without either side getting direct access to the other's system. 10. Handling Closed and Read-Only Tickets Cleanly Current setup: ServiceNow access controls block updates to closed incidents. Your sync runs across tickets through their full lifecycle, including closure. Problem: A basic sync throws errors every time it tries to write to something already closed. Solution: Filter closed tickets out of the sync entirely so they never trigger a write, or let the errors surface where your team can see and review them. Which approach you pick is a team decision, not a technical constraint. 11. MSP Routing by Assignment Group Current setup: An MSP runs ServiceNow as its operational layer. Clients work in their own delivery tools, some in Azure DevOps, some elsewhere. Manual handoffs work for a couple of clients and fall apart past a handful. Problem: An engineer resolves an incident and forgets to update the client's system. A comment added on one side never reaches the other. Status shows "in progress" on one side long after it's resolved on the other. As client count grows, the gap between what your team knows and what clients see widens. Solution: An automated rule sends each incident to the right client system based on the ServiceNow assignment group. Set a filter (for example, database issues route to one client's system, network issues to another), and connections run independently with no crossover between clients. The original incident reference gets written into the client ticket, and status values map across cleanly. A couple of related patterns worth knowing: Internal notes can be filtered separately from customer-facing updates, so only what the client should see crosses over. A new client typically reuses your existing ServiceNow authentication, so onboarding is closer to registering their system and setting a routing rule than rebuilding the integration from scratch. 12. Conditional Escalation from Multiple ServiceNow Instances Current setup: Several ServiceNow instances feed a single Azure DevOps org. Only tickets that genuinely need developer attention should reach the board. Problem: Escalating everything floods the board with tickets the dev team shouldn't be handling. Solution: A conditional trigger escalates only tickets meeting a specific condition, so agents push what actually qualifies and everything else stays put. Multiple instances can each feed the same Azure DevOps org under their own trigger logic. 13. Demand Management to Feature Delivery Current setup: A demand process runs in ServiceNow end to end: submission, review, approval, and an approved Requirement. The build happens in Azure DevOps as a Feature, through scoping, active work, testing, deployment, and closure. Problem: Once a Requirement's approved, there's no automatic handoff. Someone recreates the Feature by hand and keeps both sides updated manually. The demand owner can't see effort, status, or assignment as work progresses, so the Requirement goes stale. When the Feature closes in Azure DevOps, the Requirement stays open until someone remembers to close it. Solution: A bidirectional sync connects the full flow. Feature creation: A Requirement creates a Feature automatically, carrying demand context (design sign-off, demand reference, portfolio area, stakeholders, description) so developers get what they need without opening ServiceNow. Field sync: Updates flow both ways, each field mapped to a specific direction. Azure DevOps to ServiceNow: iteration path, change reference, effort, priority, assignment, lifecycle state. ServiceNow to Azure DevOps: the demand and design fields above. Lifecycle feedback: As the Feature moves through its stages, effort, status, and assignment feed back into the Requirement in real time. Closure: When the Feature closes, the linked Requirement closes with it, and the demand gets marked fulfilled. ServiceNow stays the system of record for demand, Azure DevOps for execution, and each side keeps authority over what it owns. What Actually Makes These Work A few capabilities show up across almost every use case above: Attachment sync. Bugs and incidents depend on screenshots and logs. If attachments don't carry over, developers end up back on email. Custom field mappings. Out-of-the-box mappings only go so far. Real setups need custom fields like portfolio area or demand type mapped explicitly, with values transformed, not just copied. State mappings. ServiceNow states and Azure DevOps states don't share vocabulary. Map them explicitly, and decide upfront which side is authoritative when a state changes after creation. Selective sync. Filter by assignment group, area path, work item type, or a custom field. Fewer records crossing means less to govern and less risk of leaking internal data across a boundary. Security and access. For most Azure DevOps admins, this comes down to what gets checked in a security review anyway: Entra ID or OAuth over shared credentials, role-based access, audit logging, and real isolation between connections when multiple clients or companies are involved. For a single team with clean, one-direction mappings, a native option usually covers it. Once you're crossing orgs, crossing companies, or running a full demand-to-delivery flow with real field transformations, that's when a dedicated integration layer kind of becomes necessary. Let's discuss whether any of these match what you're dealing with, or if you've hit an edge case that isn't on this list.332Views1like2CommentsDeploying hosted agents in Foundry Agent Service via Terraform
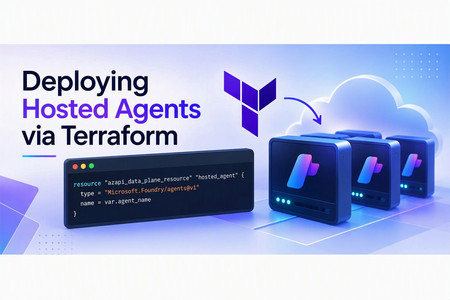
Background Your Terraform workflow already manages your Azure infrastructure but deploying hosted agents still requires manual SDK calls or REST API scripts. This post shows you how to bring agent deployments into your existing IaC pipeline using the AzAPI provider, so your entire Foundry stack can be versioned, reviewed, and deployed together. For this post we will focus on leveraging Foundry Hosted Agents. At a high level hosted agents will abstract the overhead of managing your agents compute. Conceptually, think of taking the compute today, that might be in Azure Container Apps (ACA) or Azure Functions and moving it into Foundry. For more information can check out my previous blog on this topic. In this example Foundry runs the agent code on managed compute from a container image. For this specific example we need to use Azure Container Registry to house our code artifact. If wanting to deploy directly from source refer to my previous blog Deploying Foundry Hosted Agents from Source Why an Infrastructure as Code Approach? Hosted agents today in Foundry support SDK and REST API deployments, why should we look at leveraging an IaC provider to handle our agents today? Many organizations subscribe to an IaC strategy for managing their Azure Resources. A hosted agent, at its core, is configuring and allocating infrastructure resources behind Foundry. This would be similar to how we configure plan sizes for products like App Services. Additionally, anything defined by IaC makes it easier to version the configuration in source control and incorporate it into repeatable CI/CD pipelines. Production workflows should also account for remote state, approval controls, and image-version promotion. Another added benefit for anything under IaC is the ability to apply custom policies, Azure or otherwise, over the codebase. Prerequisites An Azure subscription with permission to create resources and role assignments. Access to a region and model deployment with sufficient quota for Foundry Hosted Agents. Azure CLI, Terraform, Git, and Docker installed. Docker must support building linux/amd64 images. Permission to push images to Azure Container Registry and create agents in the Foundry project. The provided sample creates or configures the supporting Azure Container Registry, Foundry account and project, model deployment, managed identity, project connection, and hosted-agent deployment. Hosted agents require a Linux AMD64 (linux/amd64) container image. When building from an ARM-based workstation, including Apple Silicon, explicitly target linux/amd64 and ensure Docker cross-platform emulation is available. See Microsoft’s hosted-agent container requirements. docker build --platform linux/amd64 -t <registry-name>.azurecr.io/<image-name>:<tag> To get started quickly I have a repository w/ all the prerequisites and reviewed code at simple-hosted-agent-deploy-azapi Deploy the Sample To deploy the sample: Clone the repository and reopen it in the included development container. Authenticate to Azure and select the target subscription. Copy and update the example Terraform variable files with your environment-specific values. Run the included deployment script to provision the base resources, build and push the container image, and create the hosted agent. Confirm that the generated agent version reaches an active state before invoking it. Refer to the repository README for the current commands, configuration values, and cleanup steps. Process Overview Let’s level set on what our end-to-end process may look like. In many large organizations, the agent deployment process could be decoupled from the Foundry base architecture. Components such as the Foundry account, project, connections, and model may be controlled by a centralized team. These shared components often follow a different deployment lifecycle from an individual agent. A development team may own the code. We need the code to deploy the hosted agent. Quite the chicken-and-egg problem. So let’s break it down from a day 1 perspective: Deploy Foundry Base Architecture Foundry Account Foundry Project Model Project Connection Application Insights Build and Push code to Azure Container Registry Deploy the hosted agent pointed to the image defined in Azure Container Registry For this example, I assume that Azure Container Registry is managed outside the Foundry lifecycle because many organizations prefer to consolidate container images into a smaller number of shared registries. For illustration purposes, the provided example includes the registry deployment. Day n perspective would potentially look like: Build and Push code to Azure Container Registry Deploy the hosted agent pointed to the image defined in Azure Container Registry Updating the hosted-agent configuration creates a new agent version under the existing logical agent. Foundry manages the version history, while Terraform manages the logical agent configuration represented by the azapi_data_plane_resource. After each deployment, confirm that the new version reaches an active state before directing workloads to it. Technical Details At this time, let’s take a minute and discuss some of the technical details around how the hosted agent is created in Foundry. The Foundry project and its connections are Azure Resource Manager control-plane resources. The logical agent is created through the Foundry project’s data-plane API, while Foundry manages the supporting deployment resources required to host it. This is in contrast to services represented directly as Azure Resource Manager resources, such as App Service (Microsoft.Web/sites) and Azure Container Apps (Microsoft.App/containerApps). Here is a visual that depicts the data plane vs control plane objects: The Foundry project is the agent’s logical parent and provides the data-plane endpoint through which the agent is created. The project itself is deployed as the Azure Resource Manager resource Microsoft.CognitiveServices/accounts/projects Foundry connections can be deployed as Microsoft.CognitiveServices/accounts/projects/connections. In this case, the connection is used for connecting and authenticating to Azure Container Registry. At this point, the project and connection resources can be deployed through AzAPI or Bicep. The next step requires a data-plane call. For Terraform deployments, this operation can be managed declaratively with the AzAPI provider’s azapi_data_plane_resource. Foundry also supports agent deployment through its SDKs and REST API. azapi_data_plane_resource The AzAPI provider’s azapi_data_plane_resource resource is the key component for deploying a hosted agent in Foundry Agent Service through Terraform. Per official MS Learn documentation: Some Azure services expose a separate data plane API—a service-specific HTTPS endpoint where you interact directly with the service rather than through ARM. Examples include the Key Vault secrets API at {vaultName}.vault.azure.net, the Azure AI Search index API at {searchServiceName}.search.windows.net, and the Synapse workspace pipeline API at {workspaceName}.dev.azuresynapse.net. azapi_data_plane_resource bridges this gap by enabling Terraform to manage resources on these data plane endpoints using the same AzAPI provider authentication and lifecycle model. https://learn.microsoft.com/en-us/azure/developer/terraform/concept-azapi-data-plane-framework So how would a terraform implementation for this work? First let’s create the appropriate resource type, name and parent reference, in this case the Foundry Project: resource "azapi_data_plane_resource" "hosted_agent" { type = "Microsoft.Foundry/agents@v1" name = var.agent_name # AzAPI data-plane parents use the endpoint host/path without a URI scheme. parent_id = trimprefix(var.project_endpoint, "https://") …} Now we need to pass in the dedicated parameters as part of the body. To find these parameters refer to the Foundry REST API documentation. body = { name = var.agent_name definition = { kind = "hosted" container_configuration = { image = var.image_uri } cpu = var.cpu memory = var.memory protocol_versions = [ { # The hosted container must implement this Foundry Responses contract. protocol = "responses" version = "2.0.0" } ] environment_variables = merge(var.environment_variables, { AZURE_AI_MODEL_DEPLOYMENT_NAME = var.model_deployment_name }) rai_config = { # Hosted agents require the full policy ARM ID; model deployments use its name. rai_policy_name = var.rai_policy_id } } } For the entire reusable module check out https://github.com/JFolberth/simple-hosted-agent-deploy-azapi/tree/main/simple_agent/azure/infra/modules/hosted_agent Conclusion Hosted Agents in Foundry Agent Service provides a way to run custom agent code on Foundry-managed compute while reducing the operational overhead of managing the underlying hosting infrastructure. By using the AzAPI provider’s azapi_data_plane_resource, teams can incorporate the logical agent deployment into an existing Terraform workflow alongside the Foundry project, model, connections, identity, and container registry resources it depends on. This approach is especially useful when platform and application responsibilities are separated. A platform team can manage the shared Foundry and Azure infrastructure, while application teams independently build, publish, and deploy new versions of their agent container. With the appropriate remote state, access controls, image-versioning strategy, and deployment validation in place, the same pattern can be extended into a repeatable CI/CD workflow for both initial deployment and ongoing agent updates. The linked sample demonstrates this end-to-end pattern, from provisioning the supporting Azure resources and publishing the container image through creating the hosted agent with Terraform. Use it as a starting point, then adapt its state management, access controls, artifact promotion, and validation steps to meet your organization’s production requirements.566Views0likes0Comments
Automating Azure SQL DB index and statistics maintenance using Elastic Jobs.
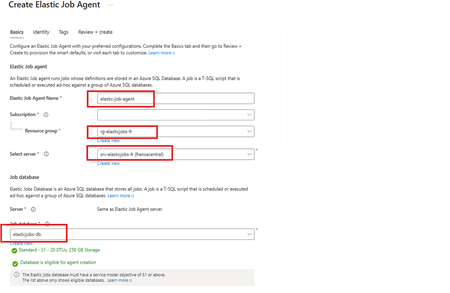
Using as a reference of this article. Automating Azure SQL DB index and statistics maintenance using Azure Automation | Microsoft Community Hub To provide complete solution to maintain you Azure SQL DB statistics and maintenance we provide our maintenance script here What's an elastic job? Create and schedule elastic jobs that periodically run against one or many Azure SQL databases. The jobs run Transact-SQL (T-SQL) queries and perform maintenance tasks. What's required? Create an empty Azure SQL Database with the S1 tier or higher. The Elastic Job Agent will use this database to store job information, job definitions, and other related data. The database must be created on the same Azure SQL Server as the Elastic Job Agent. During the Elastic Job Agent setup, this database is used as the job database. Microsoft Entra authentication with a user-assigned managed identity (UMI) (recommended). The elastic job must be able to log in to each target server or database. Create an elastic job agent. It’s a managed service that lets you run and schedule jobs across Azure SQL databases. Creating the Azure SQL database and UMI should be fairly straightforward, but I’ve included the code below in case you’d like to follow along. # This is sample code, so feel free to replace the names and location with the values that suit your environment. # Resource Group New-AzResourceGroup -Name "rg-elasticjobs-fr" -Location "FranceCentral" # Azure SQL Database - Elastic Jobs New-AzSqlServer -ResourceGroupName "rg-elasticjobs-fr" -ServerName "srv-elasticjobs-fr" -Location "FranceCentral" -ExternalAdminName "XXXXXXXXX@msft.com" -EnableActiveDirectoryOnlyAuthentication New-AzSqlDatabase -ResourceGroupName "rg-elasticjobs-fr" -ServerName "srv-elasticjobs-fr" -DatabaseName "elasticjobs-db" -Edition "Standard" -RequestedServiceObjectiveName "S1" # Azure SQL Database - Target New-AzSqlServer -ResourceGroupName "rg-elasticjobs-fr" -ServerName "srv-target-fr" -Location "FranceCentral" -ExternalAdminName "XXXXXXXXX@msft.com" -EnableActiveDirectoryOnlyAuthentication New-AzSqlDatabase -ResourceGroupName "rg-elasticjobs-fr" -ServerName "srv-target-fr" -DatabaseName "target-db" -Edition "Standard" -RequestedServiceObjectiveName "S0" -SampleName "AdventureWorksLT" # User Managed Identity New-AzUserAssignedIdentity -ResourceGroupName "rg-elasticjobs-fr" -Name "umi_fr_user" -Location "francecentral" In the search box at the top, type Elastic Job Agent, then select it and create a new Elastic Job Agent. On the identity tab, select the UMI and then click on Review + Create Now, let's create a target group (The set of servers, pools, and databases to run a job against.) and add targets for the jobs. Elastic Jobs Agent - Jobs - Target Groups - Create, once created, then click on the name, create again and add a Target Group Member. On each of the target databases, create the required objects for the maintenance script, create a contained user linked to the UMI, and grant the user the permissions needed to run the job scripts. Note: This is sample code. Please adjust the permissions based on your requirements and apply least privilege. Next, let’s schedule a job! For an Elastic Job that runs once every week, the ISO 8601 repeating interval is: P1W Add steps to each elastic job. A target group must be chosen for each job step. If you would like to see the current status of the jobs, head to Jobs, Job Executions. If further information is required, connect to the elasticjobs-db database and run the following query: SELECT TOP (10) * FROM jobs.job_executions WHERE lifecycle <> 'Succeeded' ORDER BY create_time DESC; References: Automation in Azure SQL overview - Azure SQL Database & Azure SQL Managed Instance & Azure Synapse Analytics | Microsoft Learn Elastic Jobs Overview - Azure SQL Database | Microsoft Learn Create, configure, and manage elastic jobs - Azure SQL Database | Microsoft Learn Disclaimer Please note that products and options presented in this article are subject to change. This article reflects for Azure SQL Database in September 2026. I hope this article was helpful for you, please feel free to share your feedback in the comments section.420Views1like1CommentMigrate Sentinel to Defender - Why It Is a Security Architecture Decision, Not Just a Portal Change
Microsoft will retire the Sentinel experience in Azure on March 31, 2027. Most of the conversation around this transition focuses on cost optimization and portal consolidation. That framing undersells what is actually happening. The unified Defender portal is not a new interface for the same capabilities. It is the platform foundation for a fundamentally different SOC operating model — one built on a 2-tier data architecture, graph-based investigation, and AI agents that can hunt, enrich, and respond at machine speed. Partners who understand this will help customers build security programs that match how attackers actually operate. This document covers four things: What the unified experience delivers — the security capabilities that do not exist in standalone Sentinel and why they matter against today’s threats. What the transition really involves - is not data migration, but it is a data architecture project that changes how telemetry flows, where it lives, and who queries it. Where the partner opportunity lives — a structured progression from professional services (transactional, transition execution, and advisory) to ongoing managed security services. Why does the unified experience win competitively — factual capability advantages that give partners a defensible position against third-party SIEM alternatives. The Bigger Picture: Preparing for the Agentic SOC Before getting into transition mechanics, partners need to understand where the industry is headed — because the platform decisions made during this transition will determine whether a customer’s SOC is ready for what comes next. The security industry is moving from human-driven, alert-centric workflows to an operating model built on three pillars: Intellectual Property — the detection logic, hunting hypotheses, response playbooks, and domain expertise that differentiate one security team from another. Human Orchestration — the judgment, context, and decision-making that humans bring to complex incidents. Humans set strategy, validate findings, and make containment decisions. They do not manually triage every alert. AI Agents - built agents that execute repeatable work: enriching incidents, hunting across months of telemetry, validating security posture, drafting response actions, and flagging anomalies for human review. The SOC of 2027 will not be scaled by hiring more analysts. It will be scaled by deploying agents that encode institutional knowledge into automated workflows — orchestrated by humans who focus on the decisions that require judgment. This transformation requires a platform that provides three things: Deep telemetry — agents need months of queryable data to analyze behavioral patterns, build baselines, and detect slow-moving threats. The Sentinel data lake provides this at a cost point that makes long-retention feasible. Relationship context — agents need to understand how entities connect. Which accounts share credentials? What is the blast radius of a compromised service principle? What is the attack path from a phished user to domain admin? Sentinel Graph provides this. Extensibility — partners and customers need to build and deploy their own agents without waiting for Microsoft to ship them. The MCP framework and Copilot agent architecture provide this. None of these exist in Azure experience for Sentinel. All three ship with the Defender experience. The urgency goes beyond the March 2027 deadline. Organizations are deploying AI agents, copilots, and autonomous workflows across their businesses — and every one of those creates a new attack surface. Prompt injection, data poisoning, agent hijacking, cross-plugin exploitation — these are not theoretical risks. They are in the wild today. Defending against AI-powered attacks requires a security platform that is itself AI Agent-ready. The new experience in Defender unlocks this experience. What Unified SIEM and XDR Actually Delivers The original framing — “single pane of glass for SIEM and XDR” — is accurate but insufficient. Here is what the unified platform delivers that standalone Sentinel does not. Cross-Domain Incident Correlation The Defender correlation engine does not just group alerts by time proximity. It builds multi-stage incident graphs that link identity compromise to lateral movement to data exfiltration across SIEM and XDR telemetry — automatically. Consider a token theft chain: an infostealer harvests browser session cookies (endpoint telemetry), the attacker replays the token from a foreign IP (Entra ID sign-in logs), creates a mailbox forwarding rule (Exchange audit logs), and begins exfiltrating data (DLP alerts). In standalone Sentinel, these are four separate alerts in four different tables. In the unified platform, they are one correlated incident with a visual attack timeline. 2-Tier Data Architecture The Sentinel data lake introduces a second storage tier that changes the economics and capabilities of security telemetry: Analytics Tier Data Lake Purpose Real-time detection rules, SOAR, alerting Hunting, forensics, behavioral analysis, AI agent queries Latency Sub-5-minute query and alerting Minutes to hours acceptable Cost ~$4.30/GB PAYG ingestion (~$2.96 at 100 GB/day commitment) ~$0.05/GB ingestion + $0.10/GB data processing (at least 20x cheaper) Retention 90 days default (expensive to extend) Up to 12 years at low cost Best for High-signal, low-volume sources High-volume, investigation-critical sources The architecture decision is not “which tier is cheaper.” It is “which tier gives me the right detection capability for each data source.” Analytics tier candidates: Entra ID sign-in logs, Azure activity, audit logs, EDR alerts, PAM events, Defender for Identity alerts, email threat detections. These need sub-5-minute alerting. Data lake candidates: Raw firewall session logs, full DNS query streams, proxy request logs, Sysmon process events, NSG flow logs. These drive hunting and forensic analysis over weeks or months. Dual-ingest sources: Some sources need both tiers. Entra ID sign-in logs are the canonical example — analytics tier for real-time password spray detection, Data Lake for graph-based blast radius analysis across months of authentication history. Implementation is straightforward: a single Data Collection Rule (DCR) transformation handles the split. One collection point, two routing destinations. The right framing: “Right data in the right tier = better detections AND lower cost.” Cost savings are a side effect of good security architecture, not the goal. Sentinel Graph Sentinel graph enables SOC teams and AI agents to answer questions that flat log queries cannot: What is the blast radius of this compromised account? Which service principals share credentials with the breached identity? What is the attack path from this phished user to domain admin? Which entities are connected to this suspicious IP across all telemetry sources? Graph-based investigation turns isolated alerts into context-rich intelligence. It is the difference between knowing “this account was compromised” and understanding “this account has access to 47 service principals, 3 of which have written access to production Key Vault.” Security Copilot Integration Security Copilot embedded in the defender portal helps analysts summarize incidents, generate hunting queries, explain attacker behavior, and draft response actions. For complex multi-stage incidents, it reduces the time from “I see an alert” to “I understand the full scope” from hours to minutes. With free SCUs available with Microsoft 365 E5, teams can apply AI to the highest-effort investigation work without adding incremental cost. MCP and the Agent Framework The Model Context Protocol (MCP) and Copilot agent architecture let partners and customers build purpose-built security agents. A concrete example: an MCP-enabled agent can automatically enrich a phishing incident by querying email metadata, checking the sender against threat intelligence, pulling the user’s recent sign-in patterns, correlating with Sentinel Graph for lateral risk, and drafting a containment recommendation — in under 60 seconds. This is where partner intellectual property becomes competitive advantage. The agent framework is the mechanism for encoding proprietary detection logic, response playbooks, and domain expertise into automated workflows that run at machine speed. Security Store Security Store allows partners to evolve from one‑time transition projects into repeatable, scalable offerings—supporting professional services, managed services, and agent‑based IP that align with the customer’s unified SecOps operating model As part of the transition, the Microsoft Security Store becomes the extension layer for the Defender —allowing partners to deliver differentiated agents, SaaS, and security services natively within Defender and Sentinel, instead of building and integrating in isolation The 4 Investigation Surfaces: A Customer Maturity Ladder The Sentinel Data Lake exposes four distinct investigation surfaces, each representing a step toward the Agentic SOC — and a partner service opportunity: Surface Capability Maturity Level Partner Opportunity KQL Query Ad-hoc hunting, forensic investigation Basic — “we can query” Hunting query libraries; KQL training Graph Analytics Blast radius, attack paths, entity relationships Intermediate — “we understand relationships” Graph investigation training; attack path workshops Notebooks (PySpark) Statistical analysis, behavioral baselines, ML models Advanced — “we predict behaviors” Custom notebook development; anomaly scoring Agent/MCP Access Autonomous hunting, triage, response at machine speed Agentic SOC — “we automate” Custom agent development; MCP integration The customer who starts with “help us hunt better” ends up at “build us agents that hunt autonomously.” That is the progression from professional services to managed services. What the Transition Actually Involves It is not a data migration — customers’ underlying log data and analytics remain in their existing Log Analytics workspaces. That is important for partners to communicate clearly. But partners should not set the expectation that nothing changes except the URL. Microsoft’s official transition guide documents significant operational changes — including automation rules and playbooks, analytics rule, RBAC restructuring to the new unified model (URBAC), API schema changes that break ServiceNow and Jira integrations, analytics rule transitions where the Fusion engine is replaced by the Defender XDR correlation engine, and data policy shifts for regulated industries. Most customers cannot navigate this complexity without professional help. Important: Transitioning to the Defender portal has no extra cost - estimate the billing with the new Sentinel Cost Estimator Optimizing the unified platform means making deliberate changes: Adding dual-ingest for critical sources that need both real-time detection and long-horizon hunting. Moving high-volume telemetry to the Data Lake — enabling hunting at scale that was previously cost-prohibitive. Retiring redundant data copies where Defender XDR already provides the investigation capability. Updating RBAC, automation, and integrations for the unified portal’s consolidated schema and permission structure. Training analysts on new investigation workflows, Sentinel Graph navigation, and Copilot-assisted triage. Threat Coverage: The Detection Gap Most Organizations Do Not Know They Have This transition is an opportunity to quantify detection maturity — and most organizations will not like what they find. Based on real-world breach analysis — infostealers, business email compromise, human-operated ransomware, cloud identity abuse, vulnerability exploitation, nation-state espionage, and other prevalent threat categories — organizations running standalone Sentinel with default configurations typically have significant detection gaps. Those gaps cluster in three areas: Cross-domain correlation gaps — attacks that span identity, endpoint, email, and cloud workloads. These require the Defender correlation engine because no single log source tells the complete story. Long-retention hunting gaps — threats like command-and-control beaconing and slow data exfiltration that unfold over weeks or months. Analytics-tier retention at 90 days is too expensive to extend and too short for historical pattern analysis. Graph-based analysis gaps — lateral movement, blast radius assessment, and attack path analysis that require understanding entity relationships rather than flat log queries. The unified platform with proper log source coverage across Microsoft-native sources can materially close these gaps — but only if the transition includes a detection coverage assessment, not just a portal cutover. Partners should use MITRE ATT&CK as the common framework for measuring detection maturity. Map existing detections to ATT&CK tactics and techniques before and after transition — a measurable, defensible improvement that justifies advisory fees and ongoing managed services. Partner Opportunity: Professional Services to Managed Services This transition creates a structured progression for all partner types — from professional services that build trust and surface findings, to managed security services that deliver ongoing value. The key insight most partners miss: do not jump from “transition assessment” to “managed services pitch.” Customers are not ready for that conversation until they have experienced the value of professional services. The bridge engagement — whether transactional, transition execution, or advisory — builds trust, demonstrates the expertise, and surfaces the findings that make the managed services conversation a logical next step. Professional Services (transactional + transition execution + advisory) → Managed Security Services (MSSP) The USX transition is the ideal professional services entry point because it combines a mandatory deadline (March 2027) with genuine technical complexity (analytics rule, automation behavioral changes, RBAC restructuring, API schema shifts) that most customers cannot navigate alone. Every engagement produces findings — detection gaps, automation fragility, staffing shortfalls — that are the most credible possible evidence for managed services. Professional Services Transactional Partners Offer Customer Value Key Deliverables Transition Readiness Assessment Risk-mitigated transition with clear scope Sentinel deployment inventory; Defender portal compatibility check; transition roadmap with timeline; MITRE ATT&CK detection coverage baseline Transition Execution and Enablement Accelerated time-to-value, minimal disruption Workspace onboarding; RBAC and automation updates; Dual-portal testing and validation; SOC team training on unified workflows Security Posture and Detection Optimization Better detections and lower cost Data ingestion and tiering strategy; Dual-ingest implementation for critical sources; Detection coverage gap analysis; Automation and Copilot/MCP recommendations Advisory Partners Offer Customer Value Key Deliverables Executive and Strategy Advisory Leadership alignment on why this transition matters Unified SecOps vision and business case; Zero Trust and SOC modernization alignment; Stakeholder alignment across security, IT, and leadership Architecture and Design Advisory Future-ready architecture optimized for the Agentic SOC Target-state 2-tier data architecture; Dual-ingest routing decisions mapped to MITRE tactics; RBAC, retention, and access model design Detection Coverage and Gap Analysis Measurable detection maturity improvement Current-state MITRE ATT&CK coverage mapping; Gap analysis against 24 threat patterns; Detection improvement roadmap with priority recommendations SOC Operating Model Advisory Smooth analyst adoption with clear ownership Redesigned SOC workflows for unified portal; Incident triage and investigation playbooks; RACI for detection engineering, hunting, and platform ops Agentic SOC Readiness Preparation for AI-driven security operations MCP and agent architecture assessment; Custom agent development roadmap; IP + Human Orchestration + Agent operating model design Cost, Licensing and Value Advisory Transparent cost impact with strong business case Current vs. future cost analysis; Data tiering optimization recommendations; TCO and ROI modeling for leadership The conversion to managed services is evidence-based. Every professional services engagement produces findings — detection gaps, automation fragility, staffing shortfalls. Those findings are the most credible possible case for ongoing managed services. Managed Security Services The unified platform changes the managed security conversation. Partners are no longer selling “we watch your alerts 24/7.” They are selling an operating model where proprietary AI agents handle the repeatable work — enrichment, hunting, posture validation, response drafting — and human experts focus on the decisions that require judgment. This is where the competitive moat forms. The formula: IP + Human Orchestration + AI Agents = differentiated managed security. The unified platform enables this through: Multi-tenancy — the built-in multitenant portal eliminates the need for third-party management layers. Sentinel Data Lake — agents can query months of customer telemetry for behavioral analysis without cost constraints. Sentinel Graph — agents can traverse entity relationships to assess blast radius and map attack paths. MCP extensibility — partners can build agents that integrate with proprietary tools and customer-specific systems. Partners who build proprietary agents encoding their detection logic into the MCP framework will differentiate from partners who rely on out-of-box capabilities. The Securing AI Opportunity Organizations are deploying AI agents, copilots, and autonomous workflows across their businesses at an accelerating pace. Every AI deployment creates a new attack surface — prompt injection, data poisoning, agent hijacking, cross-plugin exploitation, unauthorized data access through agentic workflows. These are not theoretical risks. They are in the wild today. Partners who can help customers secure their AI deployments while also using AI to strengthen their SOC will command premium positioning. This requires a security platform that is itself AI Agent-ready — one that can deploy defensive agents at the same pace organizations deploy business AI. The unified Defender portal is that platform. Partners who position USX as “preparing your SOC for AI-driven security operations” will differentiate from partners who position it as “moving to a new portal.” Cost and Operational Benefits Better security architecture also costs less. This is not a contradiction — it is the natural result of putting the right data in the right tier. Benefit How It Works Eliminate low-value ingestion Identify and remove log sources that are never used for detections, investigations, or hunting. Immediately lowers analytics-tier costs without impacting security outcomes. Right-size analytics rules Disable unused rules, consolidate overlapping detections, and remove automation that does not reduce SOC effort. Pay only for processing that delivers measurable security value. Avoid SIEM/XDR duplication Many threats can be investigated directly in Defender XDR without duplicating telemetry into Sentinel. Stop re-ingesting data that Defender already provides. Tier data by detection need Store high-volume, hunt-oriented telemetry in the Data Lake at at least 20x lower cost. Promote only high-signal sources to the analytics tier. Full data fidelity preserved in both tiers. Reduce operational overhead Unified SIEM+XDR workflows in a single portal reduce tool switching, accelerate investigations, simplify analyst onboarding, and enable SOC teams to scale without proportional headcount increases. Improve detection quality The Defender correlation engine produces higher-fidelity incidents with fewer false positives. SOC teams spend less time triaging noise and more time on real threats. Competitive Positioning Partners need defensible talking points when customers evaluate third-party SIEM alternatives. The following advantages are factual, sourced from Microsoft’s transition documentation and platform capabilities — not marketing claims. No extra cost for transitioning — even for non-E5 customers. Third-party SIEM migrations involve licensing, data migration, detection rewrite, and integration rebuild costs. Native cross-domain correlation across Sentinel + Defender products into multi-stage incident graphs. Third-party SIEMs receive Microsoft logs as flat events — they lack the internal signal context, entity resolution, and product-specific intelligence that powers cross-domain correlation. Custom detections across SIEM + XDR — query both Sentinel and Defender XDR tables without ingesting Defender data into Sentinel. Eliminates redundant ingestion cost. Alert tuning extends to Sentinel — previously Defender-only capability, now applicable to Sentinel analytics rules. Net-new noise reduction. Unified entity pages — consolidated user, device, and IP address pages with data from both Sentinel and Defender XDR, plus global search across SIEM and XDR. Third-party SIEMs provide entity views from ingested data only. Built-in multi-tenancy for MSSPs — multitenant portal manages incidents, alerts, and hunting across tenants without third-party management layers. Try out the new GDAP capabilities in Defender portal. Industry validation: Microsoft’s SIEM+XDR platform has been recognized as a Leader by both Forrester (Security Analytics Platforms, 2025) and Gartner (SIEM Magic Quadrant, 2025). Summary: What Partners Should Take Away Topic Key Message Framing USX is a security architecture transformation, not a portal transition. Lead with detection capability, not cost savings. Platform foundation Sentinel Data Lake + Sentinel Graph + MCP/Agent Framework = the platform for the Agentic SOC. 4 investigation surfaces KQL → Graph → Notebooks → Agent/MCP. A maturity ladder from “we can query” to “we automate at machine speed.” Architecture 2-tier data model (analytics + Data Lake) with dual-ingest for critical sources. Cost savings are a side effect of good architecture. Transition complexity Analytics rules and automation rules. API schema changes. RBAC restructuring. Most customers need professional help. Partner engagement model Professional Services (transactional + transition execution + advisory) → Managed Services (MSSP). Competitive positioning No extra cost. Native correlation. Cross-domain detections. Built-in multi-tenancy. Capabilities third-party SIEMs cannot replicate. Partner differentiation IP + Human Orchestration + AI Agents. Partners who build proprietary agents on MCP have competitive advantage. Timeline March 31, 2027. Start now — phased transition with one telemetry domain first, then scale.3.6KViews5likes5Comments
The Hidden Reason Your Sentinel Playbook Won't Show Up in Automation Rules (It's Not RBAC)
If a Logic App using the native Microsoft Sentinel incident trigger doesn't show up in the "Run playbook" picker of an Automation Rule — even though permissions, region, and connection are all correct — check the internal action name of the trigger in the JSON code view. If the Logic App was created while the Azure portal was set to a non-English language, the designer may generate a localized action name instead of the expected Microsoft_Sentinel_incident, and the playbook won't be picked up. Environment Microsoft Sentinel (Log Analytics workspace) Logic Apps (Consumption plan) Trigger: native Microsoft Sentinel connector, "Incident" trigger (/incident-creation path) Authentication: system-assigned Managed Identity Same subscription, resource group, and region as the Sentinel workspace Problem Two Logic Apps, both triggered by the native Microsoft Sentinel incident trigger, both using a system-assigned managed identity with the Microsoft Sentinel Responder role granted on the workspace. Same subscription, same resource group, same region. Only one of the two appeared in the "Run playbook" dropdown when configuring an Automation Rule in Sentinel. The other was simply absent — no error message, no warning, nothing in the run history to explain it. Investigation The usual suspects were checked and ruled out one by one: API connection health — one azuresentinel connection was indeed in an "Error" state, but it turned out not to be the one referenced by the affected trigger. Managed identity RBAC — the Microsoft Sentinel Responder role was correctly assigned to the Logic App's managed identity on the Sentinel workspace. User's own RBAC/PIM role — the Logic App Contributor role (required for the account configuring the Automation Rule to even see the resource) was active via PIM at the time of testing. Region/subscription/resource group — identical for both Logic Apps. Trigger type — both used the native "Incident in Microsoft Sentinel" trigger added through the visual designer, not a generic HTTP trigger or a deprecated connector. Every documented requirement was met. The playbook was still invisible. Root Cause Comparing the raw JSON (Logic app > Development tools > Code view) revealed the actual difference. Working Logic App (visible in the picker): "triggers": { "Microsoft_Sentinel_incident": { "type": "ApiConnectionWebhook", "inputs": { "body": { "callback_url": "@{listCallbackUrl()}" }, "path": "/incident-creation" } } } Broken Logic App (invisible in the picker): "triggers": { "Incident_dans_Microsoft_Sentinel": { "type": "ApiConnectionWebhook", "inputs": { "body": { "callback_url": "@listCallbackUrl()" }, "path": "/incident-creation" } } } The connector type and the path (/incident-creation) are identical. The one meaningful structural difference is the trigger's action name: Microsoft_Sentinel_incident versus Incident_dans_Microsoft_Sentinel. The second Logic App's trigger had been added while the Azure portal was set to French. The designer generated a localized action name instead of the canonical English one. Everything points to Sentinel's playbook discovery mechanism scanning Logic App definitions for that exact canonical action name (Microsoft_Sentinel_incident) to identify a resource as a valid Sentinel playbook — rather than relying solely on the connector type or the webhook path, as one would reasonably expect. Fix Renaming the trigger's action key in the JSON to the canonical name was enough: "triggers": { "Microsoft_Sentinel_incident": { ... } } No permission, connection, or region change was required — only this rename. Takeaways The Sentinel Automation Rule playbook picker appears to depend on the exact trigger action name, not just its type or functional behavior — a dependency that isn't documented anywhere in the official Microsoft docs as of this writing. The Azure portal's display language at the time a trigger is added has a direct impact on that Logic App's compatibility with Sentinel Automation Rules. A playbook can be fully functional (running without errors when triggered manually or through an older automation mechanism) while still being invisible in the newer Automation Rule selector — which makes this particular issue easy to miss, since nothing explicitly flags it. Recommendations Temporarily switch the Azure portal to English (Portal settings > Language and region) before adding a Sentinel trigger to a Logic App, if your team usually works in another language. If an existing Logic App won't show up despite an otherwise correct configuration, check the trigger's action name in the JSON code view first — it's a 30-second check that can save hours of RBAC/connection troubleshooting. Document this in your internal runbooks if your team works in a localized portal — this kind of detail is easy to lose and can cost significant troubleshooting time down the line. Has anyone else run into similar localization-related quirks in Sentinel or Logic Apps? Would be curious to hear about other cases in the comments.230Views0likes0CommentsThe Hidden Reason Your Sentinel Playbook Won't Show Up in Automation Rules (It's Not RBAC)
If a Logic App using the native Microsoft Sentinel incident trigger doesn't show up in the "Run playbook" picker of an Automation Rule — even though permissions, region, and connection are all correct — check the internal action name of the trigger in the JSON code view. If the Logic App was created while the Azure portal was set to a non-English language, the designer may generate a localized action name instead of the expected Microsoft_Sentinel_incident, and the playbook won't be picked up. Environment Microsoft Sentinel (Log Analytics workspace) Logic Apps (Consumption plan) Trigger: native Microsoft Sentinel connector, "Incident" trigger (/incident-creation path) Authentication: system-assigned Managed Identity Same subscription, resource group, and region as the Sentinel workspace Problem Two Logic Apps, both triggered by the native Microsoft Sentinel incident trigger, both using a system-assigned managed identity with the Microsoft Sentinel Responder role granted on the workspace. Same subscription, same resource group, same region. Only one of the two appeared in the "Run playbook" dropdown when configuring an Automation Rule in Sentinel. The other was simply absent — no error message, no warning, nothing in the run history to explain it. Investigation The usual suspects were checked and ruled out one by one: API connection health — one azuresentinel connection was indeed in an "Error" state, but it turned out not to be the one referenced by the affected trigger. Managed identity RBAC — the Microsoft Sentinel Responder role was correctly assigned to the Logic App's managed identity on the Sentinel workspace. User's own RBAC/PIM role — the Logic App Contributor role (required for the account configuring the Automation Rule to even see the resource) was active via PIM at the time of testing. Region/subscription/resource group — identical for both Logic Apps. Trigger type — both used the native "Incident in Microsoft Sentinel" trigger added through the visual designer, not a generic HTTP trigger or a deprecated connector. Every documented requirement was met. The playbook was still invisible. Root Cause Comparing the raw JSON (Logic app > Development tools > Code view) revealed the actual difference. Working Logic App (visible in the picker): "triggers": { "Microsoft_Sentinel_incident": { "type": "ApiConnectionWebhook", "inputs": { "body": { "callback_url": "@{listCallbackUrl()}" }, "path": "/incident-creation" } } } Broken Logic App (invisible in the picker): "triggers": { "Incident_dans_Microsoft_Sentinel": { "type": "ApiConnectionWebhook", "inputs": { "body": { "callback_url": "@listCallbackUrl()" }, "path": "/incident-creation" } } } The connector type and the path (/incident-creation) are235Views0likes0CommentsPower Automate - don't trust the green tick too much
There isn't actually any HTML tag in the text you pasted. The issue is most likely caused by special characters or formatting that Microsoft Tech Community's editor is interpreting incorrectly. The most suspicious part is: Request submitted -> SharePoint item created -> Approval sent -> Status updated -> Notification sent. If you're copying this from another editor, hidden formatting characters can sometimes get carried over. Also, Markdown formatting such as: Succeeded What happened? Input validation may not always paste cleanly depending on where you're posting it. For Microsoft Tech Community, I'd use a plain-text version with simple formatting: A green tick in Power Automate doesn't always mean the process succeeded. This is something I understood better after working with business-critical flows. Imagine a flow like this: Request submitted → SharePoint item created → Approval sent → Status updated → Notification sent. The flow run shows "Succeeded". Looks good. But what if the notification didn't reach the user? Or the approval is still pending after three days? Or the flow was triggered twice and created duplicate records? Or the process stopped after updating the status but before completing the next business step? From Power Automate's point of view, individual actions may have completed successfully. But from the business user's point of view, the process may still be stuck. That's where I think automation design becomes more important than simply knowing which connector or action to use. For important processes, I usually think about: Input validation • Duplicate handling • Timeout scenarios • Error handling • Retry • Logging • Notifications • Recovery • Monitoring Especially with flows running hundreds or thousands of transactions, you can't depend on someone opening the run history every time something goes wrong. The flow should give you enough information to answer: What happened? Where did it fail? Which transaction was affected? Can we safely run it again? For me, that's the difference between a flow that simply works and an automation that can actually be supported in production. What is one Power Automate issue you've faced where the run showed "Succeeded", but the business process wasn't actually completed?129Views0likes0Comments