async_network_io
1 TopicAzure SQL Performance Troubleshooting: When High Latency Is Not High CPU
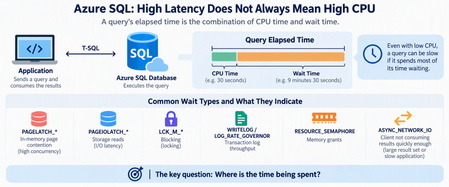
When an application connected to Azure SQL Database becomes slow or starts timing out, one of the first questions is usually: Is the database running out of CPU? It's a reasonable starting point, but CPU is only one part of the performance story. Some Azure SQL performance problems occur while CPU, Data IO, and worker utilization appear healthy. The database may have plenty of compute capacity while queries spend most of their time waiting rather than executing. The key troubleshooting question is therefore not simply: "How much CPU is Azure SQL using?" Instead, ask: "Where is the elapsed time being spent?" Start With Resources, But Don't Stop There Resource utilization should still be the first checkpoint. A simple query using sys.dm_db_resource_stats can help identify whether Azure SQL is approaching CPU, Data IO, Log IO, memory, or worker limits: SELECT DB_NAME() AS database_name, AVG(avg_cpu_percent) AS avg_cpu_percent, MAX(avg_cpu_percent) AS max_cpu_percent, MAX(avg_data_io_percent) AS max_data_io_percent, MAX(avg_log_write_percent) AS max_log_write_percent, MAX(avg_memory_usage_percent) AS max_memory_percent, MAX(max_worker_percent) AS max_worker_percent FROM sys.dm_db_resource_stats; If CPU is consistently near 100%, investigate CPU consumption. If Log IO reaches its limit, investigate transaction-log generation. If workers are exhausted, investigate concurrency. But if none of these resources is saturated, don't conclude that Azure SQL is healthy. Move to wait analysis. Follow the Waits A useful simplified model is: Query elapsed time = CPU execution If a query runs for 10 minutes but uses only 30 seconds of CPU, most of its elapsed time occurred somewhere else. Common wait patterns can point the investigation in different directions: Wait Area to investigate PAGELATCH_* In-memory page contention PAGEIOLATCH_* Storage reads LCK_M_* Blocking WRITELOG Transaction log LOG_RATE_GOVERNOR Log throughput RESOURCE_SEMAPHORE Memory grants ASYNC_NETWORK_IO Client/result consumption The wait type is not automatically the root cause. Think of it as a sign telling you: Look in this direction next. PAGELATCH Does Not Mean Slow Storage One important distinction is: PAGELATCH versus: PAGEIOLATCH Despite their similar names, they represent different problems. PAGEIOLATCH is associated with waiting for data pages involved in physical I/O. PAGELATCH, however, is synchronization around pages that are already in memory. Consider a highly concurrent workload: Hundreds of sessions ↓ Same memory page ↓ Latch contention ↓ Sessions wait ↓ Application CPU may still have available capacity. This is why increasing vCores doesn't necessarily eliminate latch contention. Additional compute provides more workload headroom, but it doesn't automatically remove a serialization point around a hot page. Microsoft's I/O troubleshooting guidance also distinguishes PAGEIOLATCH and other I/O-related waits when diagnosing storage-performance problems. Microsoft Learn: Troubleshoot SQL Server I/O performance Query Frequency Matters Too Another common mistake is focusing only on individually expensive queries. Imagine a query that takes only 20 milliseconds but executes hundreds of thousands of times, often concurrently. Its impact is better thought of as: Workload Impact = Cost per execution × Execution frequency × A small metadata lookup or initialization query can become significant when hundreds of application instances execute it simultaneously. This is where Query Store becomes particularly useful. Query Store preserves query, execution-plan, and runtime history, allowing you to compare executions, duration, CPU, plans, and other performance characteristics over time. Microsoft Learn: Monitor performance using Query Store Instead of asking only: "What's my most expensive query?" also ask: "What changed in the workload?" When Nine Hours of Duration Is Only One Minute of CPU Now consider the opposite problem. Suppose Query Store shows something like: Elapsed time 9 hours SQL CPU time 1 minute Returned rows 750,000+ Dominant wait ASYNC_NETWORK_IO Would adding CPU solve this? Probably not. CPU represents only a tiny fraction of the elapsed time. ASYNC_NETWORK_IO commonly occurs when SQL Server has results available but the client application is not consuming them quickly enough. Microsoft documents several possible causes, including: large result sets; slow application processing; applications fetching rows slowly; network-related delays. Microsoft Learn: Troubleshoot ASYNC_NETWORK_IO Importantly: ASYNC_NETWORK_IO does not automatically mean the network is slow. The bottleneck might actually be the application. Measure Time to First Row A useful troubleshooting technique is to separate database response time from result-consumption time. Instead of measuring only: Query start → Application finished measure: T0 = Query submitted T1 = First row received T2 = Last row received T3 = Application processing completed You can then separate: Database response = T1 - T0 Result consumption = T2 - T1 Application For example: First row received: 2 seconds Last row received: 2 hours Processing completed: 2.5 hours Calling this a "2.5-hour SQL query" would be misleading. SQL started returning results after two seconds. Most of the time was spent transferring or processing them. Don't Forget Blocking Low CPU can also be caused by blocking. If many sessions are waiting behind a transaction, increasing CPU isn't going to solve the problem. During an active incident, check requests and their waits: SELECT r.session_id, r.blocking_session_id, r.status, r.wait_type, r.wait_time, r.wait_resource, r.cpu_time, r.total_elapsed_time, st.text FROM sys.dm_exec_requests AS r CROSS APPLY sys.dm_exec_sql_text(r.sql_handle) AS st WHERE r.blocking_session_id <> 0 ORDER BY r.wait_time DESC; This helps determine whether the application is experiencing a resource problem or simply waiting behind another transaction. Why Scaling Can Be Misleading Imagine this sequence: Application slow ↓ Scale database ↓ Performance improves It's tempting to conclude: "We needed more CPU." But scaling can change more than CPU availability. Depending on the operation and environment, it can alter resource availability or execution conditions. Therefore: A successful mitigation does not automatically prove the root cause. Always distinguish between: What made the symptoms disappear? and: What originally caused the symptoms? A Practical Troubleshooting Workflow When investigating Azure SQL performance, I use the following approach: 1. Define the exact incident window Preferably using UTC timestamps. 2. Check core resources Look at: CPU Data IO Log IO memory workers 3. Compare CPU time with elapsed time If: Elapsed ≈ CPU investigate computational workload. If: Elapsed >>> CPU investigate waits. 4. Identify dominant waits Ask what prevented SQL from continuing execution. 5. Check blocking Determine whether requests are waiting behind other transactions. 6. Use Query Store Compare healthy and problematic periods for: execution count; CPU; duration; logical reads; plans; wait behavior. Microsoft provides Query Store examples specifically for workload and performance investigation. Microsoft Learn: Tune performance with Query Store 7. Inspect the execution plan Look for inefficient access patterns, cardinality problems, excessive reads, repeated lookups, spills, scans, or plan changes. 8. Investigate the application Especially when SQL CPU is low but result-transfer waits are high. Look at: rows returned; fetch size; batch size; application processing; concurrency; downstream dependencies. 9. Compare healthy vs unhealthy periods Don't analyze an incident in isolation. Ask: What changed? Common Misdiagnoses "CPU isn't 100%, so SQL is healthy." Not necessarily. Queries might simply be waiting. "ASYNC_NETWORK_IO means we have a network problem." Not necessarily. The client may be consuming results slowly. "PAGELATCH means storage is slow." No. Don't confuse PAGELATCH with PAGEIOLATCH. "Scaling fixed the problem, so CPU was the root cause." Not necessarily. Mitigation and root cause are different concepts. "The slowest query must be the problem." Not always. A small query executed extremely frequently can generate larger cumulative impact. Final Thought: Follow the Time When Azure SQL becomes slow, avoid jumping directly from: Slow database → Add more vCores Instead, work through: High latency ↓ Resource utilization ↓ CPU vs elapsed time ↓ Wait statistics ↓ Query Store ↓ Execution plan ↓ Application behavior ↓ Root cause ↓ Targeted optimization Performance troubleshooting becomes much easier once you stop asking only: "How busy is Azure SQL?" and start asking: "Where did the time go?" Because sometimes the database isn't busy at all. It's waiting. References Monitor Performance by Using the Query Store Tune performance with the Query Store Troubleshoot slow queries resulting from ASYNC_NETWORK_IO Troubleshoot slow SQL Server performance caused by I/O issues