apis
785 Topics
Building Microsoft Sentinel Connectors in Minutes with the Sentinel Connector Builder Agent
Overview We previously announced the public preview of the Microsoft Sentinel connector builder agent via VS code extension, that helps developers build Microsoft Sentinel codeless connectors faster with low-code and AI-assisted prompts. This post walks through a hands-on lab using a mock Network Log API to demonstrate how the Sentinel connector builder agent simplifies building Codeless Connector Framework (CCF) pull connectors. Instead of manually creating ingestion infrastructure and configuration files, you’ll use a guided, conversational workflow in VS Code to generate connector artifacts, test them against a live API, and deploy them into Microsoft Sentinel. The lab focuses on the end-to-end experience ranging from API setup to validated connector deployment so you can see how quickly a working integration can be produced. For additional guidance beyond this lab, refer to our MS Learn documentation. The Lab Environment This lab is built around a mock Network Log API hosted as an Azure Function App. The purpose of the lab environment is to give us a live API that we can use to build, validate, and test the Sentinel CCF connector builder agent against end to end. The API exposes 50 synthetic network activity records that look and behave like a real product data source, including web traffic, DNS requests, blocked remote access attempts, malware command-and-control blocks, VPN activity, and other common network events. That makes it a useful stand-in for the type of telemetry many teams want to onboard into Microsoft Sentinel. The API is intentionally shaped like the kind of source a customer might expose for telemetry retrieval. It uses API key authentication through the X-API-Key header, returns paginated results through a nextLink model, and provides a predictable response structure that the builder agent can map into a pull connector configuration. The repo contains everything needed for the walkthrough. There is an ARM template to deploy the Function App, reference documentation for the API, and a sample connector package showing the generated polling config, table schema, DCR, and connector definition. The end goal of the lab is straightforward: use the builder agent to generate a CCF pull connector that ingests this API into the custom NetworkLogAPIGetNetworkLogs_CL table in Sentinel. Prerequisites Before starting, make sure you have the following: Azure subscription -- with Contributor access on a resource group (for deploying the Function App) and Microsoft Sentinel Contributor access on a Sentinel-enabled workspace (for deploying the connector) Microsoft Sentinel workspace -- an existing Log Analytics workspace with Sentinel enabled. See Onboard Microsoft Sentinel to a Log Analytics workspace for more information. Azure CLI -- See How to install the Azure CLI for more information. VS Code with the Microsoft Sentinel for Visual Studio Code extension installed. GitHub Copilot -- with access to premium models. The connector builder agent requires Claude Sonnet 4.5 or 4.6, which uses Copilot premium model credits. Lab Repository -- Once the aforementioned prerequisites are met, you can access the lab repository here: Azure-Sentinel/Tools/CCF-Connector-Builder-Agent-Accelerator at master · Azure/Azure-Sentinel Deploying the Mock API The full CLI commands for this section are available in the repo. For a simpler option, you can use GitHub Copilot to handle the deployment. Enter this prompt: Follow the deployment instructions in Sentinel-CCF-Pull-Connector-Builder-Agent-Accelerator/agent-instructions.md. Let’s deploy the Network Log API and build a CCF pull connector. At a high level, the setup is four steps: clone the repo, create a resource group, ensure you have a Sentinel-enabled workspace, and deploy the Function App using the included ARM template. The template takes two parameters: an ApiKey of your choice (the secret the CCF connector will use to authenticate) and your Log Analytics workspace resource ID for Application Insights. Deployment takes about two to three minutes and outputs the FunctionAppName and endpoint URLs you will need later. Once deployed, verify the API is live: curl -s -H "X-API-Key: <your-api-key>" \ "https://<functionappname>.azurewebsites.net/api/GetNetworkLogs?page=1&pageSize=3" </functionappname></your-api-key> You should see a response like this: The API also exposes an /api/RefreshData endpoint that regenerates the 50 sample records with fresh timestamps. This is useful later in the walkthrough when you want to produce new events and trigger an immediate ingestion cycle without waiting for the next polling interval: curl -s -X POST -H "X-API-Key: <your-api-key>" \ "https://<functionappname>.azurewebsites.net/api/RefreshData" </functionappname></your-api-key> Building the Connector with the Sentinel Connector Builder Agent With the Microsoft Sentinel extension installed and GitHub Copilot running in agent mode, open a Copilot chat and enter a single prompt pointing at the API documentation file: That is the entire invocation. The agent takes it from there. It works through a structured seven-step sequence: preparation, polling config, table schema, DCR, connector definition, package validation, and summary. The agent produces four files in a sentinel-connectors/NetworkLogAPI_CCF/ output folder: NetworkLogAPI_PollingConfig.json – This is the API poller configuration. The agent reads the documentation and correctly identifies the GET /api/GetNetworkLogs endpoint, configures API Key authentication via the X-API-Key header, sets up NextPageUrl pagination using $.metadata.nextLink with a $.metadata.hasNextPage stop condition, and wires up the since query parameter for incremental delta pulls using the timestamp field. The RefreshData endpoint is correctly excluded, which the agent recognizes as a maintenance operation, not a security data stream. NetworkLogAPI_Table.json – This is the custom Log Analytics table schema for NetworkLogAPIGetNetworkLogs_CL . All 20 fields from the API response are mapped to the correct column types, with timestamp promoted to TimeGenerated as the standard Sentinel time column. NetworkLogAPI_DCR.json – This is the Data Collection Rule. This defines the stream declaration, the workspace destination, and the KQL transform that maps the raw snake_case API fields ( sourceIp , destinationIp , threatIndicator , etc.) to their PascalCase table columns. NetworkLogAPI_ConnectorDefinition.json – This is the connector UI configuration. This drives what the connector page looks like in Microsoft Sentinel: the title, description, prerequisite instructions, the BaseUrl and ApiKey input fields, sample KQL queries, and the connectivity status logic. The only point where the agent paused for input was to propose a connector description and ask for confirmation before writing it to the file. Everything else such as endpoint selection, auth type, pagination pattern, schema mapping, KQL transform, cross-file consistency was selected autonomously. To put that in perspective: without the agent, a developer building this connector from scratch would need to manually author four JSON files, understand the CCF schema for polling configs, DCRs, and connector definitions, write the KQL transform by hand, and validate that every cross-file reference lines up correctly. The agent compresses that work, typically hours of reading documentation, trial-and-error, and portal debugging, into a single prompt. Testing the Connector Before deploying anything to a Sentinel workspace, the Microsoft Sentinel connector builder agent lets you validate the generated polling config against the live API directly from your editor. Right-click the sentinel-connectors/NetworkLogAPI_CCF folder, select Microsoft Sentinel → Test Connector (Preview), and a Configuration Variables panel opens asking for the two template variables from the polling config: BaseUrl and apiKey . For other API patterns, there may be additional and different inputs. For example, apiKey input could be swapped with clientID and secret if the API supports OAUTH. Enter the Function App base URL and your API key, and the test runner connects immediately. The panel shows a live polling session. Poll #1 returns HTTP 200 with 50 events, and a countdown timer shows when the next poll will fire. Switching to the Events tab displays the ingested records in a tabular view with columns for timestamp , severity , action , bytesIn , bytesOut , category , and the rest of the mapped fields fresh from the API. Additionally, there are tabs for Headers, Payload, and Response, which can be useful for verifying that your pollerconfig.json configuration provides the expected request to your api with a working response. Data Extracted: The Test Connector feature can be used to visualize the response data in a table format to verify that data will land in a Sentinel table based on your configuration. Request from Poller: The Test Connector feature can be used to validate the request and response headers that will go out to the API based on the generated poller configuration. Request Response: The Test Connector feature shows you the live response from the API with respect to the request going to the API based on the poller configuration. This is a meaningful pre-flight check. It confirms that auth is working, the $.data events path resolves correctly, pagination is functional, and the polling interval fires as configured all before a single file is deployed to Azure. The most common connector configuration issues (wrong base URL, incorrect header name, mismatched JSON path) surface here in seconds rather than after a failed deployment and a 20-minute wait for Sentinel to attempt its first ingestion cycle. It is also the fastest way to troubleshoot if something goes wrong after deployment, far quicker than pushing changes to Azure and waiting for the connector to poll again. Deploying and Enabling the Connector With the connector tested and passing, deployment is the same right-click menu: right-click the sentinel-connectors/NetworkLogAPI_CCF folder, select Microsoft Sentinel → Deploy Connector (Preview). If you are not already signed in to Azure, the extension will prompt you to authenticate. The agent will also provide a clickbox in the chat window to invoke a connector deployment. Right Click Deploy Connector: UI Prompt Based Deploy Method: Once signed in, a workspace picker lists all available Log Analytics workspaces across your subscriptions. Select the one with Sentinel enabled and click Deploy. The extension deploys all four files to the workspace in the correct order: table schema first, then DCR, polling config, and connector definition. Once deployed, navigate to your Sentinel workspace via https://security.microsoft.com, go to Data Connectors, and find the Network Log API connector. The connector page shows the description, prerequisite notes, and the two credential fields generated by the agent: API Base URL and API Key. Enter your Function App base URL and API key and click Connect. The status updates to show the connector is connected and the deployment succeeded. Note: Data will appear in the workspace within 5 to 30 minutes depending on the polling interval. Run this query in Log Analytics to confirm ingestion. Note that the agent derives the table name from the vendor name and endpoint, so yours may differ slightly from the example below. Check the agent's summary output or the NetworkLogAPI_Table.json file for the exact name: NetworkLogAPIGetNetworkLogs_CL | sort by TimeGenerated desc | take 10 If you want to generate a fresh batch of events immediately rather than waiting for the next polling cycle, use the RefreshData endpoint to reset the sample records with new timestamps: curl -s -X POST -H "X-API-Key: " \ "https://.azurewebsites.net/api/RefreshData" Next Steps If you want to go further: Try it with your own API. The lab repo includes documentation on adapting the polling config, schema, and KQL transform to a real data source. Review the CCF connector schema documentation to understand the full range of supported configurations: pagination patterns, auth types, incremental pull strategies, and delta filter expressions. Explore the Microsoft Sentinel content hub to see how published connectors are structured and what the certification requirements look like for production submissions. Conclusion Following these steps, you saw how a working Sentinel connector can be generated, tested, and deployed in minutes rather than requiring days of manual configuration and infrastructure setup. If you are an ISV building a Sentinel integration and want hands-on support, Microsoft’s App Assure program is available to help. We partner with ISVs on connector development, validation, and deployment and provide guidance through implementation, testing, and readiness for production. You can get started by reaching out through our intake form. See our other Sentinel connector feature’s hands-on labs Building a CCF Nested API Pull Connector: A Technical Lab Walkthrough624Views0likes0Comments
SharePoint Multi-geo: accessing a user's home-geo custom SharePoint properties from a different geo
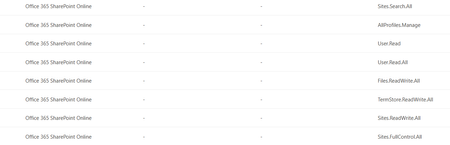
Setup M365 tenant, multi-geo (NAM + EMEA). SharePoint custom user profile properties are synced only in the user’s home geo (their Preferred Data Location). SPFx webparts running on the NAM tenant, using PnP/SP or AadTokenProvider. Goal: when an EMEA user opens a NAM page, read their SharePoint custom properties from the EMEA tenant. Issue 1 — Can’t read profile properties from a different geo-tenant What I’m doing const sp = spfi(emeaTenantUrl).using(SPFx(webpartContext), SPFxToken(webpartContext)); const result = await sp.profiles.getPropertiesFor(basicInfo.data.LoginName); Error Access Denied: This application does not have the required permissions to access profile information. The core problem — token is missing my approved scopes Approved Scopes in webApiPermissionManagement (Office 365 SharePoint Online) in SharePoint Admin Center: Sites.Search.All, AllProfiles.Manage, User.Read, User.Read.All, Files.ReadWrite.All, TermStore.ReadWrite.All, Sites.ReadWrite.All, Sites.FullControl.All. Token issued for the SharePoint resource only contains: Files.ReadWrite.All, M365BillingPlatform.Read.All, Sites.FullControl.All, Sites.ReadWrite.All, TermStore.ReadWrite.All. So AllProfiles.Manage, User.Read.All, Sites.Search.All are not in the token and an unexpected M365BillingPlatform.Read.All is. Also tried calling the SharePoint REST API directly with a token from AadTokenProvider → same Access Denied. Questions Why is the issued token missing my approved scopes (and where is M365BillingPlatform.Read.All coming from)? Is there a supported way to read a user’s SharePoint profile custom properties from a different geo-tenant from an SPFx webpart? Approved Scopes in Admin center Issue 2 — Search query template {User.*} properties not resolving cross-geo What I’m doing A SharePoint Search query in the webpart uses a query template that pulls custom user properties dynamically: {|owstaxidmetadataalltagsinfo:{User.customProperty1}} OR {|owstaxidmetadataalltagsinfo:{User.customProperty2}} The SP object is created the same way as in Issue 1. What’s not working When an EMEA user loads the webpart on the NAM tenant, the {User.*} tokens don’t resolve — the query modification shows the static property name itself instead of the user’s values from EMEA. Question How do I get the query template to resolve {User.customProperty} using the user’s home-geo (EMEA) profile values?36Views0likes0CommentsPost-Stream Refinement is now generally available in Microsoft Foundry
When we introduced Post-Stream Refinement in public preview earlier this year, it closed the oldest trade-off in real-time speech: you could finally keep instant streaming results and get a highly accurate final transcript, with no penalty to first-token latency. A second recognition pass runs in parallel with streaming and replaces each final segment with a more accurate version once the utterance completes. Today, Post-Stream Refinement reaches general availability for Azure AI Speech in Microsoft Foundry, backed by a production SLA. Just as important, it now ships with the capabilities production transcription actually depends on: diarization to preserve who said what, phrase lists for your product names and domain vocabulary, and a much wider footprint of 19 locales across 22 Azure regions. Everything you already know about Post-Stream Refinement still applies. The real-time contract is unchanged, your partial results stream exactly as before, and you enable refinement by setting a single property on your existing SpeechConfig. What changes at GA is that the refined transcript is now production-grade and speaker-aware. 📖 Read the Documentation What's new at general availability If you have already used Post-Stream Refinement in preview, here is exactly what changes at GA, and what stays the same. The streaming path and SDK contract are untouched; the refinement pass is now production-ready and gains speaker and vocabulary features. How Post-Stream Refinement works Real-time and final results serve different needs. Partial results must appear quickly so captions, voice interfaces, and agent turn-taking stay responsive. Final results need enough context to support storage, search, summarization, and business workflows. Post-Stream Refinement runs both at once: a fast streaming pass and a deeper refinement pass over the same audio, in parallel. Because the two passes share one input stream, enabling refinement does not require a second transcription job or a separate client pipeline. Your existing recognition events and partial-result handling stay exactly as they are. Speaker attribution with diarization New at GA, diarization is supported on the Post-Stream Refinement path, so the refined final transcript keeps its speaker labels. That makes the release a strong fit for meetings, contact centers, interviews, and any workflow where the transcript needs to identify who spoke, not just what was said. The refinement pass improves the wording, including proper nouns and named entities, while every utterance stays attributed to the right speaker. Phrase lists for your vocabulary Phrase lists let the recognizer prioritize the names and terms that matter to your application: product catalogs, medical and technical vocabulary, organization names, and acronyms that general speech models might not recognize consistently. At GA you can pair phrase lists with refinement so the second pass has both broad audio context and your domain vocabulary to draw on, which is where the largest accuracy gains on named entities show up. Quality impact In internal testing and partner evaluations across supported locales, Post-Stream Refinement reduced final-transcript word error rate by double-digit relative percentages compared with standard real-time transcription, with the largest gains on the hardest content: long utterances, proper nouns, and domain-specific speech. Pairing phrase lists with refinement improves named-entity accuracy further. Partial-result latency is unchanged; only the final transcript is refined. The refined final result may add a small amount of latency to the final segment because refinement happens after the segment audio is received. Partial results are unaffected. Supported languages and regions General availability supports 19 locales. You declare one locale per session, so the service is tuned to the language you expect. Alongside the Tier-1 languages, GA adds Indic locales, including Bengali, Marathi, Punjabi, and Telugu. Post-Stream Refinement is generally available in 22 Azure regions across the Americas, Europe, and Asia Pacific. Proven at Microsoft scale The technology behind Post-Stream Refinement already powers meeting transcription and Microsoft 365 Copilot experiences in Microsoft Teams, serving millions of users across meetings, webinars, and live events every day. General availability brings the same quality bar to every Azure AI Speech customer through a supported SDK integration, not a research prototype. Preview customers across industries, including automotive, consumer electronics, and aviation, reported positive gains in transcription quality, with the clearest improvements on the hardest content: proper nouns, long-form speech, and domain-specific audio. Several are now moving those workloads into production on the GA release. Get started Enabling Post-Stream Refinement is a small configuration change on your existing SpeechConfig. You will need: Speech SDK 1.50 or later. Earlier versions do not support the refinement path. A Speech resource in one of the supported regions listed above. The session locale you expect, set on the recognizer. Set the post-processing option to PostRefinement. The example below also shows the optional phrase list for your domain vocabulary. import azure.cognitiveservices.speech as speechsdk speech_config = speechsdk.SpeechConfig( subscription="YourSpeechKey", region="YourSpeechRegion") # Declare one locale for the session speech_config.speech_recognition_language = "en-US" # 1) Refine the final transcript (Post-Stream Refinement) speech_config.set_property( speechsdk.PropertyId.SpeechServiceResponse_PostProcessingOption, "PostRefinement") audio_config = speechsdk.AudioConfig(use_default_microphone=True) recognizer = speechsdk.SpeechRecognizer( speech_config=speech_config, audio_config=audio_config) # 2) (Optional) Phrase list for names, acronyms, and domain terms phrase_list = speechsdk.PhraseListGrammar.from_recognizer(recognizer) for term in ["Contoso", "Fabrikam", "Foundry", "OAuth"]: phrase_list.addPhrase(term) Your existing recognition events and partial-result handling remain unchanged. For speaker attribution, enable diarization through the established real-time diarization path; refinement applies to the final transcript while speaker labels are preserved. Choose the right release for your workload Post-Stream Refinement now has two paths. They are the same product family with a different feature boundary, so match the path to what your customer needs. Monolingual PSR — generally available Multilingual PSR — public preview Language selection One locale declared per session Automatic detection and code-switching in a single stream (open-range, no locale declared) Supported locales 19 locales, including Indic bn / mr / pa / te 25 languages / 29 locales, auto-detected Azure regions 22 Azure regions across the Americas, Europe, and Asia Pacific 6 Azure regions Phrase lists & diarization Supported Only diarization is supported Working across languages? If a single stream needs to handle multiple languages or code-switching without a declared locale, use Multilingual Post-Stream Refinement, now in public preview. For a known session locale with phrase lists and diarization, monolingual GA is the right path. Try Post-Stream Refinement Today Turn on higher-accuracy, language-aware transcription in your Azure AI Speech applications with a single configuration change. 📖 Read the Documentation We would love your feedback. Try Post-Stream Refinement in your applications and tell us how it improves your transcription quality.572Views0likes0CommentsFor the first time, real-time transcription goes multilingual
When we introduced Post-Stream Refinement earlier this year, it closed the oldest gap in real-time speech: you could finally get instant streaming results and a highly accurate final transcript, with no latency penalty. But it kept one hard requirement — you had to tell the service, up front, which single language to expect. Real-world speech does not work that way. People code-switch mid-sentence, product and brand names cross languages, and a global app serves users who simply speak differently from one session to the next. Today we remove that requirement. Multilingual Post-Stream Refinement enters public preview for Azure AI Speech in Microsoft Foundry, and for the first time ever a single real-time stream can transcribe multiple languages in one session — the spoken language is detected automatically, no locale is declared in advance, and the final transcript is refined for accuracy. Everything you already know about Post-Stream Refinement still applies; what changes is that the refinement pass itself is now multilingual. 📖 Read the Documentation What's New in This Release If you have already used Post-Stream Refinement, here is exactly what changes with the multilingual preview — and what stays the same: Quality Impact In internal testing and partner evaluations across Tier-1 locales, multilingual Post-Stream Refinement reduced word error rate (WER) by approximately 10% relative on average, with double-digit relative reductions on the hardest cases — long utterances, proper nouns, and multilingual or code-switched speech. Partial-result latency is unchanged; only the final transcript is refined. Gains are relative reductions versus the standard real-time model and vary by language, acoustic conditions, and content type. The refined final result may add a small amount of latency to the final segment; partial results are unaffected. Supported Languages and Regions The public preview supports 15 Tier-1 locales. Because language is detected automatically, a single stream can contain any mix of them: Available in these Azure regions: Real-World Impact Preview customers across industries — including travel, consumer electronics, automotive, aviation, and media — have reported positive gains in transcription quality. Customers testing multilingual and domain-specific audio have observed the clearest improvements on the hardest content: proper nouns, code-switching, and long-form speech. Several are actively validating the feature on their own audio ahead of general availability. Get Started Enabling multilingual Post-Stream Refinement is a small configuration change on your existing SpeechConfig. You will need: Speech SDK 1.50 or later. Earlier versions do not support the multilingual path. A Speech resource in one of the supported regions listed above. Auto-detect language configuration (open range) so the service identifies the language from the audio — no candidate list required. Set the post-processing option to PostRefinement and pass an open-range AutoDetectSourceLanguageConfig when you create the recognizer. Here is a complete, copy-paste Python example, including the optional end-of-utterance detection line: import azure.cognitiveservices.speech as speechsdk speech_config = speechsdk.SpeechConfig( subscription="YourSpeechKey", region="YourSpeechRegion") # 1) Refine the final transcript (Post-Stream Refinement) speech_config.set_property( speechsdk.PropertyId.SpeechServiceResponse_PostProcessingOption, "PostRefinement") # 2) Multilingual auto-detect - no candidate language list needed auto_detect_config = speechsdk.languageconfig.AutoDetectSourceLanguageConfig() audio_config = speechsdk.AudioConfig(use_default_microphone=True) recognizer = speechsdk.SpeechRecognizer( speech_config=speech_config, auto_detect_source_language_config=auto_detect_config, audio_config=audio_config) 💡 Tip: Refinement matters most for applications that store or process the final transcript — meeting notes, call analytics, compliance archives, AI summarization. If you only use partial results for a live display and discard them, your real-time UX (already fast) is unchanged, while any final transcript you keep improves. Try Multilingual Post-Stream Refinement Today Turn on higher-accuracy, language-aware transcription in your Azure AI Speech applications with a single configuration change. Available now in public preview in Microsoft Foundry. 📖 Read the Documentation We would love your feedback. Try Post-Stream Refinement in your applications and tell us how it improves your transcription quality.550Views0likes0CommentsClarification on SharePoint Macro Consent Flow and Permissions
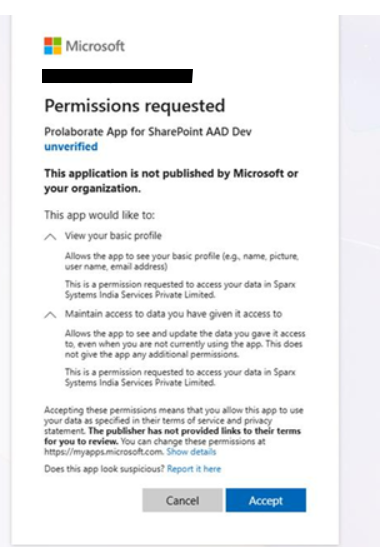
Hi Team, We have a customer using SharePoint in a secure environment. While configuring the Prolaborate SharePoint Macro on their site, a consent popup is displayed during the approval process. Previously, our macro implementation used the Admin Consent flow. Based on the customer’s security and approval requirements, we have modified the consent to use the User Consent flow instead. The customer has requested additional clarification regarding the consent process. Specifically, they would like to understand: The exact API calls triggered for these two consents View your basic profile Maintain access to data you have given it access to The permissions being requested from Microsoft Graph or SharePoint Whether the application requests any tenant-wide or high-privilege permissions Whether minimal permissions such as Sites.Selected can be used instead of broader scopes Current concern: The customer feels the current permission request is too broad for approval within their secure environment (Banking customer). Reason: Their internal approval process requires clear visibility into the exact API and permission scopes being requested, as different permissions are reviewed and approved by different internal teams (for example, User.Read is managed by the Identity team). From our implementation side, we are using only custom APIs and are not directly calling Microsoft Graph APIs. This information will help us provide a clear response to the customer and support their internal approval process.110Views0likes1Comment
Troubleshooting Microsoft Foundry Accessing On‑Premises APIs Over Private Networking
Audience: Azure solution architects, network engineers, and AI practitioners deploying Microsoft Foundry in enterprise, network‑isolated environments. Scenario: Foundry Agent Service must call an on‑premises (or privately hosted) API over VPN or ExpressRoute using on‑premises corporate DNS. Connectivity works from a virtual machine (VM) in the virtual network (VNet), but fails when the same call is made from a Foundry agent. This post consolidates common field patterns observed across customer engagements and maps them directly to official Microsoft guidance. It highlights a frequently missed prerequisite for private connectivity: Project and Agent Capability Hosts. The Repeating Enterprise Pattern The architecture is familiar: Microsoft Foundry account and project Customer‑managed VNet with VPN or ExpressRoute to on‑premises Corporate (on‑premises) DNS used for API name resolution A VM in the VNet can successfully resolve and call the on‑prem API Foundry agents are configured to call the same API (often via an OpenAPI tool) Despite this, the agent fails with one or more of the following: DNS resolution failures Connection timeouts HTTP 401 or 403 responses Unexpected backend or proxy URLs appearing in logs The consistent question is: Why does this work from a VM in the VNet but not from the Foundry agents? Key Principle: Foundry Agents Do Not Automatically Run in Your VNet This is the most important mental model to reset. Creating a private endpoint for a Foundry Agent Service does not place agent runtime traffic into your VNet. Private endpoints are inbound constructs. Outbound connectivity from an agent only flows through your VNet when specific requirements are met. The most critical of those requirements is a Capability Host. What Is a Capability Host? A Capability Host defines where Foundry capabilities are allowed to execute. In private networking scenarios, the capability host: Binds a Foundry project or agent to a customer‑managed subnet Enables platform‑managed container injection into that subnet Ensures outbound traffic follows VNet routing, security controls, and DNS configuration Capability Host Scope Project Capability Host Associated at the project level Applies to all agents in the project Defines the customer subnet the project is allowed to use Agent Capability Host Associated at the individual agent level Can explicitly bind or override subnet placement Useful when agents require different isolation boundaries Key field insight: If no capability host is associated, the agent runtime is not injected into the VNet—even if VPN, ExpressRoute, private endpoints, and on‑prem DNS are correctly configured. Capability Host Lifecycle (Conceptual) 1 Microsoft Foundry Account ↓ Project ↓ Capability Host ↓ Delegated Agent Subnet (VNet) ↓ Agent Runtime (Container Injection) Without the capability host step, the chain breaks and the agent executes outside the customer network boundary. Why On‑Premises DNS Appears Correct—but Still Fails DNS is where most investigations stall. Teams typically confirm: On‑premises DNS resolves the API hostname VNet DNS settings forward queries to on‑prem DNS A VM in the subnet resolves and reaches the API Yet the agent still fails. The reason is simple: The VM is unquestionably inside the VNet The agent may not be Without a capability host, the agent runtime does not inherit: VNet DNS server settings Corporate DNS forwarding rules On‑premises name resolution paths As a result, DNS fails even though the DNS design itself is correct. Secondary Symptom: HTTP 401 Errors After subnet injection and DNS are corrected, some customers encounter HTTP 401 responses. This typically means: The API is now reachable The request is successfully routed through the private path Authentication or authorization is failing At this stage, troubleshooting moves from networking to identity: Validate the credential or token configured in the Foundry connection Confirm expected headers, audience, or auth flow Account for managed proxy hops in the request path A 401 at this point is progress—it confirms private connectivity is working. Permissions and Required Services for Capability Hosts Creating capability hosts requires both the correct Azure role-based access control (RBAC) permissions and the presence of specific dependent services. These prerequisites are frequently overlooked and can silently block capability host creation or leave hosts in a failed provisioning state. Required Permissions (RBAC) Microsoft documentation explicitly calls out the following minimum permissions: Contributor role on the Microsoft Foundry account to create capability hosts. User Access Administrator or Owner role on the subscription or resource group to grant the Foundry project’s managed identity access to dependent Azure resources when using standard agent setup. Without these roles, capability host creation may fail, or the host may be created without access to required downstream services. For details, see Role-based access control (RBAC) for Microsoft Foundry. Required Azure Services and Connections For standard and network-secured agent setups, capability hosts reference customer-owned Azure resources. The following services must exist and be connected to the Foundry project before creating the capability host: Azure Storage – for file uploads and artifacts Azure AI Search – for vector stores and retrieval Azure Cosmos DB – for thread and conversation storage Azure AI Services / Azure OpenAI – for model execution These services must be deployed in supported regions and, for private networking scenarios, in the same region as the virtual network. Capability hosts reference these resources through project connections, not raw resource IDs . Networking-Specific Requirements When using private networking: The agent subnet must already exist and be delegated appropriately. The capability host must reference the correct customer subnet at creation time. Required private endpoints and DNS resolution must be in place for dependent services. If networking or connections change, capability hosts cannot be updated in-place and must be deleted and recreated with the corrected configuration . Practical Fix Patterns 1. Create and Associate a Project Capability Host Bind the project to the intended delegated agent subnet Verify the customerSubnet reference Redeploy the agent after association This aligns directly with the Standard Setup with Private Networking model documented by Microsoft. 2. Validate Agent Placement and Network Inheritance Confirm the agent is associated with the expected capability host Verify the capability host references the correct subnet Ensure network and DNS settings are applied at the subnet level The agent inherits routing and DNS behavior only after successful subnet injection. 3. Validate DNS From the Agent Subnet Confirm VNet DNS settings point to on‑prem DNS Test name resolution from a VM in the same subnet Once injected, the agent uses the same DNS behavior as other resources in that subnet. 4. Use a Supported Foundry Experience Be aware of documented constraints: End‑to‑end network isolation is not supported in the newer Foundry portal experience Network‑isolated agent scenarios require the classic Foundry experience, SDK, or CLI Hosted agents do not support full isolation Mismatch here can make a correct network design appear broken. A Simple Checklist When a Foundry agent cannot reach an on‑prem API: Is a **Project Capability **Host associated? Is the capability host bound to the correct subnet? Is on‑prem DNS reachable from that subnet? Is a supported Foundry experience in use? If reachable, is authentication configured correctly? If items 1 and 2 are not satisfied, all other troubleshooting is premature. Closing Most private networking issues with Microsoft Foundry are not caused by VPNs or DNS infrastructure. They result from an incomplete understanding of **where the agent ****runtime ****actually **executes. Capability Hosts are the control point. When they are correctly configured, Foundry agents behave exactly as described in Microsoft guidance: they inherit VNet routing, DNS, and security controls and can securely access on‑premises systems over private connectivity. No capability host = no VNet injection = no on‑prem connectivity. References The following Microsoft‑published resources were referenced and aligned with throughout this article: Network‑secured agent setup (GitHub) – Reference implementation demonstrating a network‑secured Foundry Agent Service deployment with a customer‑managed virtual network, delegated agent subnet, and private connectivity patterns. This notebook illustrates how agent runtimes inherit network behavior only after subnet injection ralacher/network-secured-agent Set up private networking for Foundry Agent Service - Microsoft Foundry | Microsoft Learns .814Views2likes0CommentsTurn Enterprise Knowledge into Answers with Copilot Studio and Azure AI Search
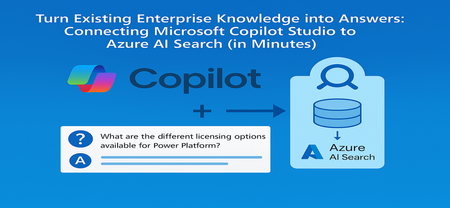
From the Field: Why This Integration Works As an experienced AI Cloud Solution Architect working in Greater China Region (GCR), I’ve seen one emerging pattern that delivers quick wins for some of my customers: combining Microsoft Copilot Studio with an existing Azure AI Search index. Teams choose this approach because it delivers two outcomes immediately: business users get grounded, reliable answers, and enterprises avoid re-building pipelines or re-platforming knowledge stores. This guide shows exactly how to connect Copilot Studio to an Azure AI Search index that is already live, so your copilot can answer confidently using your enterprise documents. What We Assume Is Already Ready To stay focused on the integration step, we assume: You have an Azure AI Search service deployed You have an index containing vectorized content (manuals, PDFs, policies, FAQs) Your platform/data team already handled ingestion, embeddings, and indexing In short, your Azure AI Search endpoint and admin key are ready, and the index already contains chunked content with embeddings. Step 1 - Collect Your Azure AI Search Connection Details From the Azure AI Search resource: Endpoint URL Azure AI Search → Overview → Url: https://<your-search-service>.search.windows.net Admin Key Azure AI Search → Keys Use either the primary or secondary key. Governance tip: For production, rotate keys regularly and use managed identities when possible. Step 2 - Add Azure AI Search as Knowledge Inside Copilot Studio Open your Copilot Studio agent Go to the Knowledge tab Select Add knowledge, choose Azure AI Search Provide: Endpoint URL Admin key Create or select the connection Choose your existing index from the dropdown Select Add to agent Step 3 - Test a Grounded Response Open the Test copilot pane and ask a question your indexed content can answer, such as: “What are the different licensing options available for Power Platform?” Verify that: The Activity Map shows Azure AI Search being invoked The answer reflects the correct document in your index Citations or references appear where applicable Conclusion Business value: You can activate grounded, explainable answers in Copilot Studio immediately by reusing your existing Azure AI Search index - no re-platforming, no new pipelines. Team model: Data/Platform teams own ingestion, enrichment, and vectorization. Business teams build and refine the copilot experience in Copilot Studio. Scale and governance: All components stay inside Azure, with enterprise-grade security, RBAC, and operational monitoring, while enabling low‑code agility for makers. For the full end-to-end lab (storage setup, embeddings, index creation), see: 🔗 https://github.com/Azure/Copilot-Studio-and-Azure (Lab 1.4). Acknowledgements This tutorial builds on foundational work by my EMEA colleague Pablo Carceller, whose GitHub repo on Copilot Studio and Azure has helped teams worldwide accelerate real customer implementations. 👉 GitHub - Copilot Studio and Azure: https://github.com/Azure/Copilot-Studio-and-Azure I would also like to thank the broader Cloud Accelerate Factory GCR team for their contributions, insights, and active collaboration in validating this pattern across customer engagements. Special appreciation to our AI Architects Dr. Longyu Qi, Jian (Jason) Shao, Lei (Leo) Ma, and Ethan Tseng, as well as our PM partners Yunxi (Rayne) Jin and Emma Wang, whose feedback and field experiences helped shape and refine this guide. Image credits: demo visuals adapted from materials by Pablo Carceller (GitHub Lab 1.4).599Views1like0CommentsTracking Every Token: Granular Cost and Usage Metrics for Microsoft Foundry Agents
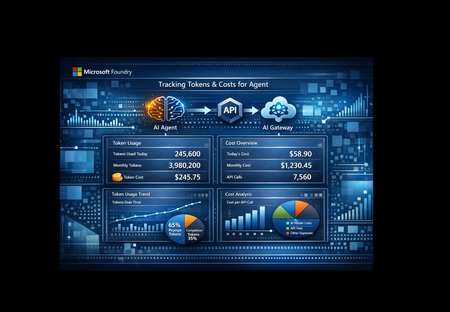
As organizations scale their use of AI agents, one question keeps surfacing: how much is each agent actually costing us? Not at the subscription level. Not at the resource group level. Per agent, per model, per request. This post walks through a solution that answers that question by combining three Azure services Microsoft AI Foundry, Azure API Management (APIM), and Application Insights into an observable, metered AI gateway with granular token-level telemetry including custom dates greater than a month for deeper analysis. The Problem: AI Costs Can be a Black Box Foundry’s built-in monitoring and cost views are ultimately powered by telemetry stored in Application Insights, and the out-of-the-box dashboards don’t always provide the exact per-request/per-caller token breakdown or the custom aggregations/joins teams may want for bespoke dashboards (for example, breaking down tokens by APIM subscription, product, tenant, user, route, or agent step). Using APIM to stamp consistent caller/context metadata (headers/claims), Foundry to generate the agent/model run telemetry, and App Insights as the queryable store to let you correlate gateway, agent run, tool/model calls and then build custom KQL-driven dashboards. With data captured in App Insights and custom KQL queries, questions such as below can be answered: Which agent consumed the most tokens last week? What's the average cost per request for a specific agent? How do prompt tokens vs. completion tokens break down per model? Is one agent disproportionately expensive compared to others? Why This Solution Was Built This solution was built to close the observability gap between "we deployed agents" and "we understand what those agents cost." The goals were straightforward: Per-agent, per-model cost attribution - Know exactly which agent is consuming what, down to the token. Real-time telemetry, not batch reports - Metrics flow into Application Insights within minutes, query via KQL. Zero agent modification - The agents themselves don't need to know about telemetry. The tracking happens at the gateway layer. Extensibility - Any agent hosted in Microsoft Foundry and exposed through APIM can be added with a single function call. How It Works The architecture is intentionally simple three services, one data flow. The notebook serves as a testing and prototyping environment, but the same `call_agent()` and `track_llm_usage()` code can be lifted directly into any production Python application that calls Foundry agents. Azure API Management acts as the AI Gateway. Every request to a Foundry-hosted agent flows through APIM, which handles routing, rate limiting, authentication, and tracing. APIM adds its own trace headers (`Ocp-Apim-Trace-Location`) so you can correlate gateway-level diagnostics with your application telemetry. After the API request is successfully completed, we can extract the necessary data from response headers. The notebook is designed for testing and rapid iteration call an agent, inspect the response, verify that telemetry lands in App Insights. It uses `httpx` to call agents through APIM, authenticating with `DefaultAzureCredential` and an APIM subscription key. After each response, it extracts the `usage` object `input_tokens`, `output_tokens`, `total_tokens` — and calculates an estimated cost based on built-in per-model pricing. Application Insights receives this telemetry via OpenTelemetry. The solution sends data to two tables: customMetrics - Cumulative counters for prompt tokens, completion tokens, total tokens, and cost in USD. These power dashboards and alerts. traces - Structured log entries with `custom_dimensions` containing agent name, model, operation ID, token counts, and cost per request. These power ad-hoc KQL queries. traces - stores your application’s trace/log messages (plus custom properties/measurements) as queryable records in Azure Monitor Logs. Demonstrating Granular Cost and Usage Metrics This is where the solution shines. Once telemetry is flowing, you can answer detailed questions with simple KQL queries. Per-Request Detail Query the `traces` table to see every individual agent call with full token and cost breakdown: traces | where message == "llm.usage" | extend cd = parse_json(replace_string( tostring(customDimensions["custom_dimensions"]), "'", "\"")) | extend agent_name = tostring(cd["agent_name"]), model = tostring(cd["model"]), prompt_tokens = toint(cd["prompt_tokens"]), completion_tokens = toint(cd["completion_tokens"]), total_tokens = toint(cd["total_tokens"]), cost_usd = todouble(cd["cost_usd"]) | project timestamp, agent_name, model, prompt_tokens, completion_tokens, total_tokens, cost_usd | order by timestamp desc This gives you a line-item audit trail every request, every agent, every token. Aggregated Metrics Per Agent Summarize across all requests to see averages and totals grouped by agent and model: traces | where message == "llm.usage" | extend cd = parse_json(replace_string( tostring(customDimensions["custom_dimensions"]), "'", "\"")) | extend agent_name = tostring(cd["agent_name"]), model = tostring(cd["model"]), prompt_tokens = toint(cd["prompt_tokens"]), completion_tokens = toint(cd["completion_tokens"]), total_tokens = toint(cd["total_tokens"]), cost_usd = todouble(cd["cost_usd"]) | summarize calls = count(), avg_prompt = avg(prompt_tokens), avg_completion = avg(completion_tokens), avg_total = avg(total_tokens), avg_cost = avg(cost_usd), total_cost = sum(cost_usd) by agent_name, model | order by total_cost desc Now you can see at a glance: Which agent is the most expensive across all calls Average token consumption per request useful for prompt optimization Prompt-to-completion ratio a high ratio may indicate verbose system prompts that could be trimmed Cost trends by model is GPT-4.1 worth the premium over GPT-4o-mini for a particular agent? The same can be done in code with your custom solution: from datetime import timedelta from azure.identity import DefaultAzureCredential from azure.monitor.query import LogsQueryClient KQL = r""" traces | where message == "llm.usage" | extend cd_raw = tostring(customDimensions["custom_dimensions"]) | extend cd = parse_json(replace_string(cd_raw, "'", "\"")) | extend agent_name = tostring(cd["agent_name"]), model = tostring(cd["model"]), operation_id = tostring(cd["operation_id"]), prompt_tokens = toint(cd["prompt_tokens"]), completion_tokens = toint(cd["completion_tokens"]), total_tokens = toint(cd["total_tokens"]), cost_usd = todouble(cd["cost_usd"]) | project timestamp, agent_name, model, operation_id, prompt_tokens, completion_tokens, total_tokens, cost_usd | order by timestamp desc """ def query_logs(): credential = DefaultAzureCredential() client = LogsQueryClient(credential) resp = client.query_resource( resource_id=APP_INSIGHTS_RESOURCE_ID, # defined in config cell query=KQL, timespan=None, # No time filter — returns all available data (up to 90-day retention) ) if resp.status != "Success": raise RuntimeError(f"Query failed: {resp.status} - {getattr(resp, 'error', None)}") table = resp.tables[0] rows = [dict(zip(table.columns, r)) for r in table.rows] return rows if __name__ == "__main__": rows = query_logs() if not rows: print("No telemetry found. Wait 2-5 min after running the agent cell and try again.") else: print(f"Found {len(rows)} records\n") print(f"{'Timestamp':<28} {'Agent':<16} {'Model':<12} {'Op ID':<12} " f"{'Prompt':>8} {'Completion':>11} {'Total':>8} {'Cost ($)':>10}") print("-" * 110) for r in rows[:20]: ts = str(r.get("timestamp", ""))[:19] print(f"{ts:<28} {r.get('agent_name',''):<16} {r.get('model',''):<12} " f"{r.get('operation_id',''):<12} {r.get('prompt_tokens',0):>8} " f"{r.get('completion_tokens',0):>11} {r.get('total_tokens',0):>8} " f"{r.get('cost_usd',0):>10.6f}") What You Can Build on Top Azure Workbooks - Build interactive dashboards showing cost trends over time, agent comparison charts, and token distribution heatmaps. Alerts - Trigger notifications when a single agent exceeds a cost threshold or when token consumption spikes unexpectedly. Azure Dashboard pinning - Pin KQL query results directly to a shared Azure Dashboard for team visibility. Power BI integration - Export telemetry data for executive-level cost reporting across all AI agents. Extensibility: Add Any Agent in One Line The solution is designed to scale with your agent portfolio. Any agent hosted in Microsoft Foundry and exposed through APIM can be integrated without modifying the telemetry pipeline. Adding a new agent is a single function call: response = call_agent("YourNewAgent", "Your prompt here") Token tracking, cost estimation, and telemetry export happen automatically. No additional configuration, no new infrastructure. From Notebook to Production The notebook is a testing harness, a fast way to validate agent connectivity, inspect raw responses, and confirm that telemetry arrives in App Insights. But the code isn't limited to notebooks. The core functions `call_agent()`, `track_llm_usage()`, and the OpenTelemetry configuration are plain Python. They can be dropped directly into any production application that calls Foundry agents through APIM: FastAPI / Flask web service - Wrap `call_agent()` in an endpoint and get per-request cost tracking out of the box. Azure Functions - Call agents from a serverless function with the same telemetry pipeline. Background workers or batch pipelines - Process multiple agent calls and aggregate cost data across runs. CLI tools or scheduled jobs - Run agent evaluations on a schedule with automatic cost logging. The pattern stays the same regardless of where the code runs: # 1. Configure OpenTelemetry + App Insights (once at startup) configure_azure_monitor(connection_string=APP_INSIGHTS_CONN) # 2. Call any agent through APIM response = call_agent("FinanceAgent", "Summarize Q4 earnings") # 3. Token usage and cost are tracked automatically # → customMetrics and traces tables in App Insights Start with the notebook to prove the pattern works. Then move the same code into your production codebase, the telemetry travels with it. Key Takeaways AI cost observability matters. As agent counts grow, per-agent cost attribution becomes essential for budgeting and optimization. APIM as an AI Gateway gives you routing, rate limiting, and tracing in one place without touching agent code. OpenTelemetry + Application Insights provides a battle-tested telemetry pipeline that scales from a single notebook to production workloads. KQL makes the data actionable. Per-request audits, per-agent summaries, and cost trending are all a query away. The solution is additive, not invasive. Agents don't need modification. The telemetry layer wraps around them. This approach gives developers the abiility to view metrics per user, API Key, Agent, request / tool call, or business dimensions(Cost Center, app, environment). If you're running AI agents in Microsoft Foundry and want to understand what they cost at a granular level this pattern gives you the visibility to make informed decisions about model selection, prompt design, and budget allocation. The full solution is available on GitHub: https://github.com/ccoellomsft/foundry-agents-apim-appinsights3.6KViews2likes0CommentsYour Sentinel AMA Logs & Queries Are Public by Default - AMPLS Architectures to Fix That
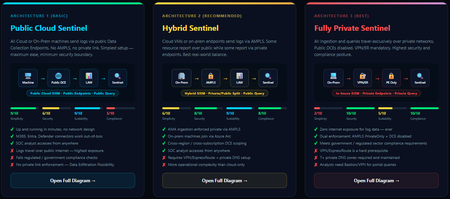
When you deploy Microsoft Sentinel, security log ingestion travels over public Azure Data Collection Endpoints by default. The connection is encrypted, and the data arrives correctly — but the endpoint is publicly reachable, and so is the workspace itself, queryable from any browser on any network. For many organisations, that trade-off is fine. For others — regulated industries, healthcare, financial services, critical infrastructure — it is the exact problem they need to solve. Azure Monitor Private Link Scope (AMPLS) is how you solve it. What AMPLS Actually Does AMPLS is a single Azure resource that wraps your monitoring pipeline and controls two settings: Where logs are allowed to go (ingestion mode: Open or PrivateOnly) Where analysts are allowed to query from (query mode: Open or PrivateOnly) Change those two settings and you fundamentally change the security posture — not as a policy recommendation, but as a hard platform enforcement. Set ingestion to PrivateOnly and the public endpoint stops working. It does not fall back gracefully. It returns an error. That is the point. It is not a firewall rule someone can bypass or a policy someone can override. Control is baked in at the infrastructure level. Three Patterns — One Spectrum There is no universally correct answer. The right architecture depends on your organisation's risk appetite, existing network infrastructure, and how much operational complexity your team can realistically manage. These three patterns cover the full range: Architecture 1 — Open / Public (Basic) No AMPLS. Logs travel to public Data Collection Endpoints over the internet. The workspace is open to queries from anywhere. This is the default — operational in minutes with zero network setup. Cloud service connectors (Microsoft 365, Defender, third-party) work immediately because they are server-side/API/Graph pulls and are unaffected by AMPLS. Azure Monitor Agents and Azure Arc agents handle ingestion from cloud or on-prem machines via public network. Simplicity: 9/10 | Security: 6/10 Good for: Dev environments, teams getting started, low-sensitivity workloads Architecture 2 — Hybrid: Private Ingestion, Open Queries (Recommended for most) AMPLS is in place. Ingestion is locked to PrivateOnly — logs from virtual machines travel through a Private Endpoint inside your own network, never touching a public route. On-premises or hybrid machines connect through Azure Arc over VPN or a dedicated circuit and feed into the same private pipeline. Query access stays open, so analysts can work from anywhere without needing a VPN/Jumpbox to reach the Sentinel portal — the investigation workflow stays flexible, but the log ingestion path is fully ring-fenced. You can also split ingestion mode per DCE if you need some sources public and some private. This is the architecture most organisations land on as their steady state. Simplicity: 6/10 | Security: 8/10 Good for: Organisations with mixed cloud and on-premises estates that need private ingestion without restricting analyst access Architecture 3 — Fully Private (Maximum Control) Infrastructure is essentially identical to Architecture 2 — AMPLS, Private Endpoints, Private DNS zones, VPN or dedicated circuit, Azure Arc for on-premises machines. The single difference: query mode is also set to PrivateOnly. Analysts can only reach Sentinel from inside the private network. VPN or Jumpbox required to access the portal. Both the pipe that carries logs in and the channel analysts use to read them are fully contained within the defined boundary. This is the right choice when your organisation needs to demonstrate — not just claim — that security data never moves outside a defined network perimeter. Simplicity: 2/10 | Security: 10/10 Good for: Organisations with strict data boundary requirements (regulated industries, audit, compliance mandates) Quick Reference — Which Pattern Fits? Scenario Architecture Getting started / low-sensitivity workloads Arch 1 — No network setup, public endpoints accepted Private log ingestion, analysts work anywhere Arch 2 — AMPLS PrivateOnly ingestion, query mode open Both ingestion and queries must be fully private Arch 3 — Same as Arch 2 + query mode set to PrivateOnly One thing all three share: Microsoft 365, Entra ID, and Defender connectors work in every pattern — they are server-side pulls by Sentinel and are not affected by your network posture. Please feel free to reach out if you have any questions regarding the information provided.488Views3likes2Comments