Virtualization Nation,
We just completed a great week at MMS 2011 in Las Vegas. To say it was a busy week would be a huge understatement. To everyone that attended, our sincere thanks.
I spoke to a lot of folks at the show and the feedback was overwhelmingly positive. Whether it was the announcements for:
-
System Center Virtual Machine Manager 2012 Beta
-
System Center Configuration Manager 2012 Beta
-
System Center Advisor Beta
-
The final release of Windows Intune
-
The sneak peek at System Center Codename “Concero”
…or the fact that every product in the System Center portfolio is being revved this year, everyone’s excited to see what the System Center 2012 releases have to offer. As usual, the hands-on labs and instructor-led labs continue to be some of the most popular offerings at MMS. MMS Labs offer folks the opportunity to kick the tires on all of the existing and newly released and Beta products. As usual the lines started early.
MMS 2010: Quick Refresher
For the second year in a row, all of the MMS Labs were 100% virtualized using Windows Server 2008 R2 Hyper-V and managed via System Center by our partners at XB Velocity and using HP servers and storage. http://blogs.technet.com/b/virtualization/archive/2010/05/06/mms-2010-labs-powered-by-hyper-v-system-center-hp.aspx . In previous years, the MMS Labs were all delivered using physical servers. To say moving from physical to virtual was a huge success would be an understatement. Here are a few apposite stats comparing MMS 2009 to MMS 2010 last year:
Power reduction of 13.9x on the servers:
-
MMS 2009: 570 servers * 200 watts per server = 114,000 watts
-
MMS 2010: 41 servers * 200 watts per server = 8,200 watts
Power reduction of 6.3x on the clients:
-
MMS 2009: Rich clients: 650 clients * 120 watts per client = 78,000 watts
-
MMS 2010: Thin clients: 650 clients * 19 watts per client = 12,350 watts
Finally, a total of 40,000 VMs were delivered over the course of MMS 2010 on 3 racks of servers. (Technically, it was 6 half racks, but since we used full racks this time, I’m calling it 3 racks so we’re making an apples to apples comparison…)
MMS 2010 Labs went so smoothly, that a similar setup was used for TechEd 2010, which performed just as well. After setting the bar so high, the team eagerly took on the challenge of improving on last year with MMS 2011. Specifically,
-
Could we reduce the physical footprint further from 3 racks?
-
Could we reduce power consumption further?
-
Could we reduce the cabling?
-
How would Windows Server 2008 R2 SP1 Dynamic Memory impact the labs?
MMS 2011: Servers
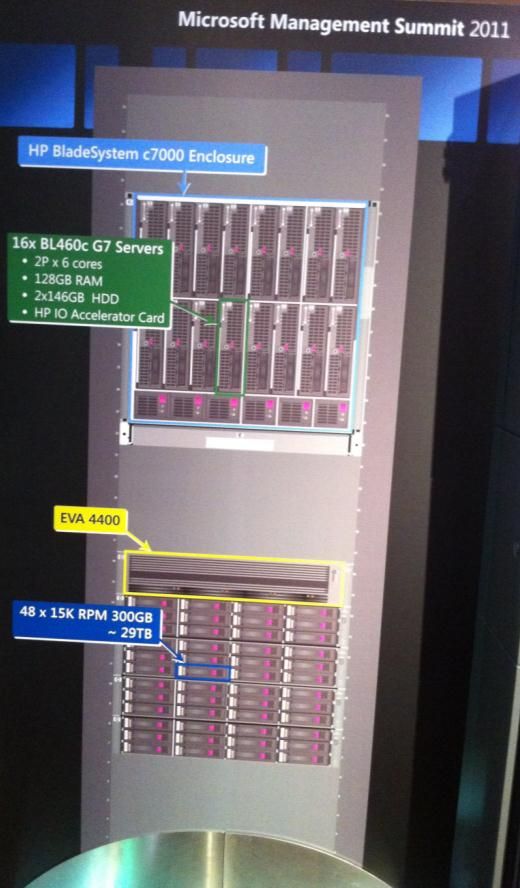
Last year, we used HP ProLiant DL380 G6 Rack Servers. This year we decided to use HP BL460c G7 Blades in a c7000 enclosure. Moving to HP’s BladeSystem allowed us to:
-
Pack in more servers in less space with greater core counts and symmetric multi-threading
-
Take advantage of HP Flex-Fabric and Virtual Connect for flexible networking and simplify cabling
From a memory standpoint, each blade was populated with 128 GB of memory the same as in each rack server last year. However, since we were using fewer servers this year (32 this year versus 41 last year) the total memory was reduced by over 1 Terabyte . At the same time, we delivered more labs running more virtual machines than ever.
>> By using Windows Server 2008 R2 SP1 Dynamic Memory, we were able to reduce the physical memory footprint by over 1 Terabyte and still deliver more labs running more virtual machines than ever. That’s a saving of ~$80,000. <<
Hyper-V Dynamic Memory rocks!
By making these changes, the team reduced the number of racks from 3 to 2. Here’s the side-by-side comparison of MMS 2010 versus MMS 2011 from a server standpoint:

You can see that across the board and in every possible metric, the MMS 2011 servers are a significant improvement over last year. The systems are more powerful, offer greater scalability, improved performance, reduced power consumption, and fewer cables to manage; and they reduced the physical footprint by a third.
MMS 2011: Storage
Last year the team used local disks in every server. This year, they decided to change their storage strategy. Here’s what they did.
-
Each blade was configured with two local disks (RAID1) for booting Windows Server 2008 R2 SP1 Hyper-V.
-
Each blade included a 320 GB HP I/O Accelerator Mezzanine Card. Differencing disks for all the running virtual machines resided on the I/O Accelerator Card. This provided a drastic improvement in IOPS.
-
Each card delivers over 145,000 IOPS
-
Read: 750 MB/s; Write: 550 MB/s
-
-
Employed an EVA 4400 Fiber Channel SAN populated with 48, 15K RPM, 300 GB drives. The SAN housed the VHDs for all the labs.
This new storage strategy resulted in massive improvements. Using the HP I/O Accelerator Cards, total IOPS performance improved by ~23,600% (no, that’s not a typo) and using the SAN allowed the team to centrally manage and share master virtual machines; every blade was a target for every lab from every seat at MMS. This strategy provided an unprecedented amount of flexibility. If we needed an extra 20 Configuration Manager labs from 1:00-2:00 and then needed to switch those to Virtual Machine Manager labs from 2:00-3:00 or Operations Manager labs from 3:00-4:00 we could. That is the flexibility of private cloud.
Here’s the side-by-side comparison of MMS 2010 versus MMS 2011 from a storage standpoint:

The results were simply jaw-dropping.
>> On two racks of servers, we were able to provision 1600 VMs in three minutes or about 530 VMs per minute. <<
MMS 2011: Time for the Diagrams and Pictures
Here’s a picture of the two racks powering all of the MMS 2011 Labs. You can see them behind the Plexiglas. What you don’t see are the crowds gathered around pointing, snapping pictures, and gazing longingly…

Here’s a diagram of the rack with the front of the rack on the left and the back of the rack on the right. The blue lines are network cables and orange lines are fiber channel. Remember, last year we had 82 network cables; this year a total of 12 cables, 8 for Ethernet and 4 for Fiber Channel.

MMS 2011: Management with System Center . Naturally, the MMS team used System Center to manage all the labs, specifically Operations Manager, Virtual Machine Manager, Configuration Manager, and Service Manager.
Operations Manager 2012 Pre-Release was used to monitor the health and performance of all the Hyper-V labs running Windows and Linux. To monitor health proactively, we used the ProLiant and BladeSystem Management Packs for System Center Operations Manager. The HP Management Packs expose the native management capabilities through Operations Manager such as:
-
Monitor, view, and get alerts for HP servers and blade enclosures
-
Directly launch iLO Advanced or SMH for remote management
-
Graphical View
It looks like this:

-
Virtual Machine Manager 2008 R2 was used to provision and manage the entire virtualized lab delivery infrastructure and monitor and report on all the virtual machines in the system. It should go without saying that to support a lab of this scale and with only a few minutes between the end of one lab and the beginning of the next, automation is a key precept. (In case you’re wondering, there wasn’t enough time to use the VMM 2012 Beta…)
-
Configuration Manager 2007 R2 was to ensure that all of the host systems were configured in a uniform, consistent manner via Desired Configuration Management (DCM)
In terms of hardware, System Center had its own dedicated hardware. System Center was deployed in virtual machines on a Hyper-V three-node cluster for HA and Live Migration if needed. (It wasn’t.) Networking was 1 Gb/E and teamed for redundancy. For storage, iSCSI over 1 Gb/E was used with multi-path I/O and the SAN was provided by the HP Virtual SAN Appliance (VSA) running within a Hyper-V virtual machine.
MMS 2011: More Data
Here’s more data…
-
Over the course of the week, ~40,000 virtual machines were provisioned. This is the same as last year. However, it was done using 9 fewer servers (21%) and over 1 Terabyte less RAM.
-
Average CPU Utilization across the entire pool of servers during labs hovered around 15%. Peaks were recorded a few times at ~20%. In short, even with thousands of Hyper-V VMs running, we were barely taxing this well architected and balanced system.
-
While each blade was populated with 128 GB, they weren’t maxed. Each blade can take up to 384 GB.
-
Disk queues for each of the hosts largely remained at 1.0. When 1600 VMs were deployed simultaneously, the disk queue peaked at 1.7. (No, that’s not a typo.)
-
The HP I/O Accelerator used was the 320 GB version. We didn’t use the 640 GB version.
-
All I/O was configured for HA and redundancy. Network adapters were teamed and Fiber Channel was configured with Active-Active multi-path I/O. None of it was needed, but it was all configured, tested and working perfectly.
-
In terms of storage capacity, the SAN had 29 TB of raw capacity; only 64% was used.
-
In terms of client access, we used the same 650 thin clients that were used last year. No change there.
-
The EVA 4400 has an embedded switch so additional FC switches weren’t needed.
Hyper-V Mosaic
One cool application that the Lab team wrote is called Hyper-V Mosaic. Hyper-V Mosaic is a simple application that displays thumbnails of all running virtual machines. The screenshot below was taken at 2 PM Wed March 23. At the time, 1154 VMs were running on the 32 Hyper-V servers. The mosaic display is intended to provide the attendees with a sense of scaling of the Private Cloud solution. All of the thumbnails are live and updating. (More on Hyper-V Mosaic below…)
Here’s a screenshot:

MMS 2011: Let’s Take this to 11
After a few days of running thousands of VMs in hundreds labs without issue and seeing that the hardware wasn’t being taxed, the team was very curious to see how just how many virtual machines they could provision. So, one night after the labs were closed the team decided to see how many VMs they could run…
-
7,200 VMs running across 32 blade servers
-
225 VMs running per Hyper-V host where each host has 128 GB of physical memory. Here’s an example of where Hyper-V Dynamic Memory improved density by over 100%.
Here’s a screen shot from PerfMon:

MMS: Physical Footprint Over the Years…
In terms of physical footprint, the team was allocated 500 sq. feet for MMS 2011 Labs and needed only 17 sq. feet . Here’s how the footprint has dropped in the last three years:

MMS 2011: Success!
As you can see that across the board and in every possible metric, the MMS 2011 system was a significant improvement over last year. It’s more powerful, offers greater scalability, improved performance, reduced power consumption, fewer cables to manage and used a third less physical footprint.
From a Windows Server Hyper-V standpoint, Hyper-V has been in the market three years and this is just another example of how rock-solid, robust and scalable it performs. Hyper-V Dynamic Memory was a huge win for a variety of reasons:
-
Greatly improved density
-
Saved ~$80,000 by using 1 Terabyte less memory
-
Consistent performance and scaling without any performance cliffs making it easy to manage
From a management perspective, System Center was the heart of the system providing health monitoring, ensuring consistent hardware configuration and providing the automation that makes a lab this complex successful. At its busiest, over 2600 virtual machines had to be provisioned in less than 10 minutes. You simply can’t work at this scale without automation.
From a hardware standpoint, the HP BladeSystem Matrix is simply exceptional. We didn’t fully max out the system in terms of logical processors, memory, I/O Acceleration and even at peak load running 2000+ virtual machines, we weren’t taxing the system. Not even close. Furthermore, the fact that HP integrates with Operations Manager, Configuration Manager and Virtual Machine Manager provides incredible cohesion between systems management and hardware. If you’re looking for a private cloud solution, be sure to give the HP Cloud Foundation for Hyper-V a serious look.
http://bit.ly/dYjN79
where Scott Farrand, VP of Platform Software for HP, talks about how real HP and Microsoft are making private cloud computing.
Finally, I’d like to thank our MMS 2010 Platinum sponsor, HP, for their exceptional hardware and support. The HP team was extremely helpful and busy answering questions from onlookers at the lab all week. I have no idea how we’re going to top this.
Jeff Woolsey
Group Program Manager, Virtualization
Windows Server & Cloud
P.S. More pictures below…
Here’s a close up of one of the racks:

HP knew there was going to be a lot of interest, so they created full size cardboard replicas diagraming the hardware in use. Here’s the front:
…and here’s the back…

During the show, there was a huge display (made up of a 3x3 grid of LCDs). This display was located at the top of the elevator going from the first to the second floor at the Mandalay Bay Convention Center. Throughout the week it was used for messaging and hot items of the day. On the last day, the event switched the big display screen at the top of the elevator over to show the Hyper-V Mosaic display. This turned out to be a huge hit. People came up the elevator, stopped, stared and took pictures of the display screen. The only problem is that we inadvertently created a traffic jam at the top of the elevators. Here’s the picture:
