Quite a few customers have reached out to us with this question, and you can even see a few posts around this on the http://social.technet.microsoft.com/Forums/windowsserver/en-US/home?forum=winserverhyperv . The query comes in various forms:
- “My log file size was in the MBs and sometime at night it went into the GBs – what happened?”
- “I have huge amounts of data to sync across once a day when no data is being changed in the guest”
- “The size of the log file (the .hrl) is growing 10X…”
The problem here is not just the exponential increase in the .hrl file size, but also the fact that the network impact of this churn was not accounted for during the planning stages of the datacenter fabric. Thus there isn't adequate network between the primary and the replica to transfer the huge log files being generated.
As a first step, the question that customers want answered is: What is causing this churn inside the guest?
Step 1: Isolate the high-churning processes
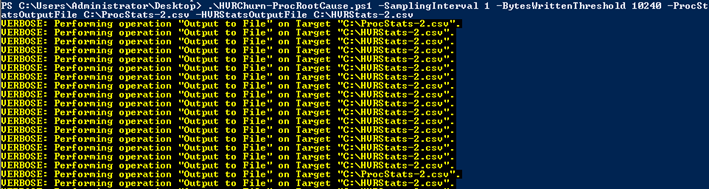
Download the script from here: http://gallery.technet.microsoft.com/Hyper-V-Replica-Identify-f09763b6 , and copy the script into the virtual machine. The script collects information about the writes done by various processes and writes log files with this data.
I started the debugging process using the script on SQL Server virtual machine of my own. I copied the script into the VM and ran it in an elevated PowerShell window. You might run into PowerShell script execution policy restrictions, and you might need to set the execution policy to Unrestricted ( http://technet.microsoft.com/en-us/library/ee176961.aspx ).
At the same time, I was monitoring the VM using Perfmon from the host and checking to see if there is any burst of disk activity seen. The blue line in the Perfmon graph is something I was not expecting to see, and it is significantly higher than the rest of the data – the scale for the blue line is 10X that of the red and green lines. (Side note: I was also monitoring the writes from within the guest using Perfmon… to see if there was any mismatch. As you can see from the screenshot below, the two performance monitors are rather in sync :))

At this point, I have no clue what in the guest is causing this sort of churn to show up. Fortunately I have the script collecting data inside the guest that I will use for further analysis.
Pull out the two files from the guest VM for analysis in Excel – ProcStats-2.csv and HVRStats-2.csv . Before starting the analysis, one additional bit of Excel manipulation that I added was to include a column called Hour-Minute : it pulls out only the hour and minute from the timestamp (ignoring the seconds) and is used in the PivotTable analysis as a field. I use the following formula in the cell: =TIME(HOUR(A2), MINUTE(A2), 0) where A2 is the timestamp cell for that row. Copy it down and it’ll adjust the formula appropriately.

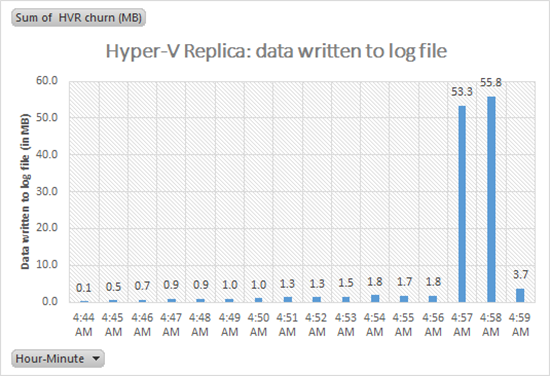
Overall write statistics (HVR Stats)
Let’s first look at the file HVRStats-2.csv in Excel. Use the data to create a PivotTable and a PivotChart – this gives a summarized view of the writes happening. What we see is that there is excessive data that gets written at 4:57 AM and 4:58 AM. This is more than 30X of the data written otherwise.
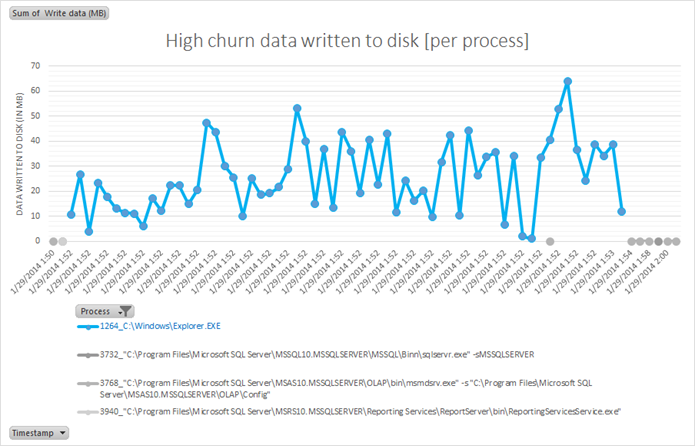
Now let’s look at ProcStats-2.csv in Excel. Use the data to create a PivotTable and PivotChart – and this should give us a per-process view of what is happening. With the per-process information, we can easily plot the data written by each process and identify the culprit. In this case, SQL Server itself caused a spike in the data written (highlighted in red)

This is what the graph looks like for a large data copy operation (~1.5 GB). There is a burst of writes between 1:52PM and 1:53PM in Explorer.exe – and this corresponds to the copy operation that was initiated.
At this point, you should be able to differentiate between the following process classes using the process name and PID:
- Primary guest workload (eg: SQL Server)
- Windows inbox processes (eg: page file, file copy, defragment, search indexer…)
- Other/3rd party processes (eg: backup agent, anti-virus…)
Step 2: Which files are being modified?
Isolating the file sometimes helps in identifying the underlying operation. Once you know which process is causing the churn and at approximately what time, we can use the inbox tool Resource Monitor (resmon.exe) to track the Disk Activity. We can filter to show the details of the processes that we want in the Resource Monitor.
From the previous step you will get the details of the process causing the churn – for example, System (PID 4). Using the Resource Monitor you would find that the file being modified – for example, the file is identified as C:\pagefile.sys . This would lead you to the conclusion that it is the pagefile that is being churned.

Alternative tools:
- Process Monitor: http://technet.microsoft.com/en-us/sysinternals/bb896645.aspx
-
Windows Performance Recorder and Windows Performance Analyzer:
- http://msdn.microsoft.com/en-us/library/windows/hardware/hh448205.aspx
- http://msdn.microsoft.com/en-us/library/windows/hardware/hh448170.aspx