Dear Users,
This blog explains how to get the most of Web Application Availability Monitoring in SCOM 2012. This Monitoring allows you to observe the health of web application end points using your watcher nodes. End points which you can monitor could be URLs of a website, or methods of a web service. The web applications that you monitor can be internal, which are available only to your watcher nodes via intranet, or you could also monitor externally-facing end points.
Configuration details
The Web Application Availability Monitoring provides a rich set of options to monitor URL end-points. For example, it allows you to specify three different HTTP methods: GET, HEAD, and POST. For the POST method you could include POST body. You can also add and modify HTTP headers, to configure the request in a way which is expected by your application. For detailed walk-through on how to configure Web Application Availability Monitoring, please refer to the following article: http://technet.microsoft.com/en-us/library/hh881883 .
Monitoring health and detecting specific errors
Please note that you may configure monitoring of multiple end points for the same application. The health state of these end-points will be rolled up to provide an overall application health state. In the screen shot below end-points Home and WebConsole roll up to the health state of MSW application.

From these views, you can use Health Explorer view to drill down and find out exactly which end point and which criteria were broken. Health Explorer allows viewing all the end points which contribute to the application health. If you look at the state change events for the failing end point, you can see detailed reasons for the failure.
For example, for the test below, you can see that the end-point Home has failed due to invalid HTTP status returned by the page: Status Code Evaluation shows Error.

Drilling into Base Page Result Details allows you see the exact status code returned: 401, Unauthorized. If other criteria of application availability failed, you would be also notified. For example, SCOM 2012 also allows you to specify criteria around response time and presence of a particular string in the response body.

The same level of details about failure is available in the alert context, if you set up to receive alerts for the failed tests:

This information is great to send back to the development team.
Visualizations of application health using dashboards
SCOM 2012 provides two visualization experiences directly related to the Web Application Availability: Summary (Map) dashboard and Detailed dashboard.
Detailed dashboard allows you to view temporal graphs of the collected perf counters: this view is very useful for the technical members of your team. For each test, you can also use SCOM reports to generate an in-depth view of perf counters behavior, which would include statistical information, such as standard deviation, number of samples, etc.

If your watcher nodes are located in different geographies, you could use a convenient Summary (Map) Dashboard to see how your application behaves from a geo-distributed perspective. Location of your watcher nodes with respect to the location of your application will determine the perspective of the application health. If the watcher nodes and the application are located in the same datacenter, you will be observing first-mile perspective. If, on the other hand, you watcher nodes are located in different datacenters from where your application is hosted, you will be observing mid-mile perspective.
In order for watcher node locations to appear on the Summary (Map) dashboard, you need to configure longitude and latitude for each location.
Making your watchers appear in the dashboards
To make your watcher nodes (agents) show up in the dashboards, SCOM 2012 provides a set of Powershell cmdlets. These cmdlets allow you to create and remove locations that show up on the map, based on latitude and longitude coordinates. There are also cmdlets that allow you to associate your watchers with those locations. Watcher health will then roll up to that location.
Note that only health of tests created using the Web Application Availability Monitoring template will be displayed on the Map dashboard. Note also that there is an instance of the dashboards per application, i.e. each “run” of the Web Application Availability wizard creates an instance of the Map dashboard. Only the tests from that “run” of the wizard will roll up to health state of each location.
First, from an Operations Manager Shell, create a location using the New-SCOMLocation cmdlet.
New-SCOMLocation –DisplayName “Seattle, WA” –Latitude 47.6063889 –Longitude -122.330833
Then, associate your watcher with the location
$Location = Get-SCOMLocation -DisplayName “Seattle, WA”
$Agent = Get-SCOMAgent –Name “myserver.Contoso.com”
Set-SCOMLocation –Location $Location –Agent $Agent
Note that it may take some time (30-60 minutes) for the map to display this information. Essentially what has to happen in the background is that a couple of discoveries have to run to associate the watcher with the right template instance, as well as with the right location.
You can then use the Get-SCOMLocation cmdlet to see that the agent is associated with the correct location.
You can also use the Remove-SCOMLocation cmdlet to remove an agent from a location.
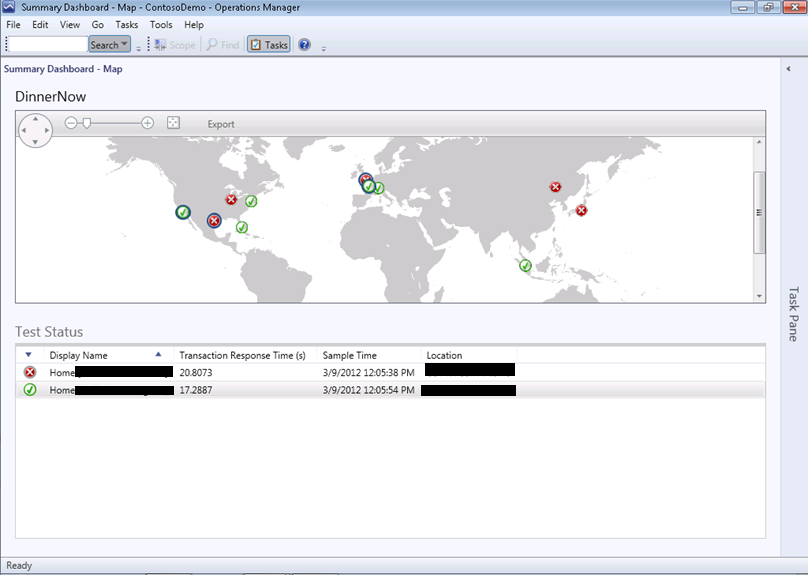
Viewing health in the Summary (Map) dashboard
The Summary (Map) view is great for observing high-level aspects of the application health. The Map view allows you to select locations and view response time from each location, as well as the last time when the test was run. You can select multiple locations by holding down Ctrl key and clicking on locations.
Creating Service Level Objectives for your tests
All the data received from the Web Application Availability Monitoring can be used to build SLA dashboards. You could set up SLO criteria for the response time (or criteria for any other performance counter returned) and visualize compliance of your application.
Let’s setup Service Level Objectives for the tests, and utilize the SLA dashboard. In the end, your dashboard will look something like the below.

In this case, we have created a response time SLA for the MSW application, and are comparing actual response times from each watcher node, to a goal of 1 second. To create such a dashboard, first you need to create an SLA for the transaction response time. In the authoring section of the console, go to Service Level Tracking, and create a new SLA.

Next, select the Multi-URL template class instance for MSW (this is the name provided in the Web Application Availability wizard).

Now, let’s create a response time SLO.
For the target class, select the Web Application Availability Monitoring Test class. For the rule, select the Web Application Availability Monitoring Performance Transaction Response Time Collection (System) rule. Compare the average response time performance counter against a goal of 1 second.

SLA is created! Finish.

Creating an SLA dashboard
Now that SLA is ready, we can create a dashboard visualizing SLA compliance. On the Monitoring pane, right click on the top-level Monitoring item, New/Dashboard View. Choose Service Level Dashboard .

Next . Name the dashboard, for example “MSW response time SLA”, Next . Add the SLA which we configured in the previous section:

Ok, Next, Create . Your dashboard is ready! You can publish such a dashboard for viewing by the stakeholders of your application.
Summary
In this post, we have shown how you can use the Web Application Availability Monitoring wizard to configure rich monitoring of your Web Applications from a first mile or mid-mile perspective. We demonstrated how you can use the provided dashboards to visualize application status, how you can track SLAs using SLA dashboards, and finally how you can use the rich alert context to determine specific causes for errors in your application.
We hope that you will find this post and the capabilities we described here valuable, and we are looking forward to your feedback!