My CPS stamp just arrived and I can’t wait for my customers to begin spinning up their own VMs! But once CPS is up in my datacenter and I start running customer workloads how do I know if the fabric of my cloud is healthy? How do I know if there are issues I need to resolve to ensure customer workloads keep running?
In order to efficiently manage a private cloud, CPS administrators need visibility into the health of the compute, network, and storage systems supporting their cloud and the ability to understand when failures occur which tenant workloads are impacted. In CPS we utilize System Center Operations Manager 2012 R2 to monitor all the technologies and devices that support the fabric.
System Center Operations Manager is a monitoring infrastructure used by many enterprises and hosting service providers to monitor their datacenter server and network hardware, infrastructure software, and applications. They are able to customize their monitoring by importing Operations Manager Management Packs from Microsoft and Microsoft partners which add specific monitoring capabilities as well as by creating custom management packs to either tune existing monitors or add custom monitors and visualizations. Since we are focused on delivering a complete solution with CPS, we wanted to ensure that the monitor solution is tuned and validated specifically for CPS.

The monitoring infrastructure
The SC Operations Manager implementation in CPS is installed on VMs hosted by the Management Cluster and leverages a shared SQL Server Cluster database instance for the Operations Manager Database and Data Warehouse. SC Operations Manager agents are installed on all physical hosts in the stamp as well as all VMs used to manage the stamp including Management Cluster VMs, Windows Azure Pack VMs hosted on the Computer Cluster, Edge Cluster VMs, as well as all tenant Data Protection Manager VMs used to backup tenant workloads. In addition to the SC Operations Manager agent the Dell Open Manage Server Administrator agent is installed on all physical hosts to support monitoring of the compute and storage host hardware.

For more details on the solution please visit the following Channel 9 Videos and CPS announcement blog post on Technet
Announcing the Cloud Platform System (CPS)
Introducing the NEW Microsoft Cloud Platform System
Unveiling The Microsoft Cloud Platform System, powered by Dell
The monitoring experience
Once we had SC Operations Manager installed in CPS the next challenge was testing the monitoring experience. Our approach to the monitoring experience followed these principles:
- SCOM Alerts in CPS should be actionable
- Eliminate noisy alerts whenever possible
- Solution health and alerts should be visible through a single UI experience
- All monitoring functionality should be available to CPS and non-CPS customers (no new monitors specific to CPS)
This effort was the first time integrated testing of all these management packs has occurred at scale, in a private cloud environment. The testing performed included fault injection as well as normal operation monitoring. What did we discover?
Many Management packs are noisy!
As some SC Operations Manager customers experience, the default settings for many management packs can result in a large volume of alerts which can be challenging to scrub through to determine if there’s an issue that needs to be resolved.
Determining the health of the CPS system wasn’t trivial using existing state views
Which folder and view was the right view to understand if the system was healthy? Navigating between many different technology focused health state views was confusing as there was no way to understand if the entire CPS system was healthy.
Based on our initial testing we began to tune the monitoring experience. This is usually done by the end customer through the use of overrides to disable monitors or alerts which aren’t desired and by creating custom dashboards to visualize health and alerts in an aggregated fashion. In our tuning of CPS monitoring we did make use of some overrides to disable several monitors but also found and fixed issues with product MPs, the combination of these actions reduced the amount of noisy alerts and improved health state accuracy. These MP improvements can be found in CPS as well updates to MPs for existing Operations Manager customers. The end result of our tuning is that a high percentage of alerts in CPS are actionable and represent issues that should be investigated and resolved to ensure the CPS system health is maintained.
The overrides and MP fixes improved the validity of alerts and health states in CPS, but to improve the experience of administrators trying to understand if CPS is healthy custom views or dashboards are necessary. To provide the fabric administrator with central locations to view health and alerts important to CPS we developed a series of CPS Dashboards:
- CPS System Health
- Edge Cluster Dashboard
- Management Cluster Dashboard
- Storage Cluster Dashboard
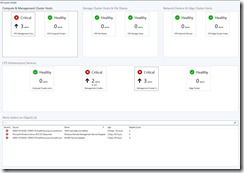
CPS System Health
The CPS System Health Dashboard is the single pane which CPS administrators can view to understand if high level fabric components are healthy or unhealthy and how many alerts may be active for a given area. Selecting an object in the dashboard displays the active alerts associated with the component. Additionally the CPS admin can drill into additional views through navigation links associated with each of the objects below for more granular health details.
Edge Cluster Dashboard
The Edge Cluster Dashboard displays the health of the software components responsible for managing tenant connections to the cloud, the health of the Windows VMs and hosts supporting those services, and any active critical alerts.

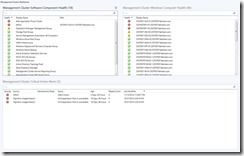
Management Cluster Dashboard
The Management Cluster Dashboard displays the health of the software components that CPS relies on to manage the cloud fabric, the health of the Windows VMs and hosts that support those services, and any active critical alerts.
Storage Health Dashboard
The Storage Health Dashboard displays the health of File Shares, Storage Pools, and the Storage Node hosts along with any active alerts. It also provides the current free space and total capacity of all file shares in CPS.

In addition to these customer dashboards CPS ships with several dashboards already available to non-CPS customers to help understand the health of the fabric and the VMs it supports. These dashboards are the VMM Fabric Dashboard , and the new Virtual Machine Manager Host and Virtual Machine Dashboards. Using the new Virtual Machine Manager Host and Virtual Machine Dashboards an administrator can quickly understand the health of the VMs and the Hyper-V hosts.
Virtual Machine Dashboard
Quickly determine if unhealthy VMs exist and on which host, search for VMs on any property including tenant to understand if there are tenant wide issues with VMs or if there is an isolated case.

VMM Host Dashboard
Understand the health and key metrics associated with each Hyper-V host in your cloud. Select a host and see the health of VMs hosted by the selected host.

Dell Managed Servers State View
The Dell Management Pack Suite used in CPS provides monitoring and visualization of the health of each of the hosts in CPS including the memory, processors, and sensors.

Dell Monolithic Servers Diagram View
Using the diagram view CPS Administrators can drill down to a particular host and understand the health of all monitored components.

Extended Monitoring using Azure Operational Insights
In addition to our efforts with SC Operations Manager and all the Management Packs for CPS we’re enabling a subscription to Azure Operational Insights ( https://preview.opinsights.azure.com/ ) by default with every CPS install. Azure Operational Insights is a cloud based solution that offers Log Management, Change Tracking, Capacity Planning, and Update Assessment functionality to customers through integration with SC Operations Manager or directly through the Microsoft Management Agent. Using Azure Operational Insights CPS customers can enable Intelligence Packs such as Capacity Planning to understand how their CPS stamp is utilized and whether they need to start planning to expand their capacity.
We’ve spent a great deal of effort tuning the monitoring solution for CPS and providing views to display the health and alerts specific to the fabric. We are excited for CPS customers to benefit from our work and to hear their feedback to keep improving our solution.
CPS Monitoring Team