So you’ve deployed the data warehouse and tried out the reports but now you want to want to make it your own. You may be trying to recreate some reports you’ve been using forever and now need to run them against the Service Manager platform, or perhaps you simply want to take full advantage of the customizations you’re doing in the Incident or Change Management solutions and want those changes to flow through to the reports. Either way, if you’re stumped on how to proceed our latest posts from the Platform team will help you extend and customize the Data Warehouse to enable the in-depth analyses you’re aiming for.
Danny Chen, one of the Developers on our common Platform team, did a great job writing up how to create fact tables, dimensions and outriggers. If you’re not familiar with data warehousing principles, I’ll provide some clarity as to what these terms mean and how they apply to Service Manager below. If you understand the principles well enough and are chomping at the bit to dig into the details, here are the links:
1. http://blogs.msdn.com/scplat/archive/2010/03/29/a-deep-dive-on-creating-relationship-facts-in-the-data-warehouse.aspx
2. http://blogs.msdn.com/scplat/archive/2010/03/29/a-deep-dive-on-creating-outriggers-and-dimensions-in-the-data-warehouse.aspx
Principles behind the Platform: Dimensional modeling and the star schema
The data warehouse is a set of databases and processes to populate those databases automatically. At a high level, the end goal is to populate the data mart where users will run reports and perform analyses to help them manage their business. We keep this data around longer in the warehouse than in the CMDB because it’s usefulness for trending and analysis generally outlives it’s usefulness for normal transactional processing needs.
A data warehouse is optimized for aggregating and analyzing a lot of data at once in a lot of different, unpredictable ways. This differs from transactional processing systems which are optimized for write access on few records in any given transaction , and those transactions are more predictable in behavior.
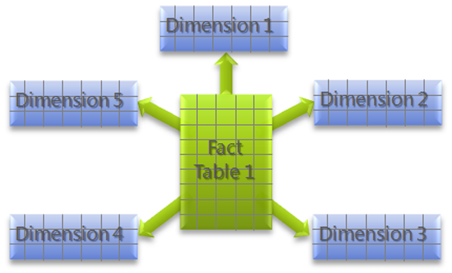
To optimize the data warehouse for performance and ease of use, we use the http://en.wikipedia.org/wiki/Dimensional_modeling . What this means to you is that tables in the DWDataMart database are logically grouped into subject matter areas which resemble a star when laid out in a diagram, so these groupings are often called “star schemas”.
- In the center of the star is a Fact table. Fact tables represent relationships, measures & key performance indicators. They are normally long and skinny as they have relatively few columns but contain a large number of transactions.
- The fact table joins to Dimension tables, which represent classes, properties & enumerations. Dimension tables usually contain far fewer rows than fact tables but are wider as they have the interesting attributes by which users slice and dice reports (ie status, classifications, date attributes of a class like Created Date or Resolved Date, etc).
- An outrigger is a special kind of dimension table which hangs off another dimension table for performance and/or usability reasons.
Generalized representation of a star schema:
Consider what a star schema for a local coffee shop might look like. The transactions are the coffee purchases themselves, whereas the dimensions might include:
- Date dimension (to rollup the transaction by both gregorian and fiscal calendars)
- Customer dimension (bought the coffee)
- Employee dimension (made the coffee)
- Product dimension (espresso, drip, latte, breve, etc etc…. and this could get quite complicated if you track the details of Seattleites drink orders)
- Store dimension
- And more
What measures might the fact table have? You could easily imagine:
- Quantity sold
- Price per Unit
- Total Sales
- Total Discounts
- etc
IT processes aren’t so different from the local coffee shop when it comes time to designing your dimensional model. There are a set of transactions which happen, like incident creation/resolution/closure which produce some interesting and useful metrics (time to resolution, resolution target adherence, billable time incurred by analysts, duration in status, etc).
When thinking about extending and customizing your data warehouse, think about the business questions you’d like to be able to answer, read up on http://en.wikipedia.org/wiki/Dimensional_modeling for some tips on best practices, and then check out Danny’s posts on creating http://blogs.technet.com/controlpanel/blogs/A%20Deep%20Dive%20on%20Creating%20Relationship%20Facts%20in%20the%20Data%20Warehouse , http://blogs.msdn.com/scplat/archive/2010/03/29/a-deep-dive-on-creating-outriggers-and-dimensions-in-the-data-warehouse.aspx for the technical know-how.
And of course, we’re always here to help so feel free to send me your questions.