This post is intended to help you get started with the Client-Side Monitoring (CSM) feature in Operations Manager 2012. Client-Side Monitoring provides a real end user perspective on application health for .NET applications, as users are interacting with the application, by collecting performance and exception data from the users browsers in near real time.
I will walk through the necessary steps to enable Client-Side Monitoring as well as ways to interpret and deal with the output of the Client-Side Monitoring compatibility check, which you will run before enabling CSM.
Importing the required Management Packs & Installing the Operations Manager Agent
As described in more detail here , you first need to install the Operations Manager Agent on the servers you want to monitor, and import the required Management Packs (the Windows Server Operating System Management Pack, as well as the IIS 7 and/or IIS 8 Management Packs, then the Microsoft.SystemCenter.Apm.Web.IIS7 and Microsoft.SystemCenter.Apm.Web.IIS8 Management Packs from the Operations Manager media).
After doing this, your Web Applications will be automatically discovered. Go to the appropriate “inventory” view in the Operations Manager Console, under Application Monitoring\.NET Monitoring
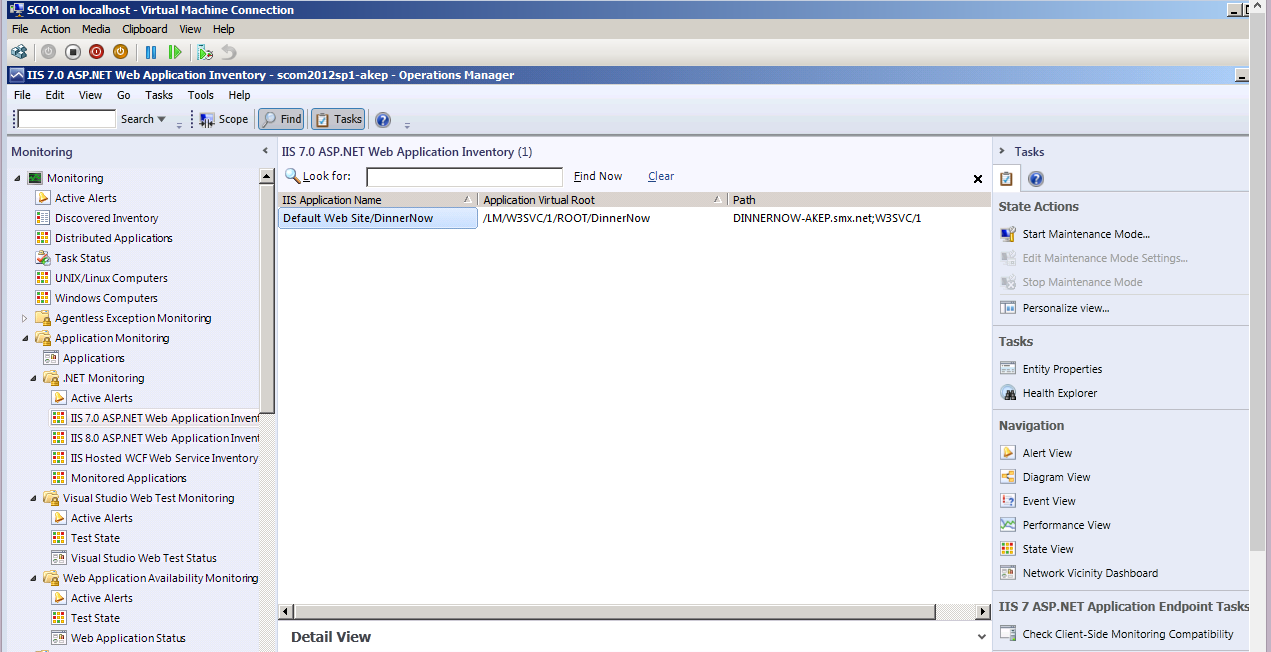
Select the application you are interested in monitoring. Now, you are ready to run the Client-Side Monitoring Compatibility check.
How does CSM collect data?
The Client-Side Monitoring feature works by injecting a JavaScript into the relevant pages of your application (note that it applies to .NET code, static files will not get injected). As users are interacting with the application in the browser, the relevant performance and exception metrics are sent to a Client-Side Monitoring collector and then into the Operations Manager Database and Data Warehouse, and surfaced in the Operations Console as any other monitoring metrics.
The JavaScript is injected automatically into the application once you start monitoring of your application using the .NET Application Performance Monitoring template.
Note that it is not possible to enable only Client-Side Monitoring, the Server-Side monitoring must also be enabled when you run the .NET Application Performance Monitoring template.
The Client-Side Compatibility check
The Client-Side Monitoring Compatibility check ensures that your application is compatible with Client-Side Monitoring, and does not cause any issues (such as the application running slowly) when the JavaScript is injected. It is important that you run this check before enabling Client-Side Monitoring.
Is is very important to do this in a test or pre-prod environment.
Running the Compatibility Check and Interpreting Compatibility check output
To run the Compatibility Check, simply select the application in the Operations Manager Console, then select the “Check Client-Side Monitoring Compatibility” task and run it. Once the task completes, you will see the results in the task status window, along with any issues found and the resources that may be incompatible with Client-Side Monitoring.

Explaining the Client-Side Monitoring compatibility rules
The compatibility check is an Operations Manager task that runs on the server(s) that host your application and checks your application compatibility by examining the binaries and pages that make up the application. If possible incompatibilities are found, the affected resources will be listed in the compatibility check output.
There are 7 compatibility rules that are checked against your application. Here is a short explanation of each rule and the appropriate mitigations for each.
Web Page contains VBScript code
As explained above, Client-Side Monitoring uses JavaScript code, there are a few issues that could present itself when using pages with mixed scripting languages.
The recommended solution for this issue is to exclude the identified pages from monitoring. See section “excluding pages from monitoring” in this post.
Note that the application may still work even if you do not exclude the pages from monitoring. See section “What if I have incompatibilities that I cannot change or do not want to change in my application?”
Webpage uses an ASP.NET substitution control
The Client-Side Monitoring feature uses the Response.Filter property to monitor pages. If the application web page contains the ASP.NET substitution control, changing the Response.Filter property is prohibited.
The recommended solution for this issue is to exclude the identified pages from monitoring. See section “excluding pages from monitoring” in this post.
Webpage contains calls to the HttpWebResponse.Flush() method
Client-Side Monitoring uses the Response.Filter property for monitoring purposes. If your application code calls Response.Flush(), this could lead to incorrect responses returned to the browser. This is a warning of a possible compatibility issue, and the recommended solution is to change your application code.
Note that the application may still work even if you do not update your code. See section “What if I have incompatibilities that I cannot change or do not want to change in my application?”
Webpage contains calls to the HttpWebResponse.End() method
Client-Side Monitoring uses the Response.Filter property for monitoring purposes. If your application code calls Response.Flush(), this could lead to incorrect responses returned to the browser. This is a warning of a possible compatibility issue, and the recommended solution is to change your application code.
Note that the application may still work even if you do not update your code. See section “What if I have incompatibilities that I cannot change or do not want to change in my application?”
Client scripting code overrides standard objects or functions
If standard objects or functions are overridden, this may cause incompatibilities with Client-Side Monitoring. This is a warning of a possible compatibility issue.
There are 2 recommended solutions for this issue
- Exclude the identified pages from monitoring. See section “excluding pages from monitoring” in this post.
- Manually check application compatibility for the identified pages by following the steps in section “What if I have incompatibilities that I cannot change or do not want to change in my application?”
Webpage contains an instruction for changing the compatibility view
This meta tag is expected to be the first on the page right after the <!Doctype> and <html> tags. In client-side monitoring, the tag becomes positioned after the client-side monitoring injected code, so the page rendering process might run incorrectly (might slow-down the loading or have other effects).
This is a warning of a possible incompatibility, most commonly affecting the performance of your application. The recommended solution is to change your code, or exclude these pages from monitoring.
Note that the application may still work even if you do not exclude the pages. See section “What if I have incompatibilities that I cannot change or do not want to change in my application?”
Webpage contains an instruction for changing character sets
This meta tag is expected to be the first on the page right after the <!Doctype> and <html> tags. In client-side monitoring, the tag becomes positioned after the client-side monitoring injected code, so the page rendering process might run incorrectly (might slow-down the loading or have other effects).
This is a warning of a possible incompatibility, mostly commonly affecting the performance of your application. The recommended solution is to change your code, or exclude these pages from monitoring.
Note that the application may still work even if you do not exclude the pages. See section “What if I have incompatibilities that I cannot change or do not want to change in my application?”
What if I have incompatibilities that I cannot change or do not want to change in my application?
So what if I have compatibility issues in my application that I can’t do anything about? Is everything lost? No, it is still possible that Client-Side Monitoring will work. This is because the compatibility check identifies possible issues. If you test your application and determine that the application still works with CSM, it is possible to enable Client-Side monitoring.
Install Client-Side Monitoring and your application in a test or pre-production environment and pay special attention to the pages and resources identified by the compatibility check. If the application behaves normally with Client-Side Monitoring enabled, you can use it to track the end user experience.
Here is how you can test this:
- Ensure that Client-Side monitoring for your application is disabled
- Open a single instance of Internet Explorer browser (of 7.0 version or higher)
-
Check/set browser settings (restart of browser required)
- Enable script debugging
- Enable notifications about every script error
- Navigate to the page(s) you want to validate, wait for it to load
-
Check if there are no errors on the page
- If there are errors, note this fact for step 8
- Enable Client-Side Monitoring (see section “Enabling Client-Side Monitoring”)
- Navigate to the page, wait for it to load
-
Check if there are errors appearing on the page
- The page is COMPATIBLE with Client-Side Monitoring if performance is acceptable (if you are testing for performance)
- The page is COMPATIBLE with Client-Side Monitoring if there are no (or the same) errors with Client-Side Monitoring disabled, as with Client-Side Monitoring enabled
- The page is INCOMPATIBLE with Client-Side Monitoring if there are additional errors with Client-Side Monitoring enabled
Enabling Client-Side Monitoring
To enable Client-Side Monitoring you need to run the .NET Application Performance Monitoring template. Note that you will need to enable the server-side functionality, it is not possible to only enable client-side functionality.
As you start the wizard and choose the applications that you want to monitor,

also select “enable additional configuration options for server-side and client-side monitoring”.

Select the appropriate thresholds for your application regarding performance and/or exception alerts, the appropriate thresholds. In general, client-side threshold settings should be higher than server-side threshold settings. This is because the client-side monitoring contains the server time, too. For instance, when a client-side event is divided into various parts, some of the time is spent on the server, but the client also monitors the time spent on the network and the time spent in the browser.
Note that for the ip address filter, any IP addresses that fit the filter definitions are excluded from client-side monitoring. This means that if the list is empty, all IP addresses are monitored.

Finally, enable client-side monitoring. This will cause the JavaScript to be injected into your application.

Excluding pages from monitoring
If you want to exclude pages from monitoring, or if the compatibility check recommended that you do this, you can do the following
Edit the monitoring template you created, and go to the Client-Side Monitoring tab. Then click customize.

In the excluded pages section, click add, and add any page you want to exclude. This exclusion works based on identifying transactions and only works for ASP.NET.

Is the JavaScript injected into my app?
To check whether the JavaScript is injected to your application, open a browser and go to one of the application pages that should have been instrumented. In Internet Explorer, hit F12 to open developer tools. If it is instrumented with Client-Side Monitoring, you will see something similar to this at the top of the page:

Now as users are interacting with the application, you should be able to start to see data appearing in the Operations Manager Console.
Let me know if this information is helpful and what other types of information you would like to see for Client-Side Monitoring.