As an Orchestrator user excited to start using Service Management Automation, you’re probably used to monitoring activities from Orchestrator, and are wondering how you can do similar monitoring in SMA. Today I’ll talk about a new runbook you can use as a platform for building monitoring processes – the Start-Monitor runbook.
The Start-Monitor runbook
It’s common to want to continually poll for data, and if that data matches some condition, perform some action based on the data. But it can get complicated to perform the monitoring, to make it reliable in the event of failures, to be sure you don’t miss a piece of data you were monitoring for or accidentally take action on the same data more than once.
The Start-Monitor runbook helps you with this. You can see how to use the Start-Monitor runbook as part of a monitoring process below:
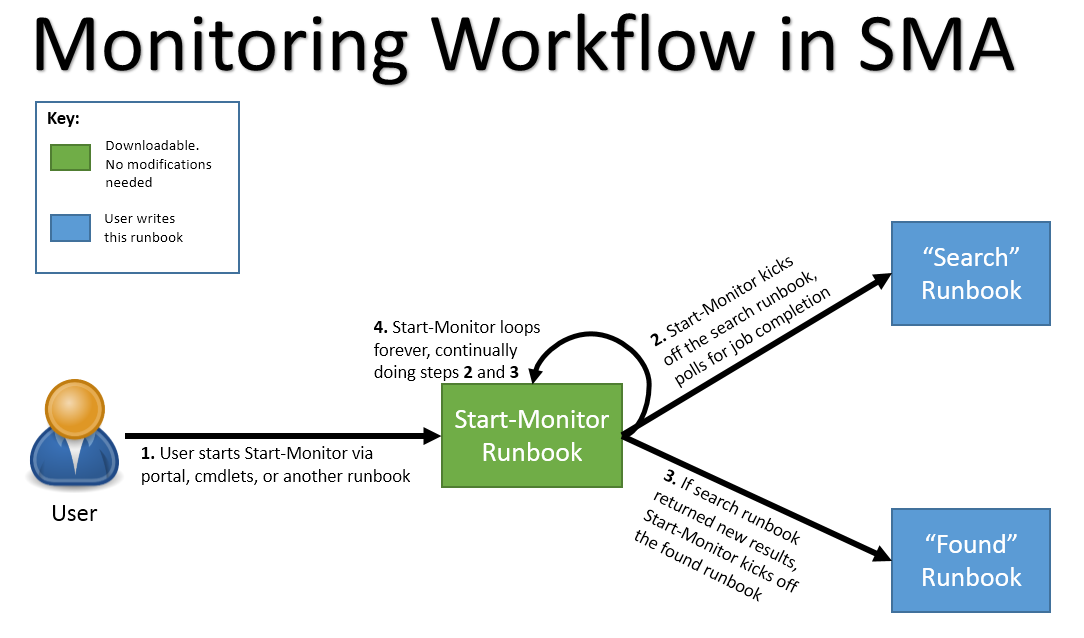
The Start-Monitor runbook can be downloaded from Script Center . For each scenario you want to do monitoring in, you need to write two runbooks – a “search” runbook, and a “found” runbook. The Start-Monitor runbook calls these two runbooks, and contains the logic to properly do monitoring, without containing the specifics of any scenario – the scenario details go in the search and found runbooks.
The Start-Monitor runbook abstracts away the details of monitoring, so that you just have to specify what to look for (with the search runbook) and what to do in response to finding it (with the found runbook). It handles runbook failures by placing checkpoints in the right places, so you can resume the monitor in the case it suspends or crashes due to failure, and it will continue monitoring data from the point in time at which it failed.
Start-Monitor takes a number of parameters to be flexible to your scenario:
-
SearchRunbookName
– the name of the search runbook to call for this scenario
-
SearchRunbookParameters
– any parameters to pass to the search runbook, when it is called
-
FoundRunbookName
- the name of the found runbook to call for this scenario
-
FoundRunbookParameters
– any parameters to pass to the found runbook, when it is called
-
PollingIntervalInSeconds
– the frequency for querying to be performed. In other words, how often the search runbook will be run. Defaults to 60 seconds.
-
SmaConnectionName
– The name of a connection asset of type ‘ServiceManagementAutomation’, used to connect into an SMA instance over Basic auth. This is used to start the search and found runbooks, using the SMA web service.
- SpawnNewMonitorTimeInMinutes – Optional number of minutes that this runbook has been running, after which this instance of the monitor will end and another will start, picking up where the one that just ended left off. This is to prevent this job from running forever and therefore preventing an old sandbox from being cleaned up. You should not generally need to change this value, but should make sure you understand the mechanism.
The way this is implemented is via a one time schedule that Start-Monitor creates and associates itself with. After the amount of time specified in the SpawnNewMonitorTimeInMinutes parameter, this job ends and the schedule fires and starts Start-Monitor again, with the same parameters it was passed the first time it ran for this monitor workflow. That job then creates another one time schedule and associates itself with it, so on and so forth. The schedule name takes the form of:
“ContinueMonitor-< SearchRunbookName >-< FoundRunbookName >-< timestamp >”
The fact that Start-Monitor always creates a schedule means that if you ever want to stop a monitoring workflow, not only do you have to stop the currently executing Start-Monitor job that is running for this monitoring workflow, but you also have to delete the schedule asset for this monitoring workflow. If you do not, when the schedule fires, Start-Monitor will just start again from where it left off.
An SMA variable asset is also used, to specify the time to start searching from, between instances of Start-Monitor in the monitoring workflow. The variable’s name takes the form:
“ContinueMonitor-< SearchRunbookName >-< FoundRunbookName >-FindStartingFromTime”
Because the variable is only unique based on the combination of search runbook and found runbook, make sure that you only ever start a single monitoring workflow for a search runbook / found runbook combination. In other words, if Start-Monitor is already running for search runbook X and found runbook Y, don’t start another instance of Start-Monitor for X and Y without first stopping the existing Start-Monitor job for X and Y (and deleting the generated schedule!)
This parameter defaults to one day.
You should not need to modify the Start-Monitor runbook – it is ready to go out of the box.
The Search Runbook
A search runbook is a runbook designed to find objects matching some user-defined condition, such as new error events in an event log, or new alerts in Operations Manager. Every time the search runbook finds a matching object, it returns the matching object's unique identifier (as a string), or an array of unique identifiers (as a string[]) if multiple matching objects were found. If no match was found nothing should be returned.
The search runbook is called continually by Start-Monitor, and so does not need to loop itself. It just does one point in time check and then it is done. To tell Start-Monitor what search runbook to use, you pass its name as the SearchRunbookName parameter of Start-Monitor.
The search runbook should take two special parameters, named "StartTime" and “EndTime” of type string which will be passed when the search runbook is called by Start-Monitor. The StartTime parameter being passed to the search runbook by Start-Monitor is the datetime after which to look for matching objects, inclusive, as a string. For example, if I were looking for errors in an event log, I would only return errors in the event log that happened after StartTime. While StartTime is passed in as a string, it can be converted back into a datetime object within the search runbook using the PowerShell:
$StartTime = Get-Date $StartTime
Similar to StartTime, the EndTime parameter being passed to the search runbook by Start-Monitor is the datetime before which to look for matching objects, exclusive, as a string.
If the search runbook requires any other parameters, you can pass these parameters via the SearchRunbookParameters parameter of Start-Monitor, and Start-Monitor will pass these parameters when calling the search runbook, in addition to the StartTime and EndTime parameters.
The Found Runbook
A found runbook is a runbook designed to do something for the objects found by the search runbook. To tell Start-Monitor what found runbook to use, you pass its name as the FoundRunbookName parameter of Start-Monitor.
The found runbook should always take a special parameter, named "Ids" of type string[], which will be passed when the found runbook is called by Start-Monitor. The Ids parameter being passed is an array of string unique identifiers to take action on. For example, if they were error event ids in a production system, you might want to send an email to Operations for each one to make sure they are looked at with high priority.
You can perform an action on each unique identifier using the PowerShell:
$Ids | ForEach-Object {
# as an example, just output the id
Write-Output ("The unique id is " + $_)
}
If the found runbook requires any other parameters, you can pass these parameters via the FoundRunbookParameters parameter of Start-Monitor, and Start-Monitor will pass these parameters when calling the found runbook, in addition to the Ids parameter.
An example use of Start-Monitor
Now that you know the different pieces of the Start-Monitor monitoring process, let’s get into examples. Below is an example implementation of the chart shown above, targeting the scenario of monitoring an Operations Manager server for alerts, and then resolving these alerts:

And here’s what it might look like if your scenario was to monitor the event log on a host for new error events, and email a user when a new error event was found:

Unlike my examples above, you’d want to make sure that your runbook names comply with PowerShell command naming conventions , of course!
See how in all cases, the process is the same, it’s just the search and found runbook (and maybe some Start-Monitor parameter values) that change? By following this model you can build monitoring processes to fulfill all of your scenarios, without having to worry about the monitoring part. Just build a runbook to spit out things to take action on, and another runbook to actually go and take an action.
Turns out we’ve actually written the corresponding runbooks for the second scenario above, which you can use as a guide when adding Start-Monitor to your own monitoring processes. It is composed of the four runbooks show in the above diagram:
- Start-Monitor (your friendly neighborhood runbook for building monitoring processes)
- CheckFor-Events (the search runbook)
- Found-Event (the found runbook)
- Sample (the initiator runbook. Kicks off Start-Monitor, passing parameters needed for this scenario)
You can grab this set of runbooks from Script Center .
The Drawbacks
While the Start-Monitor way of creating monitoring processes is great in many ways, the one major drawback is that it kicks off many, many jobs. By default, it will kick off a new job of the search runbook every 60 seconds (technically it kicks off a search runbook 60 seconds after the last search runbook completed, rather than every 60 seconds). As you can imagine, this can really pollute your SMA dashboard.
Here’s my SMA dashboard over the last month, including the day stretch where I ran Start-Monitor to test my monitoring events sample described above. See if you can make out when Start-Monitor was running!

However, most of what the dashboard is used for, in reality, is to see if there are any jobs which need action taken on them, to resolve issues. Turning off the Queued, Completed, and Running legend keys on the dashboard allows you to continue doing this, without having to sift through a ton of search runbook jobs:

While this issue is mostly cosmetic, the other issue you want to look out for is that, because each monitoring process kicks off so many jobs, if you have many different monitoring processes running at once, it is possible you’ll be creating so many jobs in your system that you’ll start to hit perf limits. You probably will be fine with the default polling interval of 60 seconds, but if you have many monitors and speed up the poll to be much more frequent, you could run into issues. If you’re going to have many monitors and a frequent poll interval, and seem to be hitting limits, make sure your system is built for optimum performance. Beth Cooper has a good introduction to SMA perf , if you’re looking to learn more about this topic.
For the above reasons, when you call Start-Monitor, think about increasing the PollingIntervalInSeconds parameter as much as possible for your scenario, to limit how often a new search runbook job needs to be spun up. For example, if you’re ok taking action on an item found by a search runbook every 5 minutes instead of every minute, go with a PollingIntervalInSeconds of 300 (60 seconds * 5 minutes) instead of 60. If every ten minutes is ok, go with 600.
Wrap Up
By now you should understand what Start-Monitor is, why it’s important, how it works, and how it fits in to a larger monitoring process. With Start-Monitor you can easily build monitoring processes without having to worry about the details of monitoring.
Enjoy!