Have you wondered how you can configure Service Management Automation (SMA) to ensure that you are utilizing all of your resources and getting the best performance? In this post I will discuss the stress and performance testing we did on SMA and explain how this testing has resulted in recommendations for system configuration. In order to adapt these suggestions to suit your custom usage, you should understand the benchmarks we used for testing and take into consideration how your usage differs. It is also important to be aware of the resources each component consumes and which components can be scaled and load balanced as your SMA usage increases.
To start, how exactly does the Orchestration team define stress and performance testing? We use stress testing to discover the throughput the SMA system can handle, and to ensure that the system behaves correctly under load. For performance testing, we investigate the system responsiveness in terms of the time it takes for a job to process and the responsiveness of UI elements. For both types of testing, our team created a benchmark model of user behavior defined by runbook characteristics, job throughput, and assets in the system. As you read through this post, think about how your usage differs and how that difference may impact SMA’s performance. You can use this post as an example of how to do your own performance analysis to make sure that you have the optimal configuration for your usage patterns.
An Analysis of SMA Performance and Stress
The recommendations we give later in this post for SMA hardware are a direct result of stress and performance testing. In order to test a system, there needs to be some profiling of the expected conditions. By setting these as targets, we are able to compare the effects of making changes in both configuration and source code.
Modeling SMA Usage for Testing
For performance testing, the throughput was about 22 jobs per minute or 1,320 jobs per hour which is intended to simulate an hour of high usage. For stress testing, 15,000 jobs per hour were run on the system to verify that the system was stable under this load. The runbook jobs were broken into four different categories: small, medium, large, and long running jobs. The runbook characteristics that varied across jobs were total run time, inclusion of remoting calls, and variations in stream writes. While you can’t specify the desired total run time in your runbooks, you can be aware of about how long it typically takes for any particular runbook to complete. If you notice that your jobs are taking longer than they usually take to complete, you should consider adding another runbook worker to improve performance. This documentation on managing runbook worker deployments should get you started with adding workers to your current deployment.
Runbook Job Categories
|
Category Type |
Percent of total jobs |
Run time |
Remoting Calls |
Stream Writes |
|
Small |
20 |
3 seconds |
1 |
4 |
|
Medium |
40 |
15 seconds |
2 |
30 |
|
Large |
20 |
3 minutes |
3 |
100 |
|
Long running |
20 |
20 minutes |
20 |
1 |
In addition to job submission, test traffic patterns also included other calls made through the web service. We simulated this additional traffic by including the calls made by editing runbooks, updating modules, and viewing pages in the portal.
We kept a consistent system state by establishing numbers for other non-job artifacts and kept these numbers constant throughout test runs. These items include:
|
Non-Job Artifact |
Number |
|
Runbooks |
100 |
|
Schedules |
50 |
|
Imported Modules (in addition to system modules) |
10 (the largest is 30MB) |
|
Activities |
2248 |
|
Variables |
500 |
|
Credentials, Connections and Certificates |
75 |
Now, think about how your usage patterns compare. How many of your runbooks typically run concurrently, and what do those runbooks look like? Also, how much output do your runbooks produce? It is a best practice not to write unnecessary output from your runbooks, and you should use logging only for testing and debugging purposes since writing all this data to the database is expensive. You should also be aware of how many checkpoints you write into your workflows. Checkpoints are very useful for protecting your runbooks from unexpected failure and giving them the ability to be re-started without repeating work. However, each checkpoint takes time to persist the job state to the database, so you should be smart about where you include checkpoints. These checkpoints are only persisted to be used during the life of a job. For each runbook job only the latest checkpoint is stored in the database, and this checkpoint is deleted when the job completes.
Configuration
We ran the performance tests with different component combinations of in order to determine the tradeoff between hardware and performance. The same SQL server and machine resources were used for the configuration tests in order to provide a baseline for comparison. We also ran other tests that focused solely either on performance or stress and did not compare configurations. The SQL server in these later tests used a conventional setup. For the configuration tests, we varied the number of web service and runbook worker installations in order to find the optimal setup for the usage patterns described above. We used fixed disks on the hosts with the web service and runbook worker installed.
We used the following setup for each machine:
|
Cores |
Memory (GB) |
Storage |
|
|
SQL Server |
16 |
16 |
SAN storage |
|
Web Service |
2 |
4 |
|
|
Runbook Worker |
2 |
4 |
We ran performance tests using different numbers of each of these components and compared the percentage of maximum possible throughput for each in order to determine the optimal combination. The percentage of maximum possible job throughput is calculated by taking the number of jobs that completed per minute and dividing it by the expected number of jobs completed per minute. The expected number of jobs per minute is determined by the runtime defined in the runbook. For example, small jobs should complete in 3 seconds and medium jobs in 15 seconds.
Architecture Overview
Now that you understand the usage models used in the tests, let’s look at SMA’s architecture and how the test results affect recommendations. I’ll also highlight some of the key metrics that help determine system health, how each of these components are performing, and provide our configuration recommendations. The tests detailed above combined with these recommendations should help you make some decisions about the resources you should allocate for SMA.
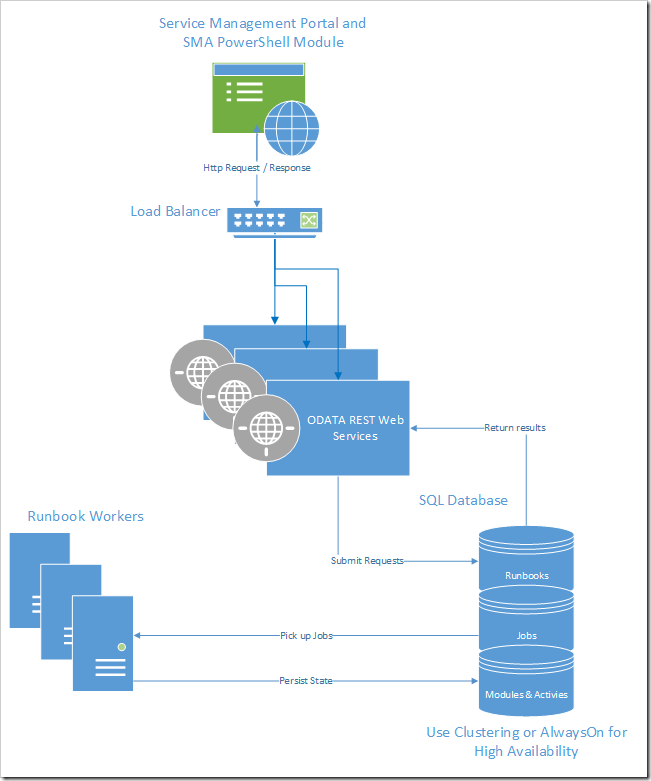
Runbook Workers, the Web Service and the SQL Database are the three key components that you can modify to handle heavier loads. The portal UX and PowerShell are also components of SMA, though there are no modifications you can make to them to improve performance.
Web Service: The web service manages communication with external clients such as the Windows Azure Pack, and it also handles authentication and authorization. There will not be much undo pressure on the web service unless you have many users hitting SMA at once. For high availability, we recommend installing the web service on multiple hosts and using a load balancer between them.
Runbook Worker : Runbook workers execute runbook jobs in SMA. When a job is placed in the database queue, one of the workers will retrieve the job, compile and run the workflow, and persist job information to the database. Each runbook worker picks up jobs and runs them independent of other workers, so you can easily scale by adding additional workers. You can monitor the CPU, memory and IO consumption on each of your runbook workers to get an idea of how the load is affecting your machines. You should have runbook workers installed on at least three machines to meet our suggested performance goals. When we submitted twenty-two jobs per minute, increasing the number of machines from two to three increased the percentage of maximum possible job throughput from 68% to 94%.
SQL Database : The database stores all the information about runbooks, assets, and jobs. Communication with the database is one of the major performance bottlenecks, so you want to ensure that you have the correct setup for your usage. Resource consumption is important when considering the database, since performance can vary depending on write load and the size of the tables. If you have a heavy period of usage and find that the database is consuming a lot of disk space, you may want to consider purging some of the job data from the database. You can read more about how to manage purging the database here .
Portal : SMA is a service in the Windows Azure Pack, and the Service Management portal provides the client interface to all of your runbook authoring, job monitoring, and asset management. The portal’s performance depends largely on the database and how quickly information can be retrieved through the web service. If performance in the portal, particularly on the Automation Dashboard appear slow, you should look at how many jobs you have stored in your database. You can either modify your purging configuration settings or use Set-SmaAdminConfiguration to change the time slices (ChartTimeSliceSampleSize) used to generate the Automation Dashboard.
PowerShell Module: The SMA PowerShell module also acts as a client interface to SMA. You can effectively manage your Automation tasks using this module instead of the portal if you prefer to work in PowerShell.
Conclusions
While we found that using four dedicated machines - one with the web service installed and three with runbook workers installed - produced the best results, this setup did not produce a significantly higher percentage of throughput than using three machines – one web service and three workers where the worker and web service shared a machine. For the load used in our tests, any additional hardware beyond this setup made only marginal difference in the amount of throughput processed. Thus, we recommend installing the web service and the runbook workers together on three machines and using a load balancer on the incoming traffic. The web service should be installed on three hosts (not just one) in order to increase redundancy and ensure high availability.
Comparison of Configurations and Job Throughput
|
Total machines |
Web service Count |
Runbook Worker Count |
Worker/Web Service on shared machine? |
% of Maximum Possible Throughput |
|
4 |
1 |
3 |
No |
94.59% |
|
2 |
1 |
2 |
Yes |
66.50% |
|
3 |
1 |
3 |
Yes |
94.40% |
|
3 |
1 |
2 |
No |
68.25% |
Our tests showed that the number of runbook workers has a significant impact on the number of jobs processed, while the number of machines with web services has a minimal impact on system performance. Installing the runbook workers and the web service on the same machine did not have a major effect on performance, so you should feel comfortable installing these components on the same machine. We also found that even when CPU is high (around 90%) the workers still process jobs efficiently, and high CPU consumption does not signal any need for concern. As you author additional runbooks and put them into production, you should monitor the available resources on each runbook worker and the average time a runbook takes to complete. The SMA Management Pack is a helpful tool that can be used to monitor the health of your web services and runbook workers. You should consider adding additional workers when the average run time of your runbooks increases.
SQL speed was consistently the largest bottleneck throughout our testing, specifically in stress conditions. Be aware of the number of jobs being stored and how frequently you are writing to the database. We also found that it is best to limit the total number of concurrent jobs on any particular worker and have set the default value in the SMA configuration file Orchestrator.Settings.config.
The values in the file are:
- MaxRunningJobs – The number of jobs that can run concurrently in a Sandbox.
- TotalAllowedJobs – The total number of jobs that a Sandbox can process during its lifetime. When this limit is hit, the Sandbox is no longer assigned new jobs and the existing jobs are allowed to complete. After that, the Sandbox is disposed.
- MaxRunningJobsPerWorker – The number of concurrent jobs that can run in all the existing Sandboxes on a Runbook Worker at a time.
- MaxConcurrentSandboxes – The number of Sandboxes that can run on a Runbook Worker at once. A new Sandbox is created to handle new modules versions or to handle the case when the existing sandbox has reached the limit set on TotalAllowedJobs.
The suggested limit on the number of concurrent jobs that can be run on any particular worker (MaxRunningJobsPerWorker) defaults to 120. You can modify this number, although we don’t recommend increasing it unless you know that your workload consists mostly of non-resource-intensive runbooks such as monitoring jobs that don’t consume many resources but that run for long periods of time.
Hopefully, this post has provided some insight on how you can configure SMA for best performance and what you should be aware of when you decide on hardware specifications and number of hosts. Your optimal environment may differ from our specifications depending on your load, but this post outlines the core concepts you should be aware of when making configuration decisions to optimize SMA performance.